Races in Fairfield, New Jersey (NJ) Detailed Stats
Ancestries, Foreign-born residents, place of birth

Recent posts about races in Fairfield, New Jersey on our local forum with over 2,400,000 registered users:

12.6% of Fairfield, NJ residents are foreign-born (7.7% born in Europe, 2.2% born in Asia, 1.9% born in Latin America), which is 82.7% less than the foreign-born rate of 23.0% across the entire state of New Jersey.
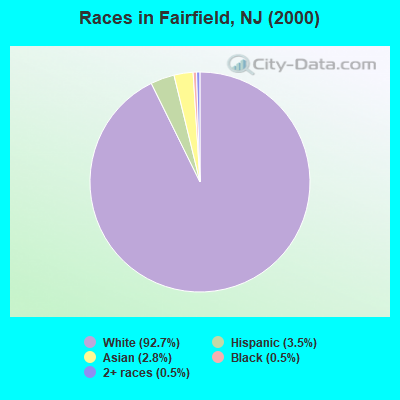
Race distribution in Fairfield

- 6,54492.7%White alone
- 2443.5%Hispanic
- 1992.8%Asian alone
- 360.5%Black alone
- 320.5%Two or more races
- 60.08%American Indian alone
- 20.03%Other race alone
2000
2022
-
- 5,557,20966.0%White alone
- 1,117,19113.3%Hispanic
- 1,096,17113.0%Black alone
- 477,0125.7%Asian alone
- 133,6891.6%Two or more races
- 19,5650.2%Other race alone
- 11,3380.1%American Indian alone
- 2,1750.03%Native Hawaiian and Other
Pacific Islander alone

-
- 4,766,47651.5%White alone
- 2,028,47021.9%Hispanic
- 1,111,63212.0%Black alone
- 923,54610.0%Asian alone
- 332,2373.6%Two or more races
- 89,8471.0%Other race alone
- 8,5570.09%American Indian alone
- 9340.01%Native Hawaiian and Other
Pacific Islander alone

Income and house value in Fairfield
- Median household income in 2022
- $152,451White non-Hispanic householders
- over $200,000Asian householders
- $99,012Some other race householders
- over $200,000Two or more races householders
- $146,500Hispanic or Latino race householders
- Median 2022 house value
- $718,857White Non-Hispanic householders
- over $1,000,000Asian householders
- $426,174Some other race householders
- $732,233Two or more races householders
- $442,696Hispanic or Latino householders
Household income for White non-Hispanic householders

Household income for Asian householders

Household income for Two or more races householders

Household income for Hispanic or Latino race householders

Foreign-born residents in Fairfield
889 residents are foreign born (7.7% Europe, 2.2% Asia, 1.9% Latin America).
| This city: | 12.6% |
| New Jersey: | 17.5% |
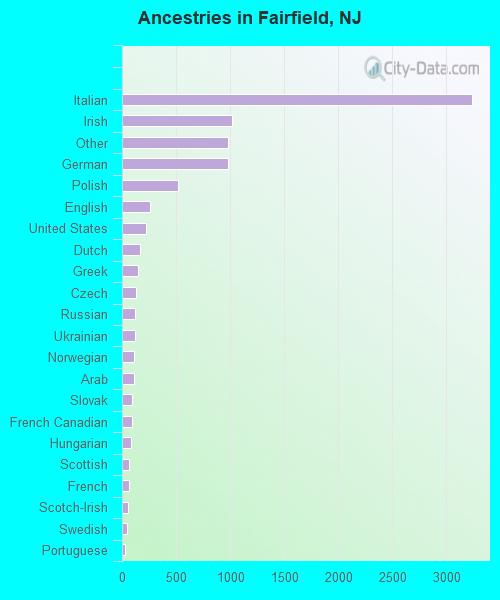
Ancestries in Fairfield

- 3,23537.2%Italian
- 1,01711.7%Irish
- 97811.3%Other
- 97711.2%German
- 5155.9%Polish
- 2623.0%English
- 2212.5%United States
- 1681.9%Dutch
- 1491.7%Greek
- 1251.4%Czech
- 1191.4%Russian
- 1161.3%Ukrainian
- 1101.3%Norwegian
- 1091.3%Arab
- 961.1%Slovak
- 901.0%French Canadian
- 871.0%Hungarian
- 670.8%Scottish
- 640.7%French
- 580.7%Scotch-Irish
- 460.5%Swedish
- 300.3%Portuguese
- 210.2%Welsh
- 150.2%Danish
- 80.09%Swiss
- 60.07%Lithuanian
Zip codes: 07004.