Races in Fairburn, Georgia (GA) Detailed Stats
Data:
Races - White alone (%)
Races - White alone (% change since 2000)
Races - Black alone (%)
Races - Black alone (% change since 2000)
Races - American Indian alone (%)
Races - American Indian alone (% change since 2000)
Races - Asian alone (%)
Races - Asian alone (% change since 2000)
Races - Hispanic (%)
Races - Hispanic (% change since 2000)
Races - Native Hawaiian and Other Pacific Islander alone (%)
Races - Native Hawaiian and Other Pacific Islander alone (% change since 2000)
Races - Two or more races(%)
Races - Two or more races(% change since 2000)
Races - Other race alone (%)
Races - Other race alone (% change since 2000)
Racial diversity
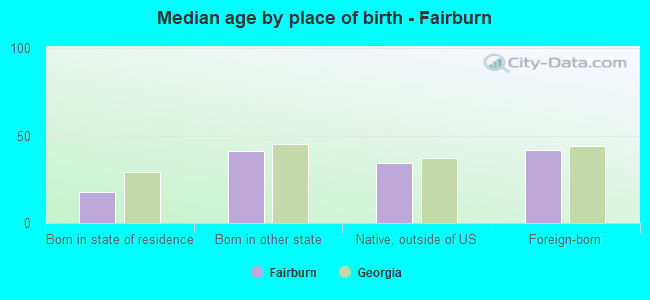
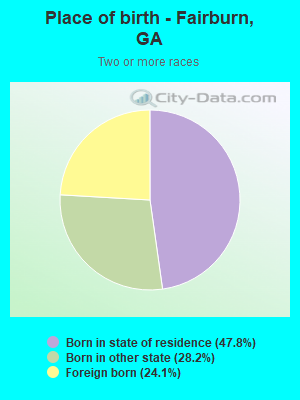
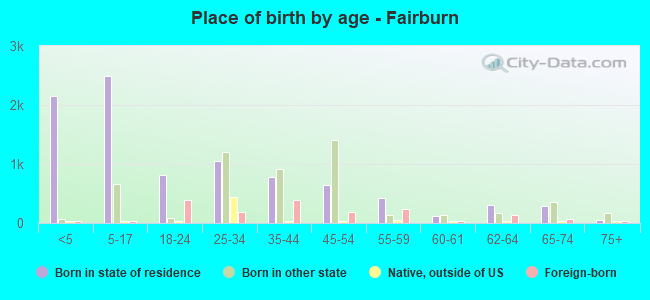
Place of birth - Born in state of residence (%)
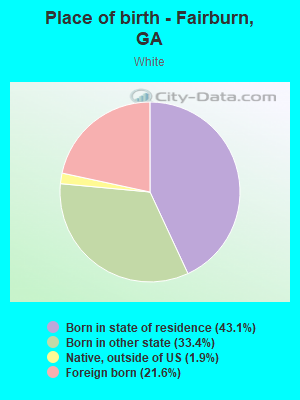
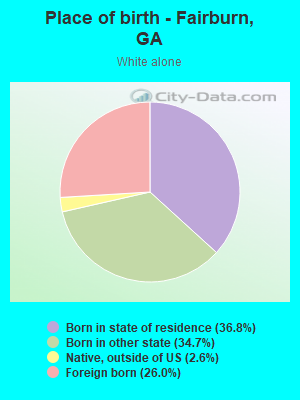
Place of birth - Born in state of residence (%) - White
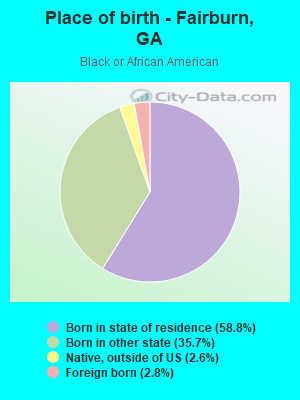
Place of birth - Born in state of residence (%) - Black or African American
Place of birth - Born in state of residence (%) - Asian
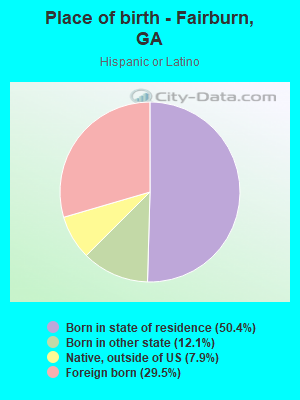
Place of birth - Born in state of residence (%) - Hispanic or Latino
Place of birth - Born in state of residence (%) - American Indian and Alaska Native
Place of birth - Born in state of residence (%) - Multirace
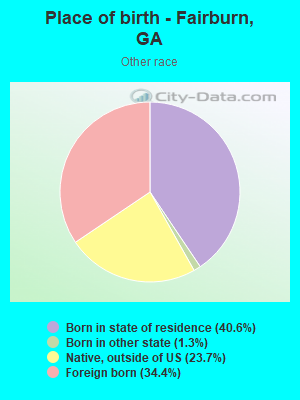
Place of birth - Born in state of residence (%) - Other Race
Place of birth - Born in other state (%)
Place of birth - Born in other state (%) - White
Place of birth - Born in other state (%) - Black or African American
Place of birth - Born in other state (%) - Asian
Place of birth - Born in other state (%) - Hispanic or Latino
Place of birth - Born in other state (%) - American Indian and Alaska Native
Place of birth - Born in other state (%) - Multirace
Place of birth - Born in other state (%) - Other Race
Place of birth - Native, outside of US (%)
Place of birth - Native, outside of US (%) - White
Place of birth - Native, outside of US (%) - Black or African American
Place of birth - Native, outside of US (%) - Asian
Place of birth - Native, outside of US (%) - Hispanic or Latino
Place of birth - Native, outside of US (%) - American Indian and Alaska Native
Place of birth - Native, outside of US (%) - Multirace
Place of birth - Native, outside of US (%) - Other Race
Place of birth - Foreign born (%)
Place of birth - Foreign born (%) - White
Place of birth - Foreign born (%) - Black or African American
Place of birth - Foreign born (%) - Asian
Place of birth - Foreign born (%) - Hispanic or Latino
Place of birth - Foreign born (%) - American Indian and Alaska Native
Place of birth - Foreign born (%) - Multirace
Place of birth - Foreign born (%) - Other Race
Residents speaking English at home (%)
Residents speaking English at home - Born in the United States (%)
Residents speaking English at home - Native, born elsewhere (%)
Residents speaking English at home - Foreign born (%)
Residents speaking Spanish at home (%)
Residents speaking Spanish at home - Born in the United States (%)
Residents speaking Spanish at home - Native, born elsewhere (%)
Residents speaking Spanish at home - Foreign born (%)
Residents speaking other language at home (%)
Residents speaking other language at home - Born in the United States (%)
Residents speaking other language at home - Native, born elsewhere (%)
Residents speaking other language at home - Foreign born (%)
Marital status - Never married (%)
Marital status - Now married (%)
Marital status - Separated (%)
Marital status - Widowed (%)
Marital status - Divorced (%)
Ancestries Reported - Arab (%)
Ancestries Reported - Czech (%)
Ancestries Reported - Danish (%)
Ancestries Reported - Dutch (%)
Ancestries Reported - English (%)
Ancestries Reported - French (%)
Ancestries Reported - French Canadian (%)
Ancestries Reported - German (%)
Ancestries Reported - Greek (%)
Ancestries Reported - Hungarian (%)
Ancestries Reported - Irish (%)
Ancestries Reported - Italian (%)
Ancestries Reported - Lithuanian (%)
Ancestries Reported - Norwegian (%)
Ancestries Reported - Polish (%)
Ancestries Reported - Portuguese (%)
Ancestries Reported - Russian (%)
Ancestries Reported - Scotch-Irish (%)
Ancestries Reported - Scottish (%)
Ancestries Reported - Slovak (%)
Ancestries Reported - Subsaharan African (%)
Ancestries Reported - Swedish (%)
Ancestries Reported - Swiss (%)
Ancestries Reported - Ukrainian (%)
Ancestries Reported - United States (%)
Ancestries Reported - Welsh (%)
Ancestries Reported - West Indian (%)
Ancestries Reported - Other (%)
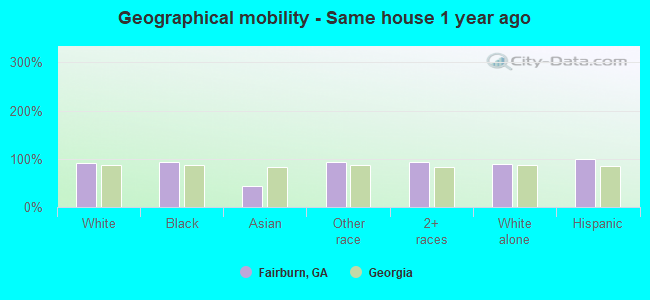
Geographical mobility - Same house 1 year ago (%)
Geographical mobility - Same house 1 year ago (%) - White
Geographical mobility - Same house 1 year ago (%) - Black or African American
Geographical mobility - Same house 1 year ago (%) - Asian
Geographical mobility - Same house 1 year ago (%) - Hispanic or Latino
Geographical mobility - Same house 1 year ago (%) - American Indian and Alaska Native
Geographical mobility - Same house 1 year ago (%) - Multirace
Geographical mobility - Same house 1 year ago (%) - Other Race
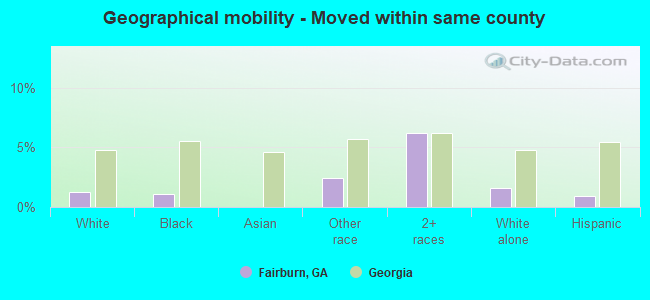
Geographical mobility - Moved within same county (%)
Geographical mobility - Moved within same county (%) - White
Geographical mobility - Moved within same county (%) - Black or African American
Geographical mobility - Moved within same county (%) - Asian
Geographical mobility - Moved within same county (%) - Hispanic or Latino
Geographical mobility - Moved within same county (%) - American Indian and Alaska Native
Geographical mobility - Moved within same county (%) - Multirace
Geographical mobility - Moved within same county (%) - Other Race
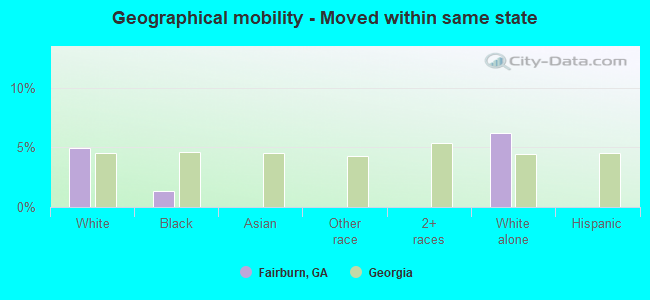
Geographical mobility - Moved from different county within same state (%)
Geographical mobility - Moved from different county within same state (%) - White
Geographical mobility - Moved from different county within same state (%) - Black or African American
Geographical mobility - Moved from different county within same state (%) - Asian
Geographical mobility - Moved from different county within same state (%) - Hispanic or Latino
Geographical mobility - Moved from different county within same state (%) - American Indian and Alaska Native
Geographical mobility - Moved from different county within same state (%) - Multirace
Geographical mobility - Moved from different county within same state (%) - Other Race
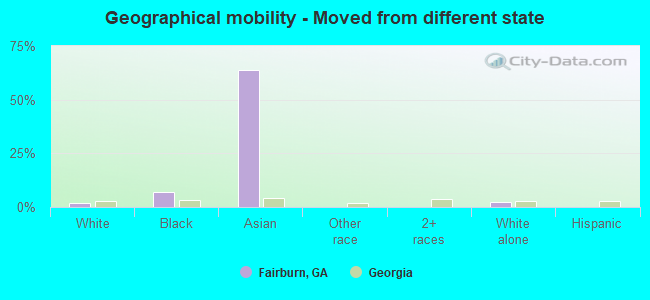
Geographical mobility - Moved from different state (%)
Geographical mobility - Moved from different state (%) - White
Geographical mobility - Moved from different state (%) - Black or African American
Geographical mobility - Moved from different state (%) - Asian
Geographical mobility - Moved from different state (%) - Hispanic or Latino
Geographical mobility - Moved from different state (%) - American Indian and Alaska Native
Geographical mobility - Moved from different state (%) - Multirace
Geographical mobility - Moved from different state (%) - Other Race
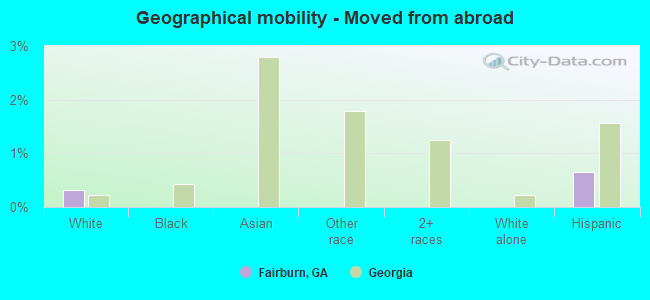
Geographical mobility - Moved from abroad (%)
Geographical mobility - Moved from abroad (%) - White
Geographical mobility - Moved from abroad (%) - Black or African American
Geographical mobility - Moved from abroad (%) - Asian
Geographical mobility - Moved from abroad (%) - Hispanic or Latino
Geographical mobility - Moved from abroad (%) - American Indian and Alaska Native
Geographical mobility - Moved from abroad (%) - Multirace
Geographical mobility - Moved from abroad (%) - Other Race
Place of birth for the foreign-born population - Ireland (%)
Place of birth for the foreign-born population - Denmark (%)
Place of birth for the foreign-born population - Norway (%)
Place of birth for the foreign-born population - Sweden (%)
Place of birth for the foreign-born population - United Kingdom (%)
Place of birth for the foreign-born population - England (%)
Place of birth for the foreign-born population - Scotland (%)
Place of birth for the foreign-born population - Other Northern Europe (%)
Place of birth for the foreign-born population - Austria (%)
Place of birth for the foreign-born population - Belgium (%)
Place of birth for the foreign-born population - France (%)
Place of birth for the foreign-born population - Germany (%)
Place of birth for the foreign-born population - Netherlands (%)
Place of birth for the foreign-born population - Switzerland (%)
Place of birth for the foreign-born population - Other Western Europe (%)
Place of birth for the foreign-born population - Greece (%)
Place of birth for the foreign-born population - Italy (%)
Place of birth for the foreign-born population - Portugal (%)
Place of birth for the foreign-born population - Spain (%)
Place of birth for the foreign-born population - Other Southern Europe (%)
Place of birth for the foreign-born population - Albania (%)
Place of birth for the foreign-born population - Belarus (%)
Place of birth for the foreign-born population - Bosnia and Herzegovina (%)
Place of birth for the foreign-born population - Bulgaria (%)
Place of birth for the foreign-born population - Croatia (%)
Place of birth for the foreign-born population - Czechoslovakia (%)
Place of birth for the foreign-born population - Hungary (%)
Place of birth for the foreign-born population - Latvia (%)
Place of birth for the foreign-born population - Lithuania (%)
Place of birth for the foreign-born population - North Macedonia (Macedonia) (%)
Place of birth for the foreign-born population - Moldova (%)
Place of birth for the foreign-born population - Poland (%)
Place of birth for the foreign-born population - Romania (%)
Place of birth for the foreign-born population - Russia (%)
Place of birth for the foreign-born population - Serbia (%)
Place of birth for the foreign-born population - Ukraine (%)
Place of birth for the foreign-born population - Other Eastern Europe (%)
Place of birth for the foreign-born population - China (%)
Place of birth for the foreign-born population - Hong Kong (%)
Place of birth for the foreign-born population - Taiwan (%)
Place of birth for the foreign-born population - Japan (%)
Place of birth for the foreign-born population - Korea (%)
Place of birth for the foreign-born population - Other Eastern Asia (%)
Place of birth for the foreign-born population - Afghanistan (%)
Place of birth for the foreign-born population - Bangladesh (%)
Place of birth for the foreign-born population - India (%)
Place of birth for the foreign-born population - Iran (%)
Place of birth for the foreign-born population - Kazakhstan (%)
Place of birth for the foreign-born population - Nepal (%)
Place of birth for the foreign-born population - Pakistan (%)
Place of birth for the foreign-born population - Sri Lanka (%)
Place of birth for the foreign-born population - Uzbekistan (%)
Place of birth for the foreign-born population - Other South Central Asia (%)
Place of birth for the foreign-born population - Burma (%)
Place of birth for the foreign-born population - Cambodia (%)
Place of birth for the foreign-born population - Indonesia (%)
Place of birth for the foreign-born population - Laos (%)
Place of birth for the foreign-born population - Malaysia (%)
Place of birth for the foreign-born population - Philippines (%)
Place of birth for the foreign-born population - Singapore (%)
Place of birth for the foreign-born population - Thailand (%)
Place of birth for the foreign-born population - Vietnam (%)
Place of birth for the foreign-born population - Other South Eastern Asia (%)
Place of birth for the foreign-born population - Armenia (%)
Place of birth for the foreign-born population - Iraq (%)
Place of birth for the foreign-born population - Israel (%)
Place of birth for the foreign-born population - Jordan (%)
Place of birth for the foreign-born population - Kuwait (%)
Place of birth for the foreign-born population - Lebanon (%)
Place of birth for the foreign-born population - Saudi Arabia (%)
Place of birth for the foreign-born population - Syria (%)
Place of birth for the foreign-born population - Turkey (%)
Place of birth for the foreign-born population - Yemen (%)
Place of birth for the foreign-born population - Other Western Asia (%)
Place of birth for the foreign-born population - Eritrea (%)
Place of birth for the foreign-born population - Ethiopia (%)
Place of birth for the foreign-born population - Kenya (%)
Place of birth for the foreign-born population - Somalia (%)
Place of birth for the foreign-born population - Uganda (%)
Place of birth for the foreign-born population - Zimbabwe (%)
Place of birth for the foreign-born population - Other Eastern Africa (%)
Place of birth for the foreign-born population - Cameroon (%)
Place of birth for the foreign-born population - Congo (%)
Place of birth for the foreign-born population - Democratic Republic of Congo (Zaire) (%)
Place of birth for the foreign-born population - Other Middle Africa (%)
Place of birth for the foreign-born population - Egypt (%)
Place of birth for the foreign-born population - Morocco (%)
Place of birth for the foreign-born population - Sudan (%)
Place of birth for the foreign-born population - Other Northern Africa (%)
Place of birth for the foreign-born population - South Africa (%)
Place of birth for the foreign-born population - Other Southern Africa (%)
Place of birth for the foreign-born population - Cabo Verde (%)
Place of birth for the foreign-born population - Ghana (%)
Place of birth for the foreign-born population - Liberia (%)
Place of birth for the foreign-born population - Nigeria (%)
Place of birth for the foreign-born population - Senegal (%)
Place of birth for the foreign-born population - Sierra Leone (%)
Place of birth for the foreign-born population - Other Western Africa (%)
Place of birth for the foreign-born population - Australia (%)
Place of birth for the foreign-born population - New Zealand (%)
Place of birth for the foreign-born population - Fiji (%)
Place of birth for the foreign-born population - Micronesia (%)
Place of birth for the foreign-born population - Bahamas (%)
Place of birth for the foreign-born population - Barbados (%)
Place of birth for the foreign-born population - Cuba (%)
Place of birth for the foreign-born population - Dominica (%)
Place of birth for the foreign-born population - Dominican Republic (%)
Place of birth for the foreign-born population - Grenada (%)
Place of birth for the foreign-born population - Haiti (%)
Place of birth for the foreign-born population - Jamaica (%)
Place of birth for the foreign-born population - St. Vincent and the Grenadines (%)
Place of birth for the foreign-born population - Trinidad and Tobago (%)
Place of birth for the foreign-born population - West Indies (%)
Place of birth for the foreign-born population - Other Caribbean (%)
Place of birth for the foreign-born population - Belize (%)
Place of birth for the foreign-born population - Costa Rica (%)
Place of birth for the foreign-born population - El Salvador (%)
Place of birth for the foreign-born population - Guatemala (%)
Place of birth for the foreign-born population - Honduras (%)
Place of birth for the foreign-born population - Mexico (%)
Place of birth for the foreign-born population - Nicaragua (%)
Place of birth for the foreign-born population - Panama (%)
Place of birth for the foreign-born population - Other Central America (%)
Place of birth for the foreign-born population - Argentina (%)
Place of birth for the foreign-born population - Bolivia (%)
Place of birth for the foreign-born population - Brazil (%)
Place of birth for the foreign-born population - Chile (%)
Place of birth for the foreign-born population - Colombia (%)
Place of birth for the foreign-born population - Ecuador (%)
Place of birth for the foreign-born population - Guyana (%)
Place of birth for the foreign-born population - Peru (%)
Place of birth for the foreign-born population - Uruguay (%)
Place of birth for the foreign-born population - Venezuela (%)
Place of birth for the foreign-born population - Other South America (%)
Place of birth for the foreign-born population - Canada (%)
Place of birth for the foreign-born population - Other Northern America (%)
Place of birth for the foreign-born population - Other (%)
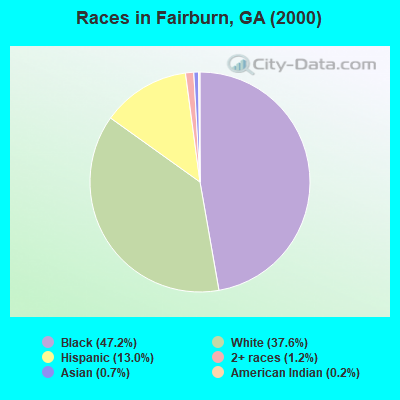
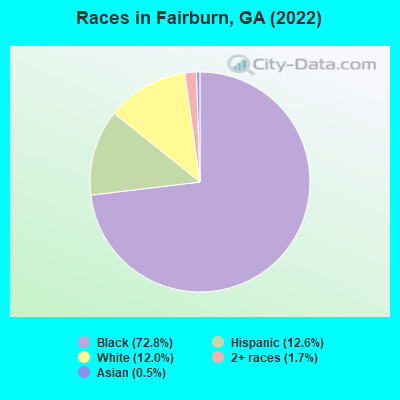
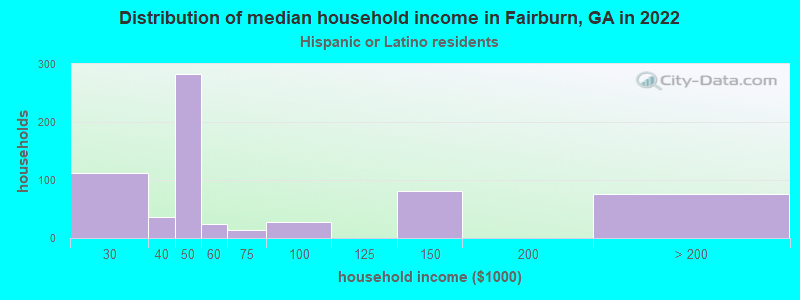
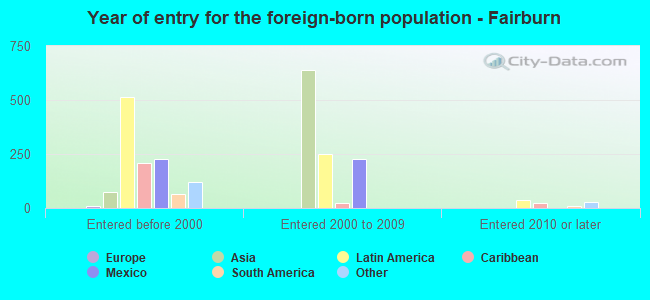
According to 2022 data, the most numerous races in Fairburn, GA are White alone (1,996 residents), Black alone (12,127 residents), and Hispanic (2,095 residents). 77.0% of Fairburn residents speak English at home. 9.9% of Fairburn, GA residents are foreign-born (4.8% born in Latin America, 4.0% born in Asia), which is about the same as the foreign-born rate of 10.0% across the entire state of Georgia.
Race distribution in Fairburn
2000 2022
5,128,661 62.6% White alone 2,331,465 28.5% Black alone 435,227 5.3% Hispanic 171,513 2.1% Asian alone 87,364 1.1% Two or more races 17,670 0.2% American Indian alone 11,275 0.1% Other race alone 3,278 0.04% Native Hawaiian and Other
5,415,657 49.6% White alone 3,349,240 30.7% Black alone 1,132,604 10.4% Hispanic 479,156 4.4% Asian alone 462,923 4.2% Two or more races 54,416 0.5% Other race alone 11,923 0.1% American Indian alone 6,957 0.06% Native Hawaiian and Other
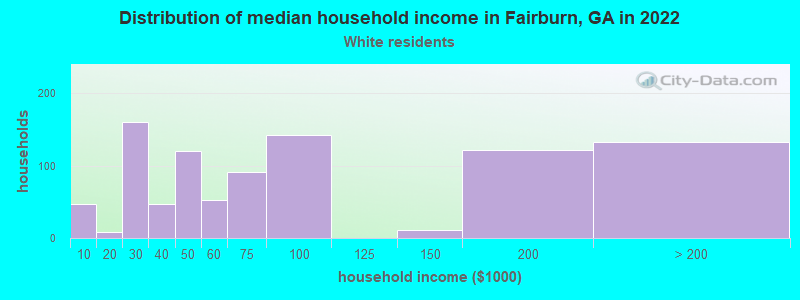
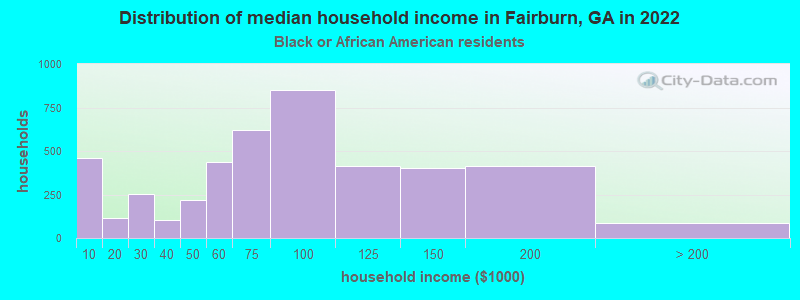
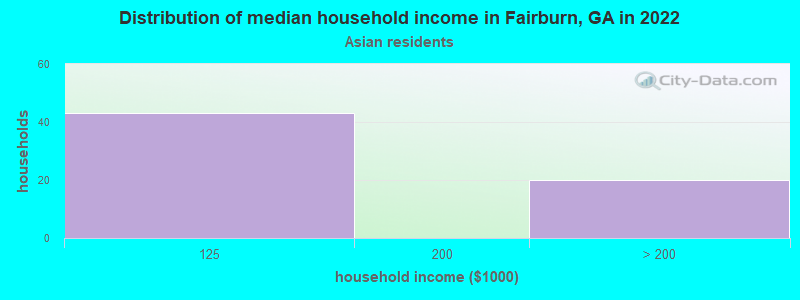
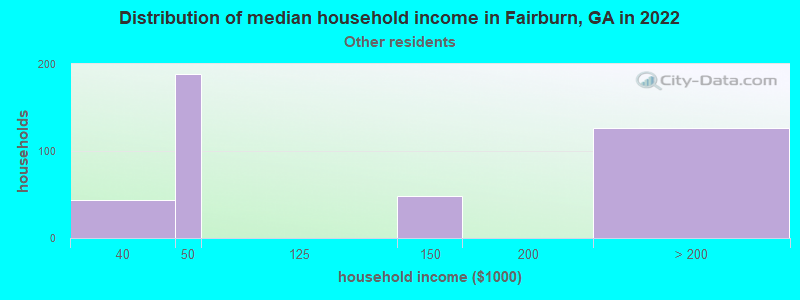
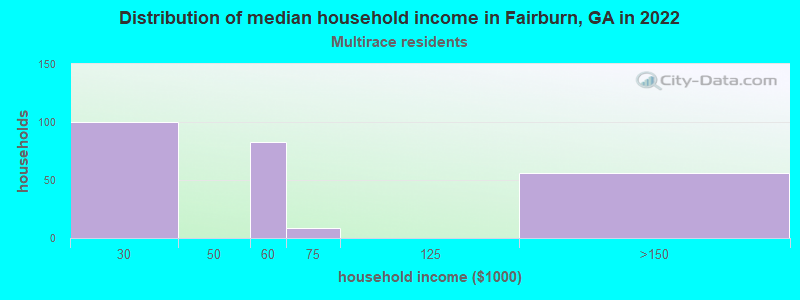
Income and house value in Fairburn Median household income in 2022 $63,858 White non-Hispanic householders$78,065 Black householders$50,553 Hispanic or Latino race householdersMedian 2022 house value $236,238 White Non-Hispanic householders$252,870 Black or African American householders $194,915 Asian householders$232,339 Some other race householders$279,379 Two or more races householders$220,904 Hispanic or Latino householders
Median age by race in Fairburn
43.1 Median age for White residents47.5 42.7 30.0 Median age for Black or African American residents18.7 35.2 -764,932,561.9 Median age for American Indian / Alaska Native residents-507,017,543.4 -1,009,920,633.9 73.6 Median age for Asian residents-696,165,191.0 -704,761,904.1 -866,062,436.2 Median age for Native Hawaiian / Pacific Islander residents-658,602,149.9 -776,776,776.0 25.4 Median age for Other race residents13.6 29.4 17.1 Median age for Two or more races residents33.3 16.2 49.9 Median age for White alone residents49.4 55.6 17.8 Median age for Hispanic or Latino residents26.1 14.2
Owner/renter occupied households by race in Fairburn
House owners and renters - White residents 515 54.7% Owner occupied426 45.3% Renter occupiedHouse owners and renters - Black or African American residents 2,689 61.5% Owner occupied1,682 38.5% Renter occupiedHouse owners and renters - Asian residents 19 30.2% Owner occupied44 69.8% Renter occupiedHouse owners and renters - Other race residents 141 34.0% Owner occupied274 66.0% Renter occupiedHouse owners and renters - Two or more races residents 199 73.2% Owner occupied73 26.8% Renter occupiedHouse owners and renters - White alone residents 441 49.7% Owner occupied446 50.3% Renter occupiedHouse owners and renters - Hispanic or Latino residents 284 47.5% Owner occupied313 52.5% Renter occupied
Language usage in Fairburn
English speakers - Total 77.0% of residents of Fairburn speak English at home.
16.3% of residents speak Spanish at home 1,535 65.3% Speak English very well814 34.7% Speak English less than very well7.2% of residents speak other language at home 604 58.2% Speak English very well433 41.8% Speak English less than very well
English speakers - Born in the United States 89.2% of residents of Fairburn speak English at home.
7.4% of residents speak Spanish at home 338 87.3% Speak English very well49 12.7% Speak English less than very well4.1% of residents speak other language at home 74 34.4% Speak English very well141 65.6% Speak English less than very well
English speakers - Native, born elsewhere 30.4% of residents of Fairburn speak English at home.
18.4% of residents speak Spanish at home 27 31.0% Speak English very well60 69.0% Speak English less than very well56.5% of residents speak other language at home 268 100.0% Speak English very well
English speakers - Foreign-born 22.3% of residents of Fairburn speak English at home.
42.1% of residents speak Spanish at home 285 42.4% Speak English very well387 57.6% Speak English less than very well38.0% of residents speak other language at home 294 48.4% Speak English very well313 51.6% Speak English less than very well
White (Caucasian) - Speak only English Native:
73.9% (1,197)Foreign-born:
23.0% (106)
White (Caucasian) - Speak another language Native:
19.9% (323)Foreign-born:
74.2% (344)
Black or African American - Speak only English Native:
90.5% (9,065)Foreign-born:
75.3% (262)
Black or African American - Speak another language Native:
8.8% (879)Foreign-born:
25.9% (90)
Other race - Speak another language Native:
87.1% (635)Foreign-born:
100.0% (470)
Two or more races - Speak another language Native:
49.6% (247)Foreign-born:
100.0% (209)
White alone - Speak only English Native:
85.0% (1,161)Foreign-born:
23.1% (113)
White alone - Speak another language Native:
16.4% (224)Foreign-born:
76.2% (372)
Hispanic or Latino - Speak another language Native:
86.6% (931)Foreign-born:
100.0% (621)
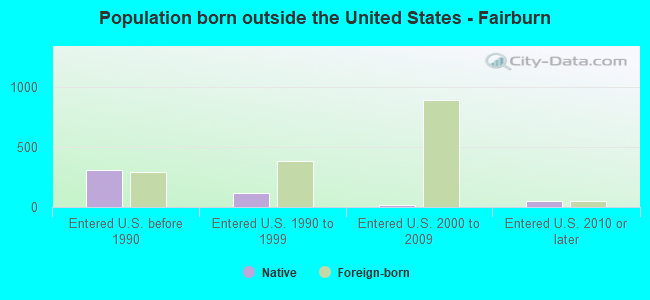
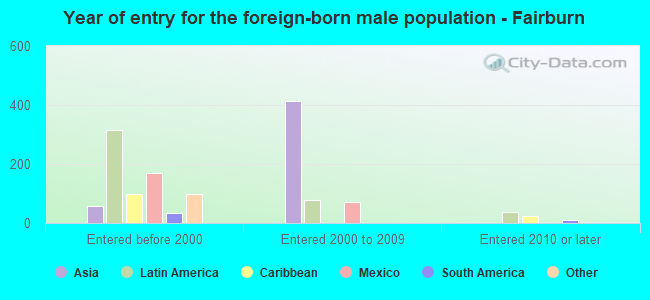
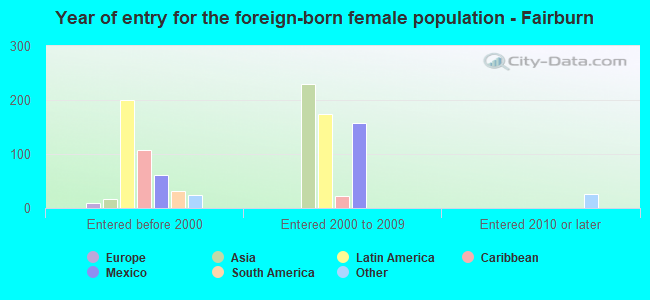
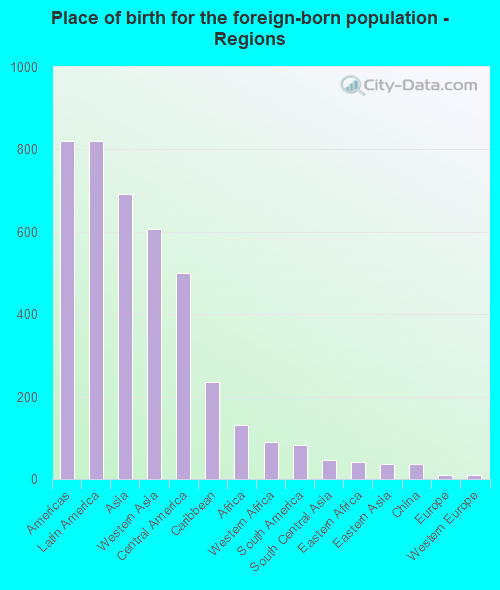
Foreign-born residents in Fairburn 1,657 residents are foreign born (4.8% Latin America , 4.0% Asia ).
This city:
9.9%Georgia:
10.4%
Marital status for residents in Fairburn Marital status - White (Caucasian) population 15 years and over
Males 34.2% Never married43.6% Now married0.0% Separated5.6% Widowed16.6% DivorcedFemales 44.9% Never married41.4% Now married0.0% Separated7.4% Widowed6.3% DivorcedWomen who did not give birth in the past 12 months Now married:
26.0% (136)Unmarried:
74.0% (386)
Marital status - Black or African American population 15 years and over
Males 60.4% Never married25.4% Now married0.0% Separated0.0% Widowed14.2% DivorcedFemales 53.3% Never married18.6% Now married0.0% Separated6.7% Widowed21.4% DivorcedWomen who gave birth in the past 12 months Now married:
65.4% (160)Unmarried:
34.6% (85)
Women who did not give birth in the past 12 months Now married:
14.5% (492)Unmarried:
85.5% (2,901)
Marital status - Asian population 15 years and over
Males 0.0% Never married27.0% Now married0.0% Separated0.0% Widowed73.0% DivorcedFemales 0.0% Never married100.0% Now married0.0% Separated0.0% Widowed0.0% DivorcedMarital status - Other race population 15 years and over
Males 10.1% Never married89.9% Now married0.0% Separated0.0% Widowed0.0% DivorcedFemales 8.9% Never married91.1% Now married0.0% Separated0.0% Widowed0.0% DivorcedWomen who did not give birth in the past 12 months Now married:
90.1% (242)Unmarried:
9.9% (27)
Marital status - Two or more races population 15 years and over
Males 27.7% Never married72.3% Now married0.0% Separated0.0% Widowed0.0% DivorcedFemales 23.4% Never married51.6% Now married25.0% Separated0.0% Widowed0.0% DivorcedWomen who did not give birth in the past 12 months Now married:
63.0% (112)Unmarried:
37.0% (66)
Marital status - White alone, not Hispanic / Latino population 15 years and over
Males 37.6% Never married39.7% Now married0.0% Separated6.1% Widowed16.5% DivorcedFemales 42.5% Never married41.0% Now married0.0% Separated8.9% Widowed7.6% DivorcedWomen who did not give birth in the past 12 months Now married:
18.1% (67)Unmarried:
81.9% (303)
Marital status - Hispanic or Latino population 15 years and over
Males 23.4% Never married73.3% Now married0.0% Separated0.0% Widowed3.3% DivorcedFemales 27.2% Never married64.4% Now married8.5% Separated0.0% Widowed0.0% DivorcedWomen who did not give birth in the past 12 months Now married:
67.7% (333)Unmarried:
32.3% (159)
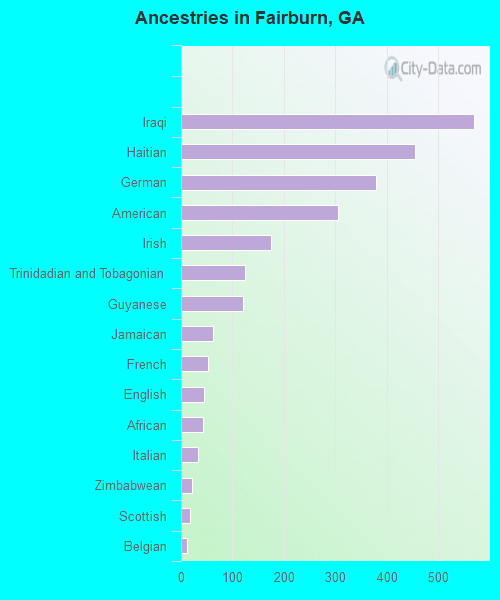
Ancestries in Fairburn
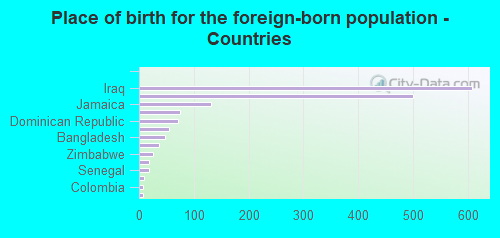
570 5.8% Iraqi454 4.6% Haitian379 3.8% German306 3.1% American174 1.8% Irish124 1.3% Trinidadian and Tobagonian120 1.2% Guyanese62 0.6% Jamaican52 0.5% French45 0.5% English42 0.4% African33 0.3% Italian22 0.2% Zimbabwean17 0.2% Scottish12 0.1% Belgian4 0.04% Bahamian
Children Nativity (place of birth) in Fairburn
Children under 6 years - Living with two parents Both parents native 438 100.0% NativeBoth parents foreign-born 81 100.0% NativeOne native, one foreign-born parent 21 100.0% NativeChildren under 6 years - Living with one parent Native parent 902 100.0% NativeForeign-born parent 58 100.0% NativeChildren 6 to 17 years - Living with two parents Both parents native 565 100.0% NativeBoth parents foreign-born 526 100.0% NativeOne native, one foreign-born parent 74 100.0% NativeChildren 6 to 17 years - Living with one parent Native parent 1,592 100.0% NativeForeign-born parent 82 53.0% Native73 47.0% Foreign-born
Grandparents responsible for own grandchildren in Fairburn
Grandparents (30 to 59 years) Black or African American 56 59.3% Responsible for grandchildren38 40.7% Not responsible for grandchildren
Grandparents (60 years and over) Black or African American 285 100.0% Not responsible for grandchildren