Races in Fair Oaks, Virginia (VA) Detailed Stats
Data:
Races - White alone (%)
Races - White alone (% change since 2000)
Races - Black alone (%)
Races - Black alone (% change since 2000)
Races - American Indian alone (%)
Races - American Indian alone (% change since 2000)
Races - Asian alone (%)
Races - Asian alone (% change since 2000)
Races - Hispanic (%)
Races - Hispanic (% change since 2000)
Races - Native Hawaiian and Other Pacific Islander alone (%)
Races - Native Hawaiian and Other Pacific Islander alone (% change since 2000)
Races - Two or more races(%)
Races - Two or more races(% change since 2000)
Races - Other race alone (%)
Races - Other race alone (% change since 2000)
Racial diversity
Place of birth - Born in state of residence (%)
Place of birth - Born in state of residence (%) - White
Place of birth - Born in state of residence (%) - Black or African American
Place of birth - Born in state of residence (%) - Asian
Place of birth - Born in state of residence (%) - Hispanic or Latino
Place of birth - Born in state of residence (%) - American Indian and Alaska Native
Place of birth - Born in state of residence (%) - Multirace
Place of birth - Born in state of residence (%) - Other Race
Place of birth - Born in other state (%)
Place of birth - Born in other state (%) - White
Place of birth - Born in other state (%) - Black or African American
Place of birth - Born in other state (%) - Asian
Place of birth - Born in other state (%) - Hispanic or Latino
Place of birth - Born in other state (%) - American Indian and Alaska Native
Place of birth - Born in other state (%) - Multirace
Place of birth - Born in other state (%) - Other Race
Place of birth - Native, outside of US (%)
Place of birth - Native, outside of US (%) - White
Place of birth - Native, outside of US (%) - Black or African American
Place of birth - Native, outside of US (%) - Asian
Place of birth - Native, outside of US (%) - Hispanic or Latino
Place of birth - Native, outside of US (%) - American Indian and Alaska Native
Place of birth - Native, outside of US (%) - Multirace
Place of birth - Native, outside of US (%) - Other Race
Place of birth - Foreign born (%)
Place of birth - Foreign born (%) - White
Place of birth - Foreign born (%) - Black or African American
Place of birth - Foreign born (%) - Asian
Place of birth - Foreign born (%) - Hispanic or Latino
Place of birth - Foreign born (%) - American Indian and Alaska Native
Place of birth - Foreign born (%) - Multirace
Place of birth - Foreign born (%) - Other Race
Residents speaking English at home (%)
Residents speaking English at home - Born in the United States (%)
Residents speaking English at home - Native, born elsewhere (%)
Residents speaking English at home - Foreign born (%)
Residents speaking Spanish at home (%)
Residents speaking Spanish at home - Born in the United States (%)
Residents speaking Spanish at home - Native, born elsewhere (%)
Residents speaking Spanish at home - Foreign born (%)
Residents speaking other language at home (%)
Residents speaking other language at home - Born in the United States (%)
Residents speaking other language at home - Native, born elsewhere (%)
Residents speaking other language at home - Foreign born (%)
Marital status - Never married (%)
Marital status - Now married (%)
Marital status - Separated (%)
Marital status - Widowed (%)
Marital status - Divorced (%)
Ancestries Reported - Arab (%)
Ancestries Reported - Czech (%)
Ancestries Reported - Danish (%)
Ancestries Reported - Dutch (%)
Ancestries Reported - English (%)
Ancestries Reported - French (%)
Ancestries Reported - French Canadian (%)
Ancestries Reported - German (%)
Ancestries Reported - Greek (%)
Ancestries Reported - Hungarian (%)
Ancestries Reported - Irish (%)
Ancestries Reported - Italian (%)
Ancestries Reported - Lithuanian (%)
Ancestries Reported - Norwegian (%)
Ancestries Reported - Polish (%)
Ancestries Reported - Portuguese (%)
Ancestries Reported - Russian (%)
Ancestries Reported - Scotch-Irish (%)
Ancestries Reported - Scottish (%)
Ancestries Reported - Slovak (%)
Ancestries Reported - Subsaharan African (%)
Ancestries Reported - Swedish (%)
Ancestries Reported - Swiss (%)
Ancestries Reported - Ukrainian (%)
Ancestries Reported - United States (%)
Ancestries Reported - Welsh (%)
Ancestries Reported - West Indian (%)
Ancestries Reported - Other (%)
Geographical mobility - Same house 1 year ago (%)
Geographical mobility - Same house 1 year ago (%) - White
Geographical mobility - Same house 1 year ago (%) - Black or African American
Geographical mobility - Same house 1 year ago (%) - Asian
Geographical mobility - Same house 1 year ago (%) - Hispanic or Latino
Geographical mobility - Same house 1 year ago (%) - American Indian and Alaska Native
Geographical mobility - Same house 1 year ago (%) - Multirace
Geographical mobility - Same house 1 year ago (%) - Other Race
Geographical mobility - Moved within same county (%)
Geographical mobility - Moved within same county (%) - White
Geographical mobility - Moved within same county (%) - Black or African American
Geographical mobility - Moved within same county (%) - Asian
Geographical mobility - Moved within same county (%) - Hispanic or Latino
Geographical mobility - Moved within same county (%) - American Indian and Alaska Native
Geographical mobility - Moved within same county (%) - Multirace
Geographical mobility - Moved within same county (%) - Other Race
Geographical mobility - Moved from different county within same state (%)
Geographical mobility - Moved from different county within same state (%) - White
Geographical mobility - Moved from different county within same state (%) - Black or African American
Geographical mobility - Moved from different county within same state (%) - Asian
Geographical mobility - Moved from different county within same state (%) - Hispanic or Latino
Geographical mobility - Moved from different county within same state (%) - American Indian and Alaska Native
Geographical mobility - Moved from different county within same state (%) - Multirace
Geographical mobility - Moved from different county within same state (%) - Other Race
Geographical mobility - Moved from different state (%)
Geographical mobility - Moved from different state (%) - White
Geographical mobility - Moved from different state (%) - Black or African American
Geographical mobility - Moved from different state (%) - Asian
Geographical mobility - Moved from different state (%) - Hispanic or Latino
Geographical mobility - Moved from different state (%) - American Indian and Alaska Native
Geographical mobility - Moved from different state (%) - Multirace
Geographical mobility - Moved from different state (%) - Other Race
Geographical mobility - Moved from abroad (%)
Geographical mobility - Moved from abroad (%) - White
Geographical mobility - Moved from abroad (%) - Black or African American
Geographical mobility - Moved from abroad (%) - Asian
Geographical mobility - Moved from abroad (%) - Hispanic or Latino
Geographical mobility - Moved from abroad (%) - American Indian and Alaska Native
Geographical mobility - Moved from abroad (%) - Multirace
Geographical mobility - Moved from abroad (%) - Other Race
Place of birth for the foreign-born population - Ireland (%)
Place of birth for the foreign-born population - Denmark (%)
Place of birth for the foreign-born population - Norway (%)
Place of birth for the foreign-born population - Sweden (%)
Place of birth for the foreign-born population - United Kingdom (%)
Place of birth for the foreign-born population - England (%)
Place of birth for the foreign-born population - Scotland (%)
Place of birth for the foreign-born population - Other Northern Europe (%)
Place of birth for the foreign-born population - Austria (%)
Place of birth for the foreign-born population - Belgium (%)
Place of birth for the foreign-born population - France (%)
Place of birth for the foreign-born population - Germany (%)
Place of birth for the foreign-born population - Netherlands (%)
Place of birth for the foreign-born population - Switzerland (%)
Place of birth for the foreign-born population - Other Western Europe (%)
Place of birth for the foreign-born population - Greece (%)
Place of birth for the foreign-born population - Italy (%)
Place of birth for the foreign-born population - Portugal (%)
Place of birth for the foreign-born population - Spain (%)
Place of birth for the foreign-born population - Other Southern Europe (%)
Place of birth for the foreign-born population - Albania (%)
Place of birth for the foreign-born population - Belarus (%)
Place of birth for the foreign-born population - Bosnia and Herzegovina (%)
Place of birth for the foreign-born population - Bulgaria (%)
Place of birth for the foreign-born population - Croatia (%)
Place of birth for the foreign-born population - Czechoslovakia (%)
Place of birth for the foreign-born population - Hungary (%)
Place of birth for the foreign-born population - Latvia (%)
Place of birth for the foreign-born population - Lithuania (%)
Place of birth for the foreign-born population - North Macedonia (Macedonia) (%)
Place of birth for the foreign-born population - Moldova (%)
Place of birth for the foreign-born population - Poland (%)
Place of birth for the foreign-born population - Romania (%)
Place of birth for the foreign-born population - Russia (%)
Place of birth for the foreign-born population - Serbia (%)
Place of birth for the foreign-born population - Ukraine (%)
Place of birth for the foreign-born population - Other Eastern Europe (%)
Place of birth for the foreign-born population - China (%)
Place of birth for the foreign-born population - Hong Kong (%)
Place of birth for the foreign-born population - Taiwan (%)
Place of birth for the foreign-born population - Japan (%)
Place of birth for the foreign-born population - Korea (%)
Place of birth for the foreign-born population - Other Eastern Asia (%)
Place of birth for the foreign-born population - Afghanistan (%)
Place of birth for the foreign-born population - Bangladesh (%)
Place of birth for the foreign-born population - India (%)
Place of birth for the foreign-born population - Iran (%)
Place of birth for the foreign-born population - Kazakhstan (%)
Place of birth for the foreign-born population - Nepal (%)
Place of birth for the foreign-born population - Pakistan (%)
Place of birth for the foreign-born population - Sri Lanka (%)
Place of birth for the foreign-born population - Uzbekistan (%)
Place of birth for the foreign-born population - Other South Central Asia (%)
Place of birth for the foreign-born population - Burma (%)
Place of birth for the foreign-born population - Cambodia (%)
Place of birth for the foreign-born population - Indonesia (%)
Place of birth for the foreign-born population - Laos (%)
Place of birth for the foreign-born population - Malaysia (%)
Place of birth for the foreign-born population - Philippines (%)
Place of birth for the foreign-born population - Singapore (%)
Place of birth for the foreign-born population - Thailand (%)
Place of birth for the foreign-born population - Vietnam (%)
Place of birth for the foreign-born population - Other South Eastern Asia (%)
Place of birth for the foreign-born population - Armenia (%)
Place of birth for the foreign-born population - Iraq (%)
Place of birth for the foreign-born population - Israel (%)
Place of birth for the foreign-born population - Jordan (%)
Place of birth for the foreign-born population - Kuwait (%)
Place of birth for the foreign-born population - Lebanon (%)
Place of birth for the foreign-born population - Saudi Arabia (%)
Place of birth for the foreign-born population - Syria (%)
Place of birth for the foreign-born population - Turkey (%)
Place of birth for the foreign-born population - Yemen (%)
Place of birth for the foreign-born population - Other Western Asia (%)
Place of birth for the foreign-born population - Eritrea (%)
Place of birth for the foreign-born population - Ethiopia (%)
Place of birth for the foreign-born population - Kenya (%)
Place of birth for the foreign-born population - Somalia (%)
Place of birth for the foreign-born population - Uganda (%)
Place of birth for the foreign-born population - Zimbabwe (%)
Place of birth for the foreign-born population - Other Eastern Africa (%)
Place of birth for the foreign-born population - Cameroon (%)
Place of birth for the foreign-born population - Congo (%)
Place of birth for the foreign-born population - Democratic Republic of Congo (Zaire) (%)
Place of birth for the foreign-born population - Other Middle Africa (%)
Place of birth for the foreign-born population - Egypt (%)
Place of birth for the foreign-born population - Morocco (%)
Place of birth for the foreign-born population - Sudan (%)
Place of birth for the foreign-born population - Other Northern Africa (%)
Place of birth for the foreign-born population - South Africa (%)
Place of birth for the foreign-born population - Other Southern Africa (%)
Place of birth for the foreign-born population - Cabo Verde (%)
Place of birth for the foreign-born population - Ghana (%)
Place of birth for the foreign-born population - Liberia (%)
Place of birth for the foreign-born population - Nigeria (%)
Place of birth for the foreign-born population - Senegal (%)
Place of birth for the foreign-born population - Sierra Leone (%)
Place of birth for the foreign-born population - Other Western Africa (%)
Place of birth for the foreign-born population - Australia (%)
Place of birth for the foreign-born population - New Zealand (%)
Place of birth for the foreign-born population - Fiji (%)
Place of birth for the foreign-born population - Micronesia (%)
Place of birth for the foreign-born population - Bahamas (%)
Place of birth for the foreign-born population - Barbados (%)
Place of birth for the foreign-born population - Cuba (%)
Place of birth for the foreign-born population - Dominica (%)
Place of birth for the foreign-born population - Dominican Republic (%)
Place of birth for the foreign-born population - Grenada (%)
Place of birth for the foreign-born population - Haiti (%)
Place of birth for the foreign-born population - Jamaica (%)
Place of birth for the foreign-born population - St. Vincent and the Grenadines (%)
Place of birth for the foreign-born population - Trinidad and Tobago (%)
Place of birth for the foreign-born population - West Indies (%)
Place of birth for the foreign-born population - Other Caribbean (%)
Place of birth for the foreign-born population - Belize (%)
Place of birth for the foreign-born population - Costa Rica (%)
Place of birth for the foreign-born population - El Salvador (%)
Place of birth for the foreign-born population - Guatemala (%)
Place of birth for the foreign-born population - Honduras (%)
Place of birth for the foreign-born population - Mexico (%)
Place of birth for the foreign-born population - Nicaragua (%)
Place of birth for the foreign-born population - Panama (%)
Place of birth for the foreign-born population - Other Central America (%)
Place of birth for the foreign-born population - Argentina (%)
Place of birth for the foreign-born population - Bolivia (%)
Place of birth for the foreign-born population - Brazil (%)
Place of birth for the foreign-born population - Chile (%)
Place of birth for the foreign-born population - Colombia (%)
Place of birth for the foreign-born population - Ecuador (%)
Place of birth for the foreign-born population - Guyana (%)
Place of birth for the foreign-born population - Peru (%)
Place of birth for the foreign-born population - Uruguay (%)
Place of birth for the foreign-born population - Venezuela (%)
Place of birth for the foreign-born population - Other South America (%)
Place of birth for the foreign-born population - Canada (%)
Place of birth for the foreign-born population - Other Northern America (%)
Place of birth for the foreign-born population - Other (%)
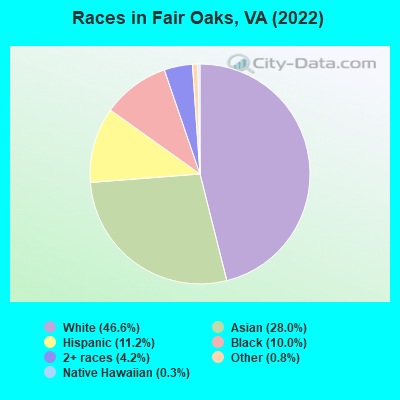
According to 2022 data, the most numerous races in Fair Oaks, VA are White alone (16,423 residents), Black alone (3,506 residents), and Hispanic (3,942 residents). 58.6% of Fair Oaks residents speak English at home.
Race distribution in Fair Oaks 16,423 46.6% White alone 9,845 28.0% Asian alone 3,942 11.2% Hispanic 3,506 10.0% Black alone 1,466 4.2% Two or more races 276 0.8% Other race alone 98 0.3% Native Hawaiian and Other
2000 2022
4,965,637 70.2% White alone 1,376,378 19.4% Black alone 329,540 4.7% Hispanic 259,277 3.7% Asian alone 114,022 1.6% Two or more races 18,596 0.3% American Indian alone 11,685 0.2% Other race alone 3,380 0.05% Native Hawaiian and Other
5,095,130 58.7% White alone 1,594,785 18.4% Black alone 905,750 10.4% Hispanic 602,881 6.9% Asian alone 406,047 4.7% Two or more races 60,419 0.7% Other race alone 11,738 0.1% American Indian alone 6,869 0.08% Native Hawaiian and Other
Income and house value in Fair Oaks Median household income in 2022 $116,324 White non-Hispanic householders$105,228 Black householders$175,657 Asian householders$70,253 Two or more races householders$116,150 Hispanic or Latino race householders
Median age by race in Fair Oaks
32.5 Median age for White residents32.0 33.4 37.7 Median age for Black or African American residents38.3 37.5 -1,068,627,449.9 Median age for American Indian / Alaska Native residents-402,222,221.8 -687,861,271.0 41.0 Median age for Asian residents40.5 41.6 20.0 Median age for Native Hawaiian / Pacific Islander residents-541,531,822.5 -714,150,046.8 28.8 Median age for Other race residents30.3 18.9 31.7 Median age for Two or more races residents33.2 26.0 32.3 Median age for White alone residents31.7 33.3 32.9 Median age for Hispanic or Latino residents37.9 28.8
Owner/renter occupied households by race in Fair Oaks
House owners and renters - White residents 3,581 41.8% Owner occupied4,976 58.2% Renter occupiedHouse owners and renters - Black or African American residents 367 22.2% Owner occupied1,282 77.8% Renter occupiedHouse owners and renters - American Indian / Alaska Native residents 38 100.0% Owner occupiedHouse owners and renters - Asian residents 2,578 65.4% Owner occupied1,367 34.6% Renter occupiedHouse owners and renters - Native Hawaiian / Pacific Islander residents 16 46.2% Owner occupied18 53.8% Renter occupiedHouse owners and renters - Other race residents 79 28.3% Owner occupied200 71.7% Renter occupiedHouse owners and renters - Two or more races residents 568 39.8% Owner occupied857 60.2% Renter occupiedHouse owners and renters - White alone residents 3,498 42.5% Owner occupied4,731 57.5% Renter occupiedHouse owners and renters - Hispanic or Latino residents 586 40.6% Owner occupied858 59.4% Renter occupied
Language usage in Fair Oaks
English speakers - Total 58.6% of residents of Fair Oaks speak English at home.
8.4% of residents speak Spanish at home 2,401 85.9% Speak English very well394 14.1% Speak English less than very well32.7% of residents speak other language at home 7,914 72.6% Speak English very well2,980 27.4% Speak English less than very well
English speakers - Born in the United States 87.9% of residents of Fair Oaks speak English at home.
9.1% of residents speak Spanish at home 1,039 90.0% Speak English very well116 10.0% Speak English less than very well4.8% of residents speak other language at home 568 92.5% Speak English very well46 7.5% Speak English less than very well
English speakers - Native, born elsewhere 46.3% of residents of Fair Oaks speak English at home.
14.7% of residents speak Spanish at home 137 95.8% Speak English very well6 4.2% Speak English less than very well48.4% of residents speak other language at home 472 100.0% Speak English very well
English speakers - Foreign-born 15.8% of residents of Fair Oaks speak English at home.
10.6% of residents speak Spanish at home 966 76.6% Speak English very well295 23.4% Speak English less than very well74.6% of residents speak other language at home 6,186 69.5% Speak English very well2,717 30.5% Speak English less than very well
White (Caucasian) - Speak only English Native:
91.6% (12,443)Foreign-born:
14.3% (328)
White (Caucasian) - Speak another language Native:
6.9% (935)Foreign-born:
84.1% (1,934)
Black or African American - Speak only English Native:
89.3% (2,022)Foreign-born:
25.1% (340)
Black or African American - Speak another language Native:
12.0% (273)Foreign-born:
79.8% (1,082)
Asian - Speak only English Native:
60.3% (1,965)Foreign-born:
18.2% (1,204)
Asian - Speak another language Native:
40.3% (1,313)Foreign-born:
80.9% (5,340)
Native Hawaiian / Pacific Islander - Speak another language Native:
99.4% (31)Foreign-born:
49.7% (17)
Other race - Speak only English Native:
26.2% (91)Foreign-born:
3.0% (9)
Other race - Speak another language Native:
62.2% (215)Foreign-born:
100.0% (304)
Two or more races - Speak only English Native:
70.9% (1,790)Foreign-born:
15.5% (164)
Two or more races - Speak another language Native:
28.2% (711)Foreign-born:
84.4% (895)
White alone - Speak only English Native:
94.3% (12,048)Foreign-born:
13.5% (324)
White alone - Speak another language Native:
4.8% (615)Foreign-born:
86.1% (2,068)
Hispanic or Latino - Speak only English Native:
49.8% (1,158)Foreign-born:
9.6% (121)
Hispanic or Latino - Speak another language Native:
48.4% (1,126)Foreign-born:
91.4% (1,152)
Foreign-born residents in Fair Oaks
Marital status for residents in Fair Oaks Marital status - White (Caucasian) population 15 years and over
Males 46.1% Never married46.1% Now married1.0% Separated0.6% Widowed6.2% DivorcedFemales 41.2% Never married38.4% Now married1.1% Separated6.0% Widowed13.3% DivorcedWomen who gave birth in the past 12 months Now married:
100.0% (355)Unmarried:
0.0% (0)
Women who did not give birth in the past 12 months Now married:
36.9% (1,748)Unmarried:
63.1% (2,988)
Marital status - Black or African American population 15 years and over
Males 40.1% Never married46.6% Now married0.0% Separated0.0% Widowed13.3% DivorcedFemales 49.7% Never married37.3% Now married0.0% Separated0.9% Widowed12.1% DivorcedWomen who did not give birth in the past 12 months Now married:
31.8% (394)Unmarried:
68.2% (845)
Marital status - American Indian / Alaska Native population 15 years and over
Males 0.0% Never married100.0% Now married0.0% Separated0.0% Widowed0.0% DivorcedFemales 0.0% Never married100.0% Now married0.0% Separated0.0% Widowed0.0% DivorcedWomen who did not give birth in the past 12 months Now married:
100.0% (17)Unmarried:
0.0% (0)
Marital status - Asian population 15 years and over
Males 36.2% Never married62.1% Now married0.0% Separated0.0% Widowed1.7% DivorcedFemales 30.8% Never married58.6% Now married1.1% Separated4.5% Widowed5.0% DivorcedWomen who gave birth in the past 12 months Now married:
100.0% (112)Unmarried:
0.0% (0)
Women who did not give birth in the past 12 months Now married:
54.1% (1,662)Unmarried:
45.9% (1,412)
Marital status - Native Hawaiian / Pacific Islander population 15 years and over
Males 0.0% Never married100.0% Now married0.0% Separated0.0% Widowed0.0% DivorcedFemales 64.0% Never married36.0% Now married0.0% Separated0.0% Widowed0.0% DivorcedWomen who did not give birth in the past 12 months Now married:
0.0% (0)Unmarried:
100.0% (17)
Marital status - Other race population 15 years and over
Males 29.4% Never married61.0% Now married9.5% Separated0.0% Widowed0.0% DivorcedFemales 9.8% Never married83.8% Now married0.0% Separated6.4% Widowed0.0% DivorcedWomen who gave birth in the past 12 months Now married:
100.0% (95)Unmarried:
0.0% (0)
Women who did not give birth in the past 12 months Now married:
68.1% (62)Unmarried:
31.9% (29)
Marital status - Two or more races population 15 years and over
Males 46.4% Never married48.0% Now married3.6% Separated0.0% Widowed2.0% DivorcedFemales 48.1% Never married36.5% Now married0.0% Separated3.5% Widowed11.9% DivorcedWomen who gave birth in the past 12 months Now married:
44.4% (16)Unmarried:
55.6% (20)
Women who did not give birth in the past 12 months Now married:
27.7% (322)Unmarried:
72.3% (838)
Marital status - White alone, not Hispanic / Latino population 15 years and over
Males 45.7% Never married46.6% Now married1.0% Separated0.7% Widowed6.0% DivorcedFemales 41.5% Never married39.6% Now married0.4% Separated5.6% Widowed12.9% DivorcedWomen who gave birth in the past 12 months Now married:
100.0% (362)Unmarried:
0.0% (0)
Women who did not give birth in the past 12 months Now married:
36.9% (1,683)Unmarried:
63.1% (2,882)
Marital status - Hispanic or Latino population 15 years and over
Males 38.2% Never married53.3% Now married4.3% Separated0.0% Widowed4.2% DivorcedFemales 31.4% Never married44.4% Now married5.9% Separated6.3% Widowed12.0% DivorcedWomen who gave birth in the past 12 months Now married:
83.3% (75)Unmarried:
16.7% (15)
Women who did not give birth in the past 12 months Now married:
42.4% (401)Unmarried:
57.6% (544)
Ancestries in Fair Oaks
829 4.2% Irish680 3.4% German555 2.8% Italian524 2.6% American515 2.6% European472 2.4% Turkish422 2.1% Ethiopian395 2.0% Iranian378 1.9% African366 1.8% English150 0.8% Palestinian144 0.7% Kenyan139 0.7% Russian125 0.6% Eastern European113 0.6% South African99 0.5% Iraqi96 0.5% Greek96 0.5% Ukrainian94 0.5% Polish90 0.5% Scottish85 0.4% Portuguese83 0.4% Egyptian79 0.4% Swedish76 0.4% Scotch-Irish71 0.4% Afghan62 0.3% Sudanese59 0.3% Armenian59 0.3% Haitian54 0.3% Lebanese54 0.3% Arab42 0.2% Finnish38 0.2% French34 0.2% Austrian33 0.2% Canadian32 0.2% Ghanaian31 0.2% Dutch30 0.2% Syrian29 0.1% Lithuanian25 0.1% Sierra Leonean20 0.1% Croatian18 0.09% Belgian17 0.09% Hungarian17 0.09% Scandinavian16 0.08% Pennsylvania German15 0.08% Welsh13 0.07% Jordanian13 0.07% Bulgarian12 0.06% Romanian12 0.06% Brazilian11 0.06% Swiss9 0.05% French Canadian9 0.05% Yugoslavian8 0.04% Czech4 0.02% Latvian4 0.02% Danish4 0.02% British West Indian
Geographical mobility in Fair Oaks Same house 1 year ago 12,835 74.9% White (Caucasian)2,835 78.3% Black or African American53 96.1% American Indian / Alaska Native7,705 77.7% Asian53 95.3% Native Hawaiian / Pacific Islander680 76.0% Other race3,185 84.3% Two or more races12,338 76.3% White alone, not Hispanic / Latino2,685 70.1% Hispanic or LatinoMoved within same county 1,765 10.3% White / Caucasian408 11.3% Black or African American1,367 13.8% Asian63 7.1% Other race454 12.0% Two or more races1,414 8.7% White alone, not Hispanic / Latino759 19.8% Hispanic or LatinoMoved within same state 1,064 6.2% White / Caucasian148 4.1% Black or African American220 2.2% Asian27 3.0% Other race153 4.0% Two or more races936 5.8% White alone, not Hispanic / Latino246 6.4% Hispanic or LatinoMoved from different state 580 3.4% White / Caucasian262 7.2% Black or African American331 3.3% Asian40 4.5% Other race84 2.2% Two or more races607 3.8% White alone, not Hispanic / Latino48 1.2% Hispanic or LatinoMoved from abroad 440 2.6% White43 1.2% Black or African American174 1.8% Asian71 7.9% Other race35 0.9% Two or more races336 2.1% White alone, not Hispanic / Latino161 4.2% Hispanic or Latino
Children Nativity (place of birth) in Fair Oaks
Children under 6 years - Living with two parents Both parents native 1,007 100.0% NativeBoth parents foreign-born 670 92.1% Native57 7.9% Foreign-bornOne native, one foreign-born parent 140 100.0% NativeChildren under 6 years - Living with one parent Native parent 251 100.0% NativeForeign-born parent 79 98.7% Native1 1.3% Foreign-bornChildren 6 to 17 years - Living with two parents Both parents native 1,201 100.0% NativeBoth parents foreign-born 1,960 90.6% Native202 9.4% Foreign-bornOne native, one foreign-born parent 294 100.0% NativeChildren 6 to 17 years - Living with one parent Native parent 339 100.0% NativeForeign-born parent 321 53.3% Native281 46.7% Foreign-born
Place of birth for residents in Fair Oaks 8,761 Asia4,348 Eastern Asia1,976 South Central Asia1,630 China1,492 Western Asia1,430 Africa1,425 Americas1,351 Latin America943 South Eastern Asia903 South America791 Eastern Africa776 Europe418 Eastern Europe412 Central America188 Western Africa187 Northern Africa166 Northern Europe120 Southern Europe77 Southern Africa74 Northern America70 Western Europe35 Caribbean13 Middle Africa2,486 Korea1,422 China1,284 India620 Saudi Arabia580 Ethiopia434 Philippines403 Turkey307 Iran272 Vietnam267 Pakistan223 Venezuela204 Bolivia200 Iraq177 Mexico170 Russia167 Taiwan164 Ghana156 Peru144 Colombia130 Japan125 Kenya107 El Salvador93 Syria92 Egypt84 Laos79 Ukraine77 South Africa74 Canada73 United Kingdom62 Ecuador61 Algeria60 Malaysia58 Brazil58 Panama54 Cambodia50 Germany48 England46 Italy43 Honduras41 Kuwait40 Hong Kong38 Bangladesh36 Croatia35 Haiti34 Eritrea34 Greece33 Sudan33 United Arab Emirates30 Afghanistan27 Azerbaijan25 Guatemala24 Israel24 Chile22 Albania22 Indonesia21 Jordan20 Ireland20 France20 Portugal19 Czechoslovakia19 Spain17 Lebanon15 Uzbekistan14 Thailand14 Bulgaria13 Bosnia and Herzegovina13 Cameroon12 Moldova11 Senegal11 Poland10 Romania9 Sri Lanka8 Hungary5 Denmark
Grandparents responsible for own grandchildren in Fair Oaks
Grandparents (30 to 59 years) Asian 11 7.7% Responsible for grandchildren133 92.3% Not responsible for grandchildren
Grandparents (60 years and over)