Races in Evanston, Wyoming (WY) Detailed Stats
Data:
Races - White alone (%)
Races - White alone (% change since 2000)
Races - Black alone (%)
Races - Black alone (% change since 2000)
Races - American Indian alone (%)
Races - American Indian alone (% change since 2000)
Races - Asian alone (%)
Races - Asian alone (% change since 2000)
Races - Hispanic (%)
Races - Hispanic (% change since 2000)
Races - Native Hawaiian and Other Pacific Islander alone (%)
Races - Native Hawaiian and Other Pacific Islander alone (% change since 2000)
Races - Two or more races(%)
Races - Two or more races(% change since 2000)
Races - Other race alone (%)
Races - Other race alone (% change since 2000)
Racial diversity
Place of birth - Born in state of residence (%)
Place of birth - Born in state of residence (%) - White
Place of birth - Born in state of residence (%) - Black or African American
Place of birth - Born in state of residence (%) - Asian
Place of birth - Born in state of residence (%) - Hispanic or Latino
Place of birth - Born in state of residence (%) - American Indian and Alaska Native
Place of birth - Born in state of residence (%) - Multirace
Place of birth - Born in state of residence (%) - Other Race
Place of birth - Born in other state (%)
Place of birth - Born in other state (%) - White
Place of birth - Born in other state (%) - Black or African American
Place of birth - Born in other state (%) - Asian
Place of birth - Born in other state (%) - Hispanic or Latino
Place of birth - Born in other state (%) - American Indian and Alaska Native
Place of birth - Born in other state (%) - Multirace
Place of birth - Born in other state (%) - Other Race
Place of birth - Native, outside of US (%)
Place of birth - Native, outside of US (%) - White
Place of birth - Native, outside of US (%) - Black or African American
Place of birth - Native, outside of US (%) - Asian
Place of birth - Native, outside of US (%) - Hispanic or Latino
Place of birth - Native, outside of US (%) - American Indian and Alaska Native
Place of birth - Native, outside of US (%) - Multirace
Place of birth - Native, outside of US (%) - Other Race
Place of birth - Foreign born (%)
Place of birth - Foreign born (%) - White
Place of birth - Foreign born (%) - Black or African American
Place of birth - Foreign born (%) - Asian
Place of birth - Foreign born (%) - Hispanic or Latino
Place of birth - Foreign born (%) - American Indian and Alaska Native
Place of birth - Foreign born (%) - Multirace
Place of birth - Foreign born (%) - Other Race
Residents speaking English at home (%)
Residents speaking English at home - Born in the United States (%)
Residents speaking English at home - Native, born elsewhere (%)
Residents speaking English at home - Foreign born (%)
Residents speaking Spanish at home (%)
Residents speaking Spanish at home - Born in the United States (%)
Residents speaking Spanish at home - Native, born elsewhere (%)
Residents speaking Spanish at home - Foreign born (%)
Residents speaking other language at home (%)
Residents speaking other language at home - Born in the United States (%)
Residents speaking other language at home - Native, born elsewhere (%)
Residents speaking other language at home - Foreign born (%)
Marital status - Never married (%)
Marital status - Now married (%)
Marital status - Separated (%)
Marital status - Widowed (%)
Marital status - Divorced (%)
Ancestries Reported - Arab (%)
Ancestries Reported - Czech (%)
Ancestries Reported - Danish (%)
Ancestries Reported - Dutch (%)
Ancestries Reported - English (%)
Ancestries Reported - French (%)
Ancestries Reported - French Canadian (%)
Ancestries Reported - German (%)
Ancestries Reported - Greek (%)
Ancestries Reported - Hungarian (%)
Ancestries Reported - Irish (%)
Ancestries Reported - Italian (%)
Ancestries Reported - Lithuanian (%)
Ancestries Reported - Norwegian (%)
Ancestries Reported - Polish (%)
Ancestries Reported - Portuguese (%)
Ancestries Reported - Russian (%)
Ancestries Reported - Scotch-Irish (%)
Ancestries Reported - Scottish (%)
Ancestries Reported - Slovak (%)
Ancestries Reported - Subsaharan African (%)
Ancestries Reported - Swedish (%)
Ancestries Reported - Swiss (%)
Ancestries Reported - Ukrainian (%)
Ancestries Reported - United States (%)
Ancestries Reported - Welsh (%)
Ancestries Reported - West Indian (%)
Ancestries Reported - Other (%)
Geographical mobility - Same house 1 year ago (%)
Geographical mobility - Same house 1 year ago (%) - White
Geographical mobility - Same house 1 year ago (%) - Black or African American
Geographical mobility - Same house 1 year ago (%) - Asian
Geographical mobility - Same house 1 year ago (%) - Hispanic or Latino
Geographical mobility - Same house 1 year ago (%) - American Indian and Alaska Native
Geographical mobility - Same house 1 year ago (%) - Multirace
Geographical mobility - Same house 1 year ago (%) - Other Race
Geographical mobility - Moved within same county (%)
Geographical mobility - Moved within same county (%) - White
Geographical mobility - Moved within same county (%) - Black or African American
Geographical mobility - Moved within same county (%) - Asian
Geographical mobility - Moved within same county (%) - Hispanic or Latino
Geographical mobility - Moved within same county (%) - American Indian and Alaska Native
Geographical mobility - Moved within same county (%) - Multirace
Geographical mobility - Moved within same county (%) - Other Race
Geographical mobility - Moved from different county within same state (%)
Geographical mobility - Moved from different county within same state (%) - White
Geographical mobility - Moved from different county within same state (%) - Black or African American
Geographical mobility - Moved from different county within same state (%) - Asian
Geographical mobility - Moved from different county within same state (%) - Hispanic or Latino
Geographical mobility - Moved from different county within same state (%) - American Indian and Alaska Native
Geographical mobility - Moved from different county within same state (%) - Multirace
Geographical mobility - Moved from different county within same state (%) - Other Race
Geographical mobility - Moved from different state (%)
Geographical mobility - Moved from different state (%) - White
Geographical mobility - Moved from different state (%) - Black or African American
Geographical mobility - Moved from different state (%) - Asian
Geographical mobility - Moved from different state (%) - Hispanic or Latino
Geographical mobility - Moved from different state (%) - American Indian and Alaska Native
Geographical mobility - Moved from different state (%) - Multirace
Geographical mobility - Moved from different state (%) - Other Race
Geographical mobility - Moved from abroad (%)
Geographical mobility - Moved from abroad (%) - White
Geographical mobility - Moved from abroad (%) - Black or African American
Geographical mobility - Moved from abroad (%) - Asian
Geographical mobility - Moved from abroad (%) - Hispanic or Latino
Geographical mobility - Moved from abroad (%) - American Indian and Alaska Native
Geographical mobility - Moved from abroad (%) - Multirace
Geographical mobility - Moved from abroad (%) - Other Race
Place of birth for the foreign-born population - Ireland (%)
Place of birth for the foreign-born population - Denmark (%)
Place of birth for the foreign-born population - Norway (%)
Place of birth for the foreign-born population - Sweden (%)
Place of birth for the foreign-born population - United Kingdom (%)
Place of birth for the foreign-born population - England (%)
Place of birth for the foreign-born population - Scotland (%)
Place of birth for the foreign-born population - Other Northern Europe (%)
Place of birth for the foreign-born population - Austria (%)
Place of birth for the foreign-born population - Belgium (%)
Place of birth for the foreign-born population - France (%)
Place of birth for the foreign-born population - Germany (%)
Place of birth for the foreign-born population - Netherlands (%)
Place of birth for the foreign-born population - Switzerland (%)
Place of birth for the foreign-born population - Other Western Europe (%)
Place of birth for the foreign-born population - Greece (%)
Place of birth for the foreign-born population - Italy (%)
Place of birth for the foreign-born population - Portugal (%)
Place of birth for the foreign-born population - Spain (%)
Place of birth for the foreign-born population - Other Southern Europe (%)
Place of birth for the foreign-born population - Albania (%)
Place of birth for the foreign-born population - Belarus (%)
Place of birth for the foreign-born population - Bosnia and Herzegovina (%)
Place of birth for the foreign-born population - Bulgaria (%)
Place of birth for the foreign-born population - Croatia (%)
Place of birth for the foreign-born population - Czechoslovakia (%)
Place of birth for the foreign-born population - Hungary (%)
Place of birth for the foreign-born population - Latvia (%)
Place of birth for the foreign-born population - Lithuania (%)
Place of birth for the foreign-born population - North Macedonia (Macedonia) (%)
Place of birth for the foreign-born population - Moldova (%)
Place of birth for the foreign-born population - Poland (%)
Place of birth for the foreign-born population - Romania (%)
Place of birth for the foreign-born population - Russia (%)
Place of birth for the foreign-born population - Serbia (%)
Place of birth for the foreign-born population - Ukraine (%)
Place of birth for the foreign-born population - Other Eastern Europe (%)
Place of birth for the foreign-born population - China (%)
Place of birth for the foreign-born population - Hong Kong (%)
Place of birth for the foreign-born population - Taiwan (%)
Place of birth for the foreign-born population - Japan (%)
Place of birth for the foreign-born population - Korea (%)
Place of birth for the foreign-born population - Other Eastern Asia (%)
Place of birth for the foreign-born population - Afghanistan (%)
Place of birth for the foreign-born population - Bangladesh (%)
Place of birth for the foreign-born population - India (%)
Place of birth for the foreign-born population - Iran (%)
Place of birth for the foreign-born population - Kazakhstan (%)
Place of birth for the foreign-born population - Nepal (%)
Place of birth for the foreign-born population - Pakistan (%)
Place of birth for the foreign-born population - Sri Lanka (%)
Place of birth for the foreign-born population - Uzbekistan (%)
Place of birth for the foreign-born population - Other South Central Asia (%)
Place of birth for the foreign-born population - Burma (%)
Place of birth for the foreign-born population - Cambodia (%)
Place of birth for the foreign-born population - Indonesia (%)
Place of birth for the foreign-born population - Laos (%)
Place of birth for the foreign-born population - Malaysia (%)
Place of birth for the foreign-born population - Philippines (%)
Place of birth for the foreign-born population - Singapore (%)
Place of birth for the foreign-born population - Thailand (%)
Place of birth for the foreign-born population - Vietnam (%)
Place of birth for the foreign-born population - Other South Eastern Asia (%)
Place of birth for the foreign-born population - Armenia (%)
Place of birth for the foreign-born population - Iraq (%)
Place of birth for the foreign-born population - Israel (%)
Place of birth for the foreign-born population - Jordan (%)
Place of birth for the foreign-born population - Kuwait (%)
Place of birth for the foreign-born population - Lebanon (%)
Place of birth for the foreign-born population - Saudi Arabia (%)
Place of birth for the foreign-born population - Syria (%)
Place of birth for the foreign-born population - Turkey (%)
Place of birth for the foreign-born population - Yemen (%)
Place of birth for the foreign-born population - Other Western Asia (%)
Place of birth for the foreign-born population - Eritrea (%)
Place of birth for the foreign-born population - Ethiopia (%)
Place of birth for the foreign-born population - Kenya (%)
Place of birth for the foreign-born population - Somalia (%)
Place of birth for the foreign-born population - Uganda (%)
Place of birth for the foreign-born population - Zimbabwe (%)
Place of birth for the foreign-born population - Other Eastern Africa (%)
Place of birth for the foreign-born population - Cameroon (%)
Place of birth for the foreign-born population - Congo (%)
Place of birth for the foreign-born population - Democratic Republic of Congo (Zaire) (%)
Place of birth for the foreign-born population - Other Middle Africa (%)
Place of birth for the foreign-born population - Egypt (%)
Place of birth for the foreign-born population - Morocco (%)
Place of birth for the foreign-born population - Sudan (%)
Place of birth for the foreign-born population - Other Northern Africa (%)
Place of birth for the foreign-born population - South Africa (%)
Place of birth for the foreign-born population - Other Southern Africa (%)
Place of birth for the foreign-born population - Cabo Verde (%)
Place of birth for the foreign-born population - Ghana (%)
Place of birth for the foreign-born population - Liberia (%)
Place of birth for the foreign-born population - Nigeria (%)
Place of birth for the foreign-born population - Senegal (%)
Place of birth for the foreign-born population - Sierra Leone (%)
Place of birth for the foreign-born population - Other Western Africa (%)
Place of birth for the foreign-born population - Australia (%)
Place of birth for the foreign-born population - New Zealand (%)
Place of birth for the foreign-born population - Fiji (%)
Place of birth for the foreign-born population - Micronesia (%)
Place of birth for the foreign-born population - Bahamas (%)
Place of birth for the foreign-born population - Barbados (%)
Place of birth for the foreign-born population - Cuba (%)
Place of birth for the foreign-born population - Dominica (%)
Place of birth for the foreign-born population - Dominican Republic (%)
Place of birth for the foreign-born population - Grenada (%)
Place of birth for the foreign-born population - Haiti (%)
Place of birth for the foreign-born population - Jamaica (%)
Place of birth for the foreign-born population - St. Vincent and the Grenadines (%)
Place of birth for the foreign-born population - Trinidad and Tobago (%)
Place of birth for the foreign-born population - West Indies (%)
Place of birth for the foreign-born population - Other Caribbean (%)
Place of birth for the foreign-born population - Belize (%)
Place of birth for the foreign-born population - Costa Rica (%)
Place of birth for the foreign-born population - El Salvador (%)
Place of birth for the foreign-born population - Guatemala (%)
Place of birth for the foreign-born population - Honduras (%)
Place of birth for the foreign-born population - Mexico (%)
Place of birth for the foreign-born population - Nicaragua (%)
Place of birth for the foreign-born population - Panama (%)
Place of birth for the foreign-born population - Other Central America (%)
Place of birth for the foreign-born population - Argentina (%)
Place of birth for the foreign-born population - Bolivia (%)
Place of birth for the foreign-born population - Brazil (%)
Place of birth for the foreign-born population - Chile (%)
Place of birth for the foreign-born population - Colombia (%)
Place of birth for the foreign-born population - Ecuador (%)
Place of birth for the foreign-born population - Guyana (%)
Place of birth for the foreign-born population - Peru (%)
Place of birth for the foreign-born population - Uruguay (%)
Place of birth for the foreign-born population - Venezuela (%)
Place of birth for the foreign-born population - Other South America (%)
Place of birth for the foreign-born population - Canada (%)
Place of birth for the foreign-born population - Other Northern America (%)
Place of birth for the foreign-born population - Other (%)
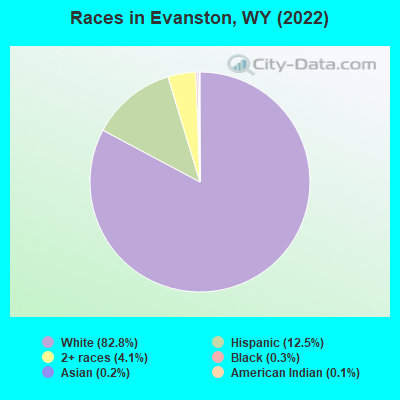
According to 2022 data, the most numerous races in Evanston, WY are White alone (9,829 residents), Hispanic (1,481 residents), and Two or more races (490 residents). 95.4% of Evanston residents speak English at home. 2.7% of Evanston, WY residents are foreign-born (2.1% born in Latin America, 0.5% born in Europe), which is 12.0% less than the foreign-born rate of 3.0% across the entire state of Wyoming.
Race distribution in Evanston
2000 2022
438,799 88.9% White alone 31,669 6.4% Hispanic 10,238 2.1% American Indian alone 6,164 1.2% Two or more races 3,504 0.7% Black alone 2,670 0.5% Asian alone 474 0.10% Other race alone 264 0.05% Native Hawaiian and Other
473,220 81.4% White alone 62,803 10.8% Hispanic 22,911 3.9% Two or more races 9,589 1.6% American Indian alone 4,997 0.9% Other race alone 3,990 0.7% Black alone 3,577 0.6% Asian alone 294 0.05% Native Hawaiian and Other
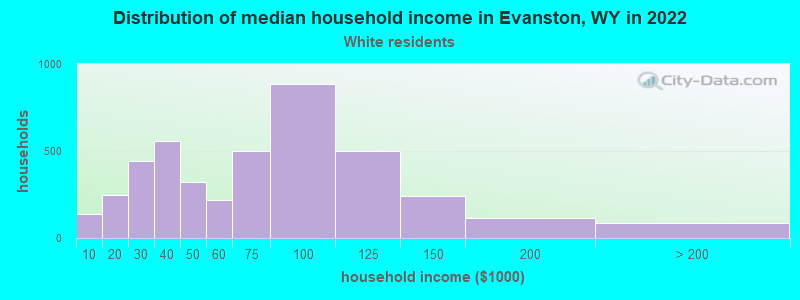
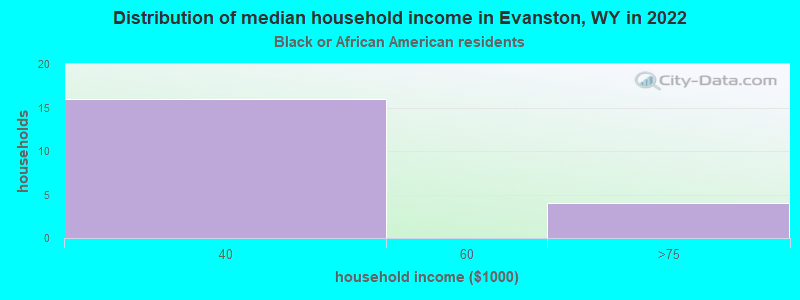
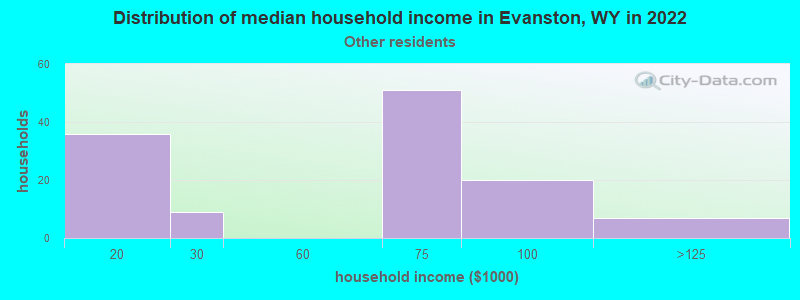
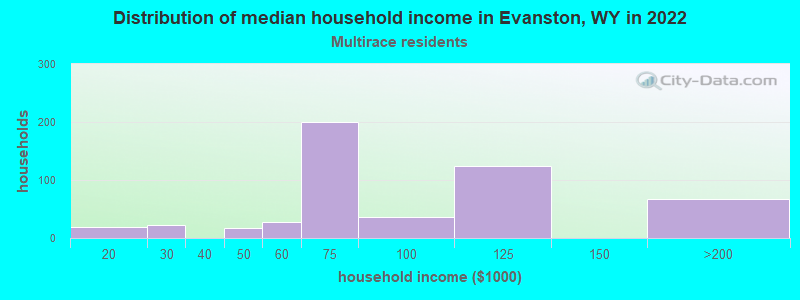
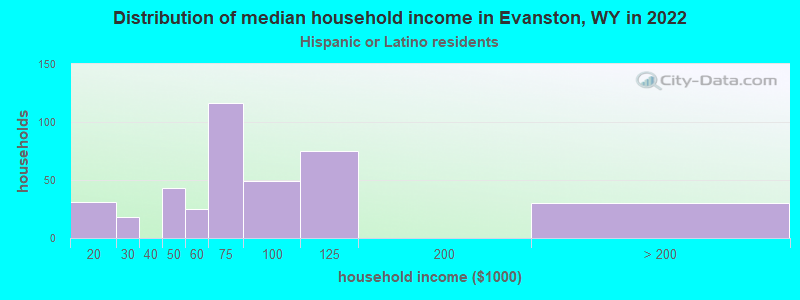
Income and house value in Evanston Median household income in 2022 $67,373 White non-Hispanic householders$61,408 Some other race householders$74,261 Two or more races householders$82,291 Hispanic or Latino race householdersMedian 2022 house value $228,957 White Non-Hispanic householders$250,875 Some other race householders$201,756 Two or more races householders$215,753 Hispanic or Latino householders
Median age by race in Evanston
36.2 Median age for White residents36.3 36.0 36.3 Median age for Black or African American residents-558,558,558.0 13.5 88.8 Median age for American Indian / Alaska Native residents104.3 -642,934,195.7 -802,845,527.7 Median age for Asian residents-684,684,684.0 -929,503,915.5 -594,708,994.1 Median age for Native Hawaiian / Pacific Islander residents-652,729,383.8 -865,828,091.4 24.1 Median age for Other race residents33.3 20.5 45.9 Median age for Two or more races residents42.7 53.8 36.9 Median age for White alone residents36.3 37.6 30.0 Median age for Hispanic or Latino residents33.4 26.1
Owner/renter occupied households by race in Evanston
House owners and renters - White residents 3,043 72.6% Owner occupied1,147 27.4% Renter occupiedHouse owners and renters - Black or African American residents 19 100.0% Renter occupiedHouse owners and renters - American Indian / Alaska Native residents 16 100.0% Owner occupiedHouse owners and renters - Other race residents 131 81.5% Owner occupied30 18.5% Renter occupiedHouse owners and renters - Two or more races residents 439 87.0% Owner occupied66 13.0% Renter occupiedHouse owners and renters - White alone residents 2,988 72.6% Owner occupied1,125 27.4% Renter occupiedHouse owners and renters - Hispanic or Latino residents 301 79.4% Owner occupied78 20.6% Renter occupied
Language usage in Evanston
English speakers - Total 95.4% of residents of Evanston speak English at home.
4.4% of residents speak Spanish at home 284 58.1% Speak English very well205 41.9% Speak English less than very well0.6% of residents speak other language at home 62 100.0% Speak English very well
English speakers - Born in the United States 97.3% of residents of Evanston speak English at home.
2.7% of residents speak Spanish at home 177 100.0% Speak English very well0.3% of residents speak other language at home 19 100.0% Speak English very well
All residents speak only English at home
English speakers - Foreign-born 28.8% of residents of Evanston speak English at home.
60.1% of residents speak Spanish at home 18 10.7% Speak English very well151 89.3% Speak English less than very well14.2% of residents speak other language at home 40 100.0% Speak English very well
White (Caucasian) - Speak only English Native:
99.8% (9,565)Foreign-born:
12.8% (10)
White (Caucasian) - Speak another language Native:
0.8% (74)Foreign-born:
78.4% (62)
Black or African American - Speak another language Native:
53.9% (20)Foreign-born:
100.0% (4)
Other race - Speak only English Native:
56.0% (222)Foreign-born:
56.7% (76)
Other race - Speak another language Native:
42.5% (169)Foreign-born:
30.1% (41)
Two or more races - Speak another language Native:
5.8% (52)Foreign-born:
100.0% (79)
White alone - Speak only English Native:
99.9% (9,268)Foreign-born:
23.8% (11)
White alone - Speak another language Native:
0.4% (42)Foreign-born:
77.8% (38)
Hispanic or Latino - Speak only English Native:
74.6% (832)Foreign-born:
38.8% (89)
Hispanic or Latino - Speak another language Native:
25.3% (283)Foreign-born:
71.7% (164)
Foreign-born residents in Evanston 318 residents are foreign born (2.1% Latin America , 0.5% Europe ).
This city:
2.7%Wyoming:
3.4%
Marital status for residents in Evanston Marital status - White (Caucasian) population 15 years and over
Males 28.9% Never married53.9% Now married1.2% Separated2.3% Widowed13.7% DivorcedFemales 20.5% Never married50.2% Now married1.4% Separated6.6% Widowed21.3% DivorcedWomen who gave birth in the past 12 months Now married:
66.0% (66)Unmarried:
34.0% (34)
Women who did not give birth in the past 12 months Now married:
53.0% (1,175)Unmarried:
47.0% (1,044)
Marital status - Black or African American population 15 years and over
Males 5.9% Never married0.0% Now married0.0% Separated0.0% Widowed94.1% DivorcedFemales 0.0% Never married0.0% Now married100.0% Separated0.0% Widowed0.0% DivorcedMarital status - Other race population 15 years and over
Males 30.2% Never married69.8% Now married0.0% Separated0.0% Widowed0.0% DivorcedFemales 54.4% Never married30.2% Now married0.0% Separated5.4% Widowed10.1% DivorcedWomen who gave birth in the past 12 months Now married:
100.0% (26)Unmarried:
0.0% (0)
Women who did not give birth in the past 12 months Now married:
22.1% (27)Unmarried:
77.9% (97)
Marital status - Two or more races population 15 years and over
Males 34.9% Never married39.0% Now married0.0% Separated0.0% Widowed26.1% DivorcedFemales 12.8% Never married47.9% Now married0.0% Separated0.0% Widowed39.3% DivorcedWomen who did not give birth in the past 12 months Now married:
69.0% (222)Unmarried:
31.0% (100)
Marital status - White alone, not Hispanic / Latino population 15 years and over
Males 29.3% Never married54.0% Now married0.9% Separated1.9% Widowed14.0% DivorcedFemales 21.0% Never married49.9% Now married1.2% Separated6.7% Widowed21.2% DivorcedWomen who gave birth in the past 12 months Now married:
58.8% (49)Unmarried:
41.2% (34)
Women who did not give birth in the past 12 months Now married:
52.3% (1,102)Unmarried:
47.7% (1,006)
Marital status - Hispanic or Latino population 15 years and over
Males 33.1% Never married43.2% Now married3.7% Separated11.3% Widowed8.8% DivorcedFemales 24.3% Never married37.1% Now married2.2% Separated3.2% Widowed33.2% DivorcedWomen who gave birth in the past 12 months Now married:
100.0% (40)Unmarried:
0.0% (0)
Women who did not give birth in the past 12 months Now married:
45.3% (148)Unmarried:
54.7% (179)
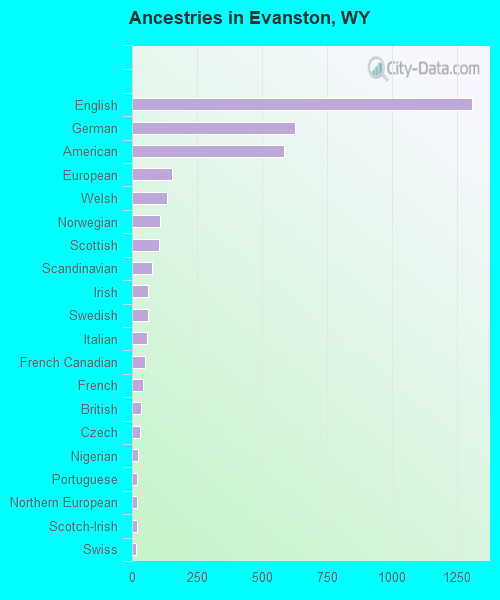
Ancestries in Evanston
1,309 28.7% English626 13.7% German587 12.8% American155 3.4% European134 2.9% Welsh107 2.3% Norwegian103 2.3% Scottish76 1.7% Scandinavian62 1.4% Irish62 1.4% Swedish57 1.2% Italian50 1.1% French Canadian44 1.0% French36 0.8% British31 0.7% Czech23 0.5% Nigerian20 0.4% Portuguese18 0.4% Northern European18 0.4% Scotch-Irish14 0.3% Swiss11 0.2% Austrian7 0.2% Dutch4 0.09% Basque4 0.09% Polish
Geographical mobility in Evanston Same house 1 year ago 8,325 81.9% White (Caucasian)38 99.7% American Indian / Alaska Native33 99.8% Asian567 100.0% Other race953 90.1% Two or more races7,901 80.8% White alone, not Hispanic / Latino1,442 96.6% Hispanic or LatinoMoved within same county 1,042 10.3% White / Caucasian1 0.2% Other race81 7.6% Two or more races1,082 11.1% White alone, not Hispanic / Latino53 3.5% Hispanic or LatinoMoved within same state 163 1.6% White / Caucasian1 2.5% American Indian / Alaska Native169 1.7% White alone, not Hispanic / Latino3 0.2% Hispanic or LatinoMoved from different state 583 5.7% White / Caucasian56 100.0% Black or African American40 3.8% Two or more races568 5.8% White alone, not Hispanic / Latino39 2.6% Hispanic or LatinoMoved from abroad 13 0.1% White15 0.1% White alone, not Hispanic / Latino
Children Nativity (place of birth) in Evanston
Children under 6 years - Living with two parents Both parents native 710 100.0% NativeBoth parents foreign-born 3 100.0% NativeOne native, one foreign-born parent 2 100.0% NativeChildren under 6 years - Living with one parent Native parent 167 100.0% NativeForeign-born parent 48 100.0% NativeChildren 6 to 17 years - Living with two parents Both parents native 1,274 100.0% NativeBoth parents foreign-born 92 100.0% NativeOne native, one foreign-born parent 6 100.0% NativeChildren 6 to 17 years - Living with one parent Native parent 365 100.0% NativeForeign-born parent 112 53.5% Native97 46.5% Foreign-born
Place of birth for residents in Evanston 250 Americas250 Latin America250 Central America63 Europe63 Western Europe4 Africa4 Western Africa
Grandparents responsible for own grandchildren in Evanston
Grandparents (30 to 59 years) White / Caucasian 15 100.0% Not responsible for grandchildrenWhite alone, not Hispanic / Latino 16 100.0% Not responsible for grandchildren
Grandparents (60 years and over) White / Caucasian 78 100.0% Responsible for grandchildrenWhite alone, not Hispanic / Latino 83 100.0% Responsible for grandchildren