Races in Estero, Florida (FL) Detailed Stats
Data:
Races - White alone (%)
Races - White alone (% change since 2000)
Races - Black alone (%)
Races - Black alone (% change since 2000)
Races - American Indian alone (%)
Races - American Indian alone (% change since 2000)
Races - Asian alone (%)
Races - Asian alone (% change since 2000)
Races - Hispanic (%)
Races - Hispanic (% change since 2000)
Races - Native Hawaiian and Other Pacific Islander alone (%)
Races - Native Hawaiian and Other Pacific Islander alone (% change since 2000)
Races - Two or more races(%)
Races - Two or more races(% change since 2000)
Races - Other race alone (%)
Races - Other race alone (% change since 2000)
Racial diversity
Place of birth - Born in state of residence (%)
Place of birth - Born in state of residence (%) - White
Place of birth - Born in state of residence (%) - Black or African American
Place of birth - Born in state of residence (%) - Asian
Place of birth - Born in state of residence (%) - Hispanic or Latino
Place of birth - Born in state of residence (%) - American Indian and Alaska Native
Place of birth - Born in state of residence (%) - Multirace
Place of birth - Born in state of residence (%) - Other Race
Place of birth - Born in other state (%)
Place of birth - Born in other state (%) - White
Place of birth - Born in other state (%) - Black or African American
Place of birth - Born in other state (%) - Asian
Place of birth - Born in other state (%) - Hispanic or Latino
Place of birth - Born in other state (%) - American Indian and Alaska Native
Place of birth - Born in other state (%) - Multirace
Place of birth - Born in other state (%) - Other Race
Place of birth - Native, outside of US (%)
Place of birth - Native, outside of US (%) - White
Place of birth - Native, outside of US (%) - Black or African American
Place of birth - Native, outside of US (%) - Asian
Place of birth - Native, outside of US (%) - Hispanic or Latino
Place of birth - Native, outside of US (%) - American Indian and Alaska Native
Place of birth - Native, outside of US (%) - Multirace
Place of birth - Native, outside of US (%) - Other Race
Place of birth - Foreign born (%)
Place of birth - Foreign born (%) - White
Place of birth - Foreign born (%) - Black or African American
Place of birth - Foreign born (%) - Asian
Place of birth - Foreign born (%) - Hispanic or Latino
Place of birth - Foreign born (%) - American Indian and Alaska Native
Place of birth - Foreign born (%) - Multirace
Place of birth - Foreign born (%) - Other Race
Residents speaking English at home (%)
Residents speaking English at home - Born in the United States (%)
Residents speaking English at home - Native, born elsewhere (%)
Residents speaking English at home - Foreign born (%)
Residents speaking Spanish at home (%)
Residents speaking Spanish at home - Born in the United States (%)
Residents speaking Spanish at home - Native, born elsewhere (%)
Residents speaking Spanish at home - Foreign born (%)
Residents speaking other language at home (%)
Residents speaking other language at home - Born in the United States (%)
Residents speaking other language at home - Native, born elsewhere (%)
Residents speaking other language at home - Foreign born (%)
Marital status - Never married (%)
Marital status - Now married (%)
Marital status - Separated (%)
Marital status - Widowed (%)
Marital status - Divorced (%)
Ancestries Reported - Arab (%)
Ancestries Reported - Czech (%)
Ancestries Reported - Danish (%)
Ancestries Reported - Dutch (%)
Ancestries Reported - English (%)
Ancestries Reported - French (%)
Ancestries Reported - French Canadian (%)
Ancestries Reported - German (%)
Ancestries Reported - Greek (%)
Ancestries Reported - Hungarian (%)
Ancestries Reported - Irish (%)
Ancestries Reported - Italian (%)
Ancestries Reported - Lithuanian (%)
Ancestries Reported - Norwegian (%)
Ancestries Reported - Polish (%)
Ancestries Reported - Portuguese (%)
Ancestries Reported - Russian (%)
Ancestries Reported - Scotch-Irish (%)
Ancestries Reported - Scottish (%)
Ancestries Reported - Slovak (%)
Ancestries Reported - Subsaharan African (%)
Ancestries Reported - Swedish (%)
Ancestries Reported - Swiss (%)
Ancestries Reported - Ukrainian (%)
Ancestries Reported - United States (%)
Ancestries Reported - Welsh (%)
Ancestries Reported - West Indian (%)
Ancestries Reported - Other (%)
Geographical mobility - Same house 1 year ago (%)
Geographical mobility - Same house 1 year ago (%) - White
Geographical mobility - Same house 1 year ago (%) - Black or African American
Geographical mobility - Same house 1 year ago (%) - Asian
Geographical mobility - Same house 1 year ago (%) - Hispanic or Latino
Geographical mobility - Same house 1 year ago (%) - American Indian and Alaska Native
Geographical mobility - Same house 1 year ago (%) - Multirace
Geographical mobility - Same house 1 year ago (%) - Other Race
Geographical mobility - Moved within same county (%)
Geographical mobility - Moved within same county (%) - White
Geographical mobility - Moved within same county (%) - Black or African American
Geographical mobility - Moved within same county (%) - Asian
Geographical mobility - Moved within same county (%) - Hispanic or Latino
Geographical mobility - Moved within same county (%) - American Indian and Alaska Native
Geographical mobility - Moved within same county (%) - Multirace
Geographical mobility - Moved within same county (%) - Other Race
Geographical mobility - Moved from different county within same state (%)
Geographical mobility - Moved from different county within same state (%) - White
Geographical mobility - Moved from different county within same state (%) - Black or African American
Geographical mobility - Moved from different county within same state (%) - Asian
Geographical mobility - Moved from different county within same state (%) - Hispanic or Latino
Geographical mobility - Moved from different county within same state (%) - American Indian and Alaska Native
Geographical mobility - Moved from different county within same state (%) - Multirace
Geographical mobility - Moved from different county within same state (%) - Other Race
Geographical mobility - Moved from different state (%)
Geographical mobility - Moved from different state (%) - White
Geographical mobility - Moved from different state (%) - Black or African American
Geographical mobility - Moved from different state (%) - Asian
Geographical mobility - Moved from different state (%) - Hispanic or Latino
Geographical mobility - Moved from different state (%) - American Indian and Alaska Native
Geographical mobility - Moved from different state (%) - Multirace
Geographical mobility - Moved from different state (%) - Other Race
Geographical mobility - Moved from abroad (%)
Geographical mobility - Moved from abroad (%) - White
Geographical mobility - Moved from abroad (%) - Black or African American
Geographical mobility - Moved from abroad (%) - Asian
Geographical mobility - Moved from abroad (%) - Hispanic or Latino
Geographical mobility - Moved from abroad (%) - American Indian and Alaska Native
Geographical mobility - Moved from abroad (%) - Multirace
Geographical mobility - Moved from abroad (%) - Other Race
Place of birth for the foreign-born population - Ireland (%)
Place of birth for the foreign-born population - Denmark (%)
Place of birth for the foreign-born population - Norway (%)
Place of birth for the foreign-born population - Sweden (%)
Place of birth for the foreign-born population - United Kingdom (%)
Place of birth for the foreign-born population - England (%)
Place of birth for the foreign-born population - Scotland (%)
Place of birth for the foreign-born population - Other Northern Europe (%)
Place of birth for the foreign-born population - Austria (%)
Place of birth for the foreign-born population - Belgium (%)
Place of birth for the foreign-born population - France (%)
Place of birth for the foreign-born population - Germany (%)
Place of birth for the foreign-born population - Netherlands (%)
Place of birth for the foreign-born population - Switzerland (%)
Place of birth for the foreign-born population - Other Western Europe (%)
Place of birth for the foreign-born population - Greece (%)
Place of birth for the foreign-born population - Italy (%)
Place of birth for the foreign-born population - Portugal (%)
Place of birth for the foreign-born population - Spain (%)
Place of birth for the foreign-born population - Other Southern Europe (%)
Place of birth for the foreign-born population - Albania (%)
Place of birth for the foreign-born population - Belarus (%)
Place of birth for the foreign-born population - Bosnia and Herzegovina (%)
Place of birth for the foreign-born population - Bulgaria (%)
Place of birth for the foreign-born population - Croatia (%)
Place of birth for the foreign-born population - Czechoslovakia (%)
Place of birth for the foreign-born population - Hungary (%)
Place of birth for the foreign-born population - Latvia (%)
Place of birth for the foreign-born population - Lithuania (%)
Place of birth for the foreign-born population - North Macedonia (Macedonia) (%)
Place of birth for the foreign-born population - Moldova (%)
Place of birth for the foreign-born population - Poland (%)
Place of birth for the foreign-born population - Romania (%)
Place of birth for the foreign-born population - Russia (%)
Place of birth for the foreign-born population - Serbia (%)
Place of birth for the foreign-born population - Ukraine (%)
Place of birth for the foreign-born population - Other Eastern Europe (%)
Place of birth for the foreign-born population - China (%)
Place of birth for the foreign-born population - Hong Kong (%)
Place of birth for the foreign-born population - Taiwan (%)
Place of birth for the foreign-born population - Japan (%)
Place of birth for the foreign-born population - Korea (%)
Place of birth for the foreign-born population - Other Eastern Asia (%)
Place of birth for the foreign-born population - Afghanistan (%)
Place of birth for the foreign-born population - Bangladesh (%)
Place of birth for the foreign-born population - India (%)
Place of birth for the foreign-born population - Iran (%)
Place of birth for the foreign-born population - Kazakhstan (%)
Place of birth for the foreign-born population - Nepal (%)
Place of birth for the foreign-born population - Pakistan (%)
Place of birth for the foreign-born population - Sri Lanka (%)
Place of birth for the foreign-born population - Uzbekistan (%)
Place of birth for the foreign-born population - Other South Central Asia (%)
Place of birth for the foreign-born population - Burma (%)
Place of birth for the foreign-born population - Cambodia (%)
Place of birth for the foreign-born population - Indonesia (%)
Place of birth for the foreign-born population - Laos (%)
Place of birth for the foreign-born population - Malaysia (%)
Place of birth for the foreign-born population - Philippines (%)
Place of birth for the foreign-born population - Singapore (%)
Place of birth for the foreign-born population - Thailand (%)
Place of birth for the foreign-born population - Vietnam (%)
Place of birth for the foreign-born population - Other South Eastern Asia (%)
Place of birth for the foreign-born population - Armenia (%)
Place of birth for the foreign-born population - Iraq (%)
Place of birth for the foreign-born population - Israel (%)
Place of birth for the foreign-born population - Jordan (%)
Place of birth for the foreign-born population - Kuwait (%)
Place of birth for the foreign-born population - Lebanon (%)
Place of birth for the foreign-born population - Saudi Arabia (%)
Place of birth for the foreign-born population - Syria (%)
Place of birth for the foreign-born population - Turkey (%)
Place of birth for the foreign-born population - Yemen (%)
Place of birth for the foreign-born population - Other Western Asia (%)
Place of birth for the foreign-born population - Eritrea (%)
Place of birth for the foreign-born population - Ethiopia (%)
Place of birth for the foreign-born population - Kenya (%)
Place of birth for the foreign-born population - Somalia (%)
Place of birth for the foreign-born population - Uganda (%)
Place of birth for the foreign-born population - Zimbabwe (%)
Place of birth for the foreign-born population - Other Eastern Africa (%)
Place of birth for the foreign-born population - Cameroon (%)
Place of birth for the foreign-born population - Congo (%)
Place of birth for the foreign-born population - Democratic Republic of Congo (Zaire) (%)
Place of birth for the foreign-born population - Other Middle Africa (%)
Place of birth for the foreign-born population - Egypt (%)
Place of birth for the foreign-born population - Morocco (%)
Place of birth for the foreign-born population - Sudan (%)
Place of birth for the foreign-born population - Other Northern Africa (%)
Place of birth for the foreign-born population - South Africa (%)
Place of birth for the foreign-born population - Other Southern Africa (%)
Place of birth for the foreign-born population - Cabo Verde (%)
Place of birth for the foreign-born population - Ghana (%)
Place of birth for the foreign-born population - Liberia (%)
Place of birth for the foreign-born population - Nigeria (%)
Place of birth for the foreign-born population - Senegal (%)
Place of birth for the foreign-born population - Sierra Leone (%)
Place of birth for the foreign-born population - Other Western Africa (%)
Place of birth for the foreign-born population - Australia (%)
Place of birth for the foreign-born population - New Zealand (%)
Place of birth for the foreign-born population - Fiji (%)
Place of birth for the foreign-born population - Micronesia (%)
Place of birth for the foreign-born population - Bahamas (%)
Place of birth for the foreign-born population - Barbados (%)
Place of birth for the foreign-born population - Cuba (%)
Place of birth for the foreign-born population - Dominica (%)
Place of birth for the foreign-born population - Dominican Republic (%)
Place of birth for the foreign-born population - Grenada (%)
Place of birth for the foreign-born population - Haiti (%)
Place of birth for the foreign-born population - Jamaica (%)
Place of birth for the foreign-born population - St. Vincent and the Grenadines (%)
Place of birth for the foreign-born population - Trinidad and Tobago (%)
Place of birth for the foreign-born population - West Indies (%)
Place of birth for the foreign-born population - Other Caribbean (%)
Place of birth for the foreign-born population - Belize (%)
Place of birth for the foreign-born population - Costa Rica (%)
Place of birth for the foreign-born population - El Salvador (%)
Place of birth for the foreign-born population - Guatemala (%)
Place of birth for the foreign-born population - Honduras (%)
Place of birth for the foreign-born population - Mexico (%)
Place of birth for the foreign-born population - Nicaragua (%)
Place of birth for the foreign-born population - Panama (%)
Place of birth for the foreign-born population - Other Central America (%)
Place of birth for the foreign-born population - Argentina (%)
Place of birth for the foreign-born population - Bolivia (%)
Place of birth for the foreign-born population - Brazil (%)
Place of birth for the foreign-born population - Chile (%)
Place of birth for the foreign-born population - Colombia (%)
Place of birth for the foreign-born population - Ecuador (%)
Place of birth for the foreign-born population - Guyana (%)
Place of birth for the foreign-born population - Peru (%)
Place of birth for the foreign-born population - Uruguay (%)
Place of birth for the foreign-born population - Venezuela (%)
Place of birth for the foreign-born population - Other South America (%)
Place of birth for the foreign-born population - Canada (%)
Place of birth for the foreign-born population - Other Northern America (%)
Place of birth for the foreign-born population - Other (%)
Latest news about races in Estero, FL collected exclusively by city-data.com from local newspapers, TV, and radio stations
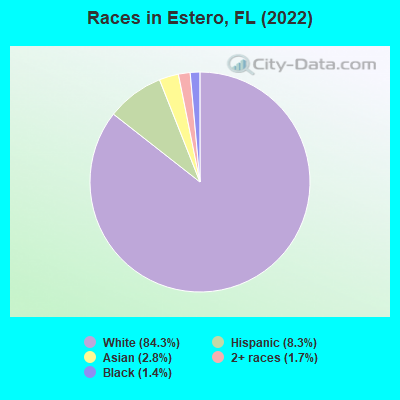
According to 2022 data, the most numerous races in Estero, FL are White alone (32,915 residents), Hispanic (3,222 residents), and Black alone (541 residents). 88.8% of Estero residents speak English at home. 10.7% of Estero, FL residents are foreign-born (3.1% born in Latin America, 2.5% born in Europe, 2.5% born in North America, 2.3% born in Asia), which is 95.5% less than the foreign-born rate of 21.0% across the entire state of Florida.
Race distribution in Estero
2000 2022
10,458,509 65.4% White alone 2,682,715 16.8% Hispanic 2,264,268 14.2% Black alone 261,693 1.6% Asian alone 236,954 1.5% Two or more races 42,358 0.3% American Indian alone 28,994 0.2% Other race alone 6,887 0.04% Native Hawaiian and Other
11,309,403 50.8% White alone 6,025,039 27.1% Hispanic 3,241,015 14.6% Black alone 861,630 3.9% Two or more races 623,692 2.8% Asian alone 152,054 0.7% Other race alone 22,504 0.1% American Indian alone 9,486 0.04% Native Hawaiian and Other
Income and house value in Estero Median household income in 2022 $101,284 White non-Hispanic householders$177,341 Black householdersover $200,000 Asian householders$74,213 Some other race householders$104,474 Two or more races householders$80,001 Hispanic or Latino race householdersMedian 2022 house value $631,660 White Non-Hispanic householders$266,436 Black or African American householdersover $1,000,000 American Indian or Alaska Native householders $666,092 Asian householders$922,281 Some other race householders$563,616 Hispanic or Latino householders
Median age by race in Estero
69.8 Median age for White residents70.9 68.8 38.6 Median age for Black or African American residents39.8 40.4 -562,189,054.2 Median age for American Indian / Alaska Native residents-558,080,807.5 -402,449,693.4 54.2 Median age for Asian residents56.6 54.1 -1,092,290,987.0 Median age for Native Hawaiian / Pacific Islander residents-858,307,848.3 -800,880,087.2 53.6 Median age for Other race residents53.4 43.8 51.2 Median age for Two or more races residents50.9 55.7 68.0 Median age for White alone residents68.3 67.8 40.8 Median age for Hispanic or Latino residents41.0 40.4
Owner/renter occupied households by race in Estero
House owners and renters - White residents 14,269 85.2% Owner occupied2,483 14.8% Renter occupiedHouse owners and renters - Black or African American residents 165 75.4% Owner occupied54 24.6% Renter occupiedHouse owners and renters - Asian residents 408 85.9% Owner occupied67 14.1% Renter occupiedHouse owners and renters - Other race residents 113 97.7% Owner occupied3 2.3% Renter occupiedHouse owners and renters - Two or more races residents 772 72.0% Owner occupied301 28.0% Renter occupiedHouse owners and renters - White alone residents 14,430 84.7% Owner occupied2,597 15.3% Renter occupiedHouse owners and renters - Hispanic or Latino residents 864 76.3% Owner occupied268 23.7% Renter occupied
Language usage in Estero
English speakers - Total 88.8% of residents of Estero speak English at home.
5.0% of residents speak Spanish at home 1,409 73.2% Speak English very well517 26.8% Speak English less than very well4.7% of residents speak other language at home 1,129 63.3% Speak English very well655 36.7% Speak English less than very well
English speakers - Born in the United States 96.2% of residents of Estero speak English at home.
2.4% of residents speak Spanish at home 622 90.0% Speak English very well69 10.0% Speak English less than very well1.1% of residents speak other language at home 262 84.0% Speak English very well50 16.0% Speak English less than very well
English speakers - Native, born elsewhere 45.2% of residents of Estero speak English at home.
32.1% of residents speak Spanish at home 70 59.8% Speak English very well47 40.2% Speak English less than very well8.2% of residents speak other language at home 30 100.0% Speak English very well
English speakers - Foreign-born 55.2% of residents of Estero speak English at home.
14.9% of residents speak Spanish at home 317 46.3% Speak English very well367 53.7% Speak English less than very well30.5% of residents speak other language at home 757 54.2% Speak English very well640 45.8% Speak English less than very well
White (Caucasian) - Speak only English Native:
99.6% (29,895)Foreign-born:
86.6% (1,277)
White (Caucasian) - Speak another language Native:
2.0% (593)Foreign-born:
32.9% (485)
Black or African American - Speak only English Native:
97.8% (355)Foreign-born:
100.0% (187)
Asian - Speak only English Native:
56.3% (127)Foreign-born:
46.0% (410)
Asian - Speak another language Native:
31.7% (71)Foreign-born:
56.1% (500)
Other race - Speak only English Native:
47.7% (136)Foreign-born:
40.2% (43)
Other race - Speak another language Native:
47.7% (136)Foreign-born:
59.8% (65)
Two or more races - Speak only English Native:
52.7% (788)Foreign-born:
47.2% (541)
Two or more races - Speak another language Native:
43.7% (655)Foreign-born:
53.1% (609)
White alone - Speak only English Native:
98.2% (29,718)Foreign-born:
71.4% (1,373)
White alone - Speak another language Native:
1.8% (540)Foreign-born:
29.8% (573)
Hispanic or Latino - Speak only English Native:
50.6% (1,029)Foreign-born:
23.5% (244)
Hispanic or Latino - Speak another language Native:
46.2% (939)Foreign-born:
74.7% (775)
Foreign-born residents in Estero 4,193 residents are foreign born (3.1% Latin America , 2.5% Europe , 2.5% North America , 2.3% Asia ).
This city:
10.7%Florida:
21.1%
Marital status for residents in Estero Marital status - White (Caucasian) population 15 years and over
Males 14.2% Never married71.6% Now married0.7% Separated3.7% Widowed9.8% DivorcedFemales 12.2% Never married62.7% Now married0.3% Separated12.0% Widowed12.8% DivorcedWomen who gave birth in the past 12 months Now married:
100.0% (151)Unmarried:
0.0% (0)
Women who did not give birth in the past 12 months Now married:
44.1% (1,344)Unmarried:
55.9% (1,702)
Marital status - Black or African American population 15 years and over
Males 21.8% Never married66.9% Now married0.0% Separated4.8% Widowed6.5% DivorcedFemales 7.9% Never married87.1% Now married0.0% Separated0.0% Widowed5.0% DivorcedWomen who did not give birth in the past 12 months Now married:
86.6% (74)Unmarried:
13.4% (11)
Marital status - Asian population 15 years and over
Males 25.3% Never married65.1% Now married5.8% Separated0.0% Widowed3.8% DivorcedFemales 16.7% Never married77.3% Now married0.0% Separated2.9% Widowed3.1% DivorcedWomen who did not give birth in the past 12 months Now married:
40.9% (95)Unmarried:
59.1% (138)
Marital status - Other race population 15 years and over
Males 5.1% Never married67.8% Now married0.0% Separated0.0% Widowed27.1% DivorcedFemales 35.9% Never married38.8% Now married0.0% Separated12.1% Widowed13.1% DivorcedWomen who did not give birth in the past 12 months Now married:
33.3% (31)Unmarried:
66.7% (62)
Marital status - Two or more races population 15 years and over
Males 24.5% Never married59.7% Now married8.6% Separated1.8% Widowed5.4% DivorcedFemales 13.9% Never married58.5% Now married6.7% Separated10.6% Widowed10.2% DivorcedWomen who gave birth in the past 12 months Now married:
100.0% (67)Unmarried:
0.0% (0)
Women who did not give birth in the past 12 months Now married:
48.4% (186)Unmarried:
51.6% (199)
Marital status - White alone, not Hispanic / Latino population 15 years and over
Males 13.9% Never married71.7% Now married0.7% Separated3.7% Widowed9.9% DivorcedFemales 10.9% Never married63.5% Now married0.3% Separated12.4% Widowed12.9% DivorcedWomen who gave birth in the past 12 months Now married:
100.0% (169)Unmarried:
0.0% (0)
Women who did not give birth in the past 12 months Now married:
47.1% (1,455)Unmarried:
52.9% (1,631)
Marital status - Hispanic or Latino population 15 years and over
Males 24.9% Never married58.6% Now married5.6% Separated1.2% Widowed9.8% DivorcedFemales 32.6% Never married46.2% Now married3.7% Separated8.6% Widowed8.8% DivorcedWomen who gave birth in the past 12 months Now married:
100.0% (42)Unmarried:
0.0% (0)
Women who did not give birth in the past 12 months Now married:
27.3% (173)Unmarried:
72.7% (459)
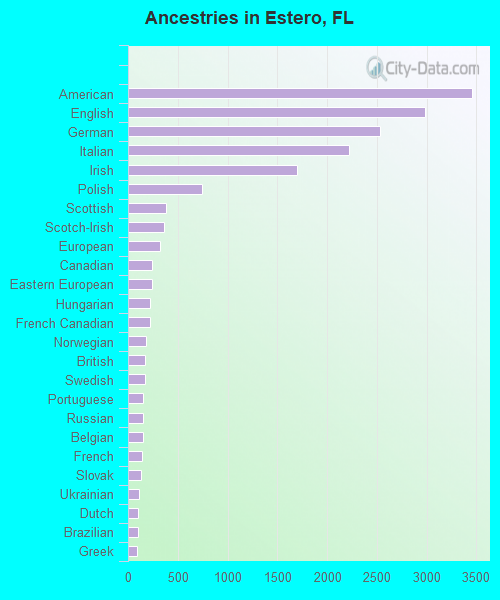
Ancestries in Estero
3,453 16.5% American2,983 14.2% English2,528 12.1% German2,224 10.6% Italian1,697 8.1% Irish743 3.5% Polish386 1.8% Scottish358 1.7% Scotch-Irish326 1.6% European243 1.2% Canadian241 1.1% Eastern European224 1.1% Hungarian224 1.1% French Canadian184 0.9% Norwegian175 0.8% British173 0.8% Swedish149 0.7% Portuguese147 0.7% Russian146 0.7% Belgian144 0.7% French133 0.6% Slovak107 0.5% Ukrainian104 0.5% Dutch99 0.5% Brazilian87 0.4% Greek65 0.3% Finnish63 0.3% Welsh59 0.3% Croatian58 0.3% Albanian53 0.3% Austrian49 0.2% Scandinavian49 0.2% Celtic47 0.2% Turkish41 0.2% Egyptian38 0.2% Macedonian37 0.2% Australian37 0.2% Iranian34 0.2% Czechoslovakian29 0.1% Czech23 0.1% South African20 0.10% Armenian16 0.08% Slovene15 0.07% Jamaican11 0.05% Lithuanian10 0.05% Belizean9 0.04% Danish9 0.04% Yugoslavian6 0.03% Lebanese6 0.03% Romanian6 0.03% Jordanian6 0.03% Icelander6 0.03% Estonian4 0.02% Latvian
Geographical mobility in Estero Same house 1 year ago 28,101 88.7% White (Caucasian)544 99.6% Black or African American30 100.0% American Indian / Alaska Native886 79.5% Asian324 79.6% Other race1,987 76.2% Two or more races28,954 88.5% White alone, not Hispanic / Latino2,846 88.8% Hispanic or LatinoMoved within same county 1,033 3.3% White / Caucasian24 2.1% Asian18 100.0% Native Hawaiian / Pacific Islander36 8.8% Other race59 2.3% Two or more races1,058 3.2% White alone, not Hispanic / Latino134 4.2% Hispanic or LatinoMoved within same state 473 1.5% White / Caucasian60 5.4% Asian52 12.7% Other race92 3.5% Two or more races485 1.5% White alone, not Hispanic / Latino82 2.6% Hispanic or LatinoMoved from different state 2,053 6.5% White / Caucasian46 8.5% Black or African American70 6.3% Asian259 10.0% Two or more races2,135 6.5% White alone, not Hispanic / Latino109 3.4% Hispanic or LatinoMoved from abroad 308 1.0% White59 5.3% Asian125 4.8% Two or more races380 1.2% White alone, not Hispanic / Latino
Children Nativity (place of birth) in Estero
Children under 6 years - Living with two parents Both parents native 766 100.0% NativeBoth parents foreign-born 32 100.0% NativeOne native, one foreign-born parent 71 100.0% NativeChildren under 6 years - Living with one parent Native parent 29 100.0% NativeForeign-born parent 72 100.0% NativeChildren 6 to 17 years - Living with two parents Both parents native 1,469 99.8% Native3 0.2% Foreign-bornBoth parents foreign-born 146 83.4% Native29 16.6% Foreign-bornOne native, one foreign-born parent 174 89.1% Native21 10.9% Foreign-bornChildren 6 to 17 years - Living with one parent Native parent 720 100.0% NativeForeign-born parent 208 60.3% Native137 39.7% Foreign-born
Grandparents responsible for own grandchildren in Estero
Grandparents (30 to 59 years) White / Caucasian 29 41.3% Responsible for grandchildren42 58.7% Not responsible for grandchildrenWhite alone, not Hispanic / Latino 36 40.0% Responsible for grandchildren53 60.0% Not responsible for grandchildrenGrandparents (60 years and over) White / Caucasian 25 34.4% Responsible for grandchildren47 65.6% Not responsible for grandchildrenWhite alone, not Hispanic / Latino 53 100.0% Not responsible for grandchildren