Races in Ephrata, Pennsylvania (PA) Detailed Stats
Data:
Races - White alone (%)
Races - White alone (% change since 2000)
Races - Black alone (%)
Races - Black alone (% change since 2000)
Races - American Indian alone (%)
Races - American Indian alone (% change since 2000)
Races - Asian alone (%)
Races - Asian alone (% change since 2000)
Races - Hispanic (%)
Races - Hispanic (% change since 2000)
Races - Native Hawaiian and Other Pacific Islander alone (%)
Races - Native Hawaiian and Other Pacific Islander alone (% change since 2000)
Races - Two or more races(%)
Races - Two or more races(% change since 2000)
Races - Other race alone (%)
Races - Other race alone (% change since 2000)
Racial diversity
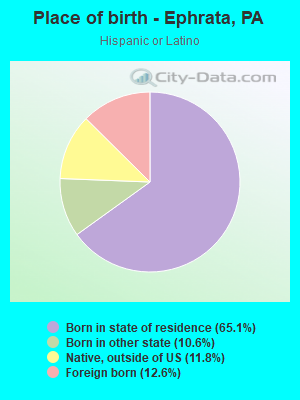
Place of birth - Born in state of residence (%)
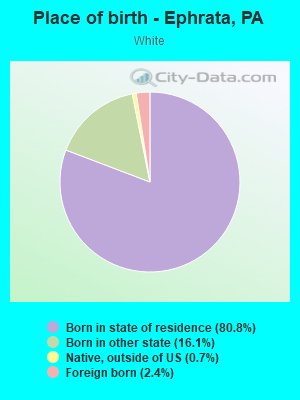
Place of birth - Born in state of residence (%) - White
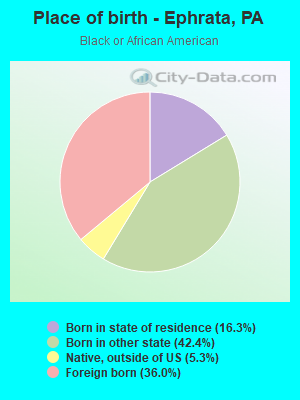
Place of birth - Born in state of residence (%) - Black or African American
Place of birth - Born in state of residence (%) - Asian
Place of birth - Born in state of residence (%) - Hispanic or Latino
Place of birth - Born in state of residence (%) - American Indian and Alaska Native
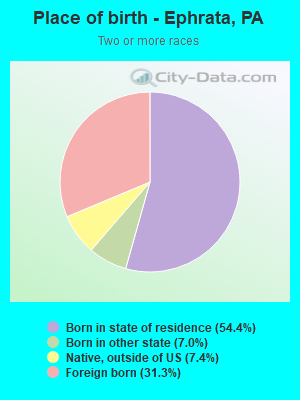
Place of birth - Born in state of residence (%) - Multirace
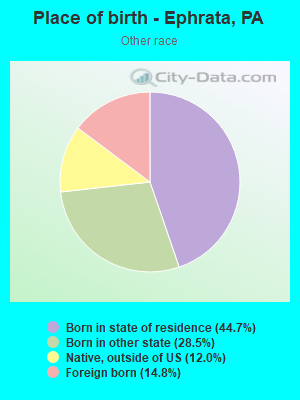
Place of birth - Born in state of residence (%) - Other Race
Place of birth - Born in other state (%)
Place of birth - Born in other state (%) - White
Place of birth - Born in other state (%) - Black or African American
Place of birth - Born in other state (%) - Asian
Place of birth - Born in other state (%) - Hispanic or Latino
Place of birth - Born in other state (%) - American Indian and Alaska Native
Place of birth - Born in other state (%) - Multirace
Place of birth - Born in other state (%) - Other Race
Place of birth - Native, outside of US (%)
Place of birth - Native, outside of US (%) - White
Place of birth - Native, outside of US (%) - Black or African American
Place of birth - Native, outside of US (%) - Asian
Place of birth - Native, outside of US (%) - Hispanic or Latino
Place of birth - Native, outside of US (%) - American Indian and Alaska Native
Place of birth - Native, outside of US (%) - Multirace
Place of birth - Native, outside of US (%) - Other Race
Place of birth - Foreign born (%)
Place of birth - Foreign born (%) - White
Place of birth - Foreign born (%) - Black or African American
Place of birth - Foreign born (%) - Asian
Place of birth - Foreign born (%) - Hispanic or Latino
Place of birth - Foreign born (%) - American Indian and Alaska Native
Place of birth - Foreign born (%) - Multirace
Place of birth - Foreign born (%) - Other Race
Residents speaking English at home (%)
Residents speaking English at home - Born in the United States (%)
Residents speaking English at home - Native, born elsewhere (%)
Residents speaking English at home - Foreign born (%)
Residents speaking Spanish at home (%)
Residents speaking Spanish at home - Born in the United States (%)
Residents speaking Spanish at home - Native, born elsewhere (%)
Residents speaking Spanish at home - Foreign born (%)
Residents speaking other language at home (%)
Residents speaking other language at home - Born in the United States (%)
Residents speaking other language at home - Native, born elsewhere (%)
Residents speaking other language at home - Foreign born (%)
Marital status - Never married (%)
Marital status - Now married (%)
Marital status - Separated (%)
Marital status - Widowed (%)
Marital status - Divorced (%)
Ancestries Reported - Arab (%)
Ancestries Reported - Czech (%)
Ancestries Reported - Danish (%)
Ancestries Reported - Dutch (%)
Ancestries Reported - English (%)
Ancestries Reported - French (%)
Ancestries Reported - French Canadian (%)
Ancestries Reported - German (%)
Ancestries Reported - Greek (%)
Ancestries Reported - Hungarian (%)
Ancestries Reported - Irish (%)
Ancestries Reported - Italian (%)
Ancestries Reported - Lithuanian (%)
Ancestries Reported - Norwegian (%)
Ancestries Reported - Polish (%)
Ancestries Reported - Portuguese (%)
Ancestries Reported - Russian (%)
Ancestries Reported - Scotch-Irish (%)
Ancestries Reported - Scottish (%)
Ancestries Reported - Slovak (%)
Ancestries Reported - Subsaharan African (%)
Ancestries Reported - Swedish (%)
Ancestries Reported - Swiss (%)
Ancestries Reported - Ukrainian (%)
Ancestries Reported - United States (%)
Ancestries Reported - Welsh (%)
Ancestries Reported - West Indian (%)
Ancestries Reported - Other (%)
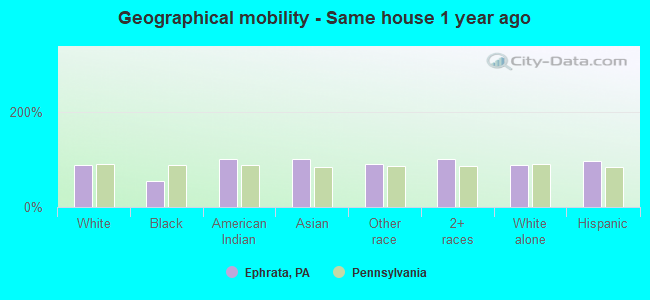
Geographical mobility - Same house 1 year ago (%)
Geographical mobility - Same house 1 year ago (%) - White
Geographical mobility - Same house 1 year ago (%) - Black or African American
Geographical mobility - Same house 1 year ago (%) - Asian
Geographical mobility - Same house 1 year ago (%) - Hispanic or Latino
Geographical mobility - Same house 1 year ago (%) - American Indian and Alaska Native
Geographical mobility - Same house 1 year ago (%) - Multirace
Geographical mobility - Same house 1 year ago (%) - Other Race
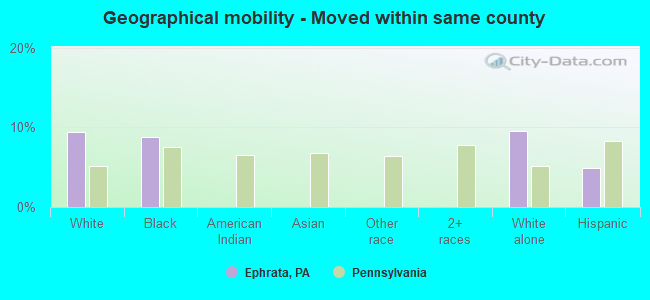
Geographical mobility - Moved within same county (%)
Geographical mobility - Moved within same county (%) - White
Geographical mobility - Moved within same county (%) - Black or African American
Geographical mobility - Moved within same county (%) - Asian
Geographical mobility - Moved within same county (%) - Hispanic or Latino
Geographical mobility - Moved within same county (%) - American Indian and Alaska Native
Geographical mobility - Moved within same county (%) - Multirace
Geographical mobility - Moved within same county (%) - Other Race
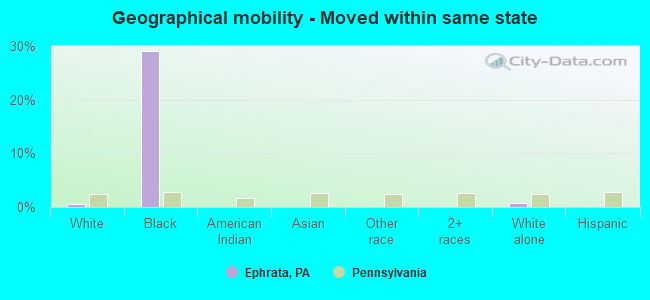
Geographical mobility - Moved from different county within same state (%)
Geographical mobility - Moved from different county within same state (%) - White
Geographical mobility - Moved from different county within same state (%) - Black or African American
Geographical mobility - Moved from different county within same state (%) - Asian
Geographical mobility - Moved from different county within same state (%) - Hispanic or Latino
Geographical mobility - Moved from different county within same state (%) - American Indian and Alaska Native
Geographical mobility - Moved from different county within same state (%) - Multirace
Geographical mobility - Moved from different county within same state (%) - Other Race
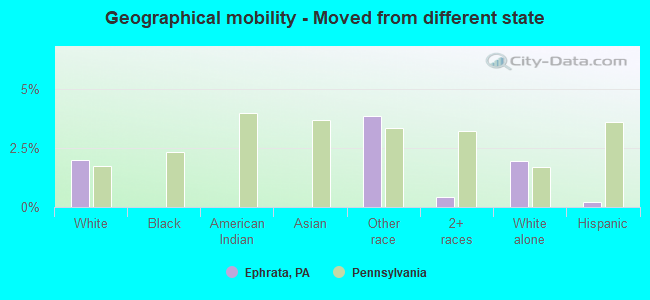
Geographical mobility - Moved from different state (%)
Geographical mobility - Moved from different state (%) - White
Geographical mobility - Moved from different state (%) - Black or African American
Geographical mobility - Moved from different state (%) - Asian
Geographical mobility - Moved from different state (%) - Hispanic or Latino
Geographical mobility - Moved from different state (%) - American Indian and Alaska Native
Geographical mobility - Moved from different state (%) - Multirace
Geographical mobility - Moved from different state (%) - Other Race
Geographical mobility - Moved from abroad (%)
Geographical mobility - Moved from abroad (%) - White
Geographical mobility - Moved from abroad (%) - Black or African American
Geographical mobility - Moved from abroad (%) - Asian
Geographical mobility - Moved from abroad (%) - Hispanic or Latino
Geographical mobility - Moved from abroad (%) - American Indian and Alaska Native
Geographical mobility - Moved from abroad (%) - Multirace
Geographical mobility - Moved from abroad (%) - Other Race
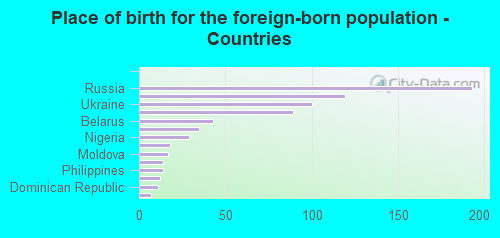
Place of birth for the foreign-born population - Ireland (%)
Place of birth for the foreign-born population - Denmark (%)
Place of birth for the foreign-born population - Norway (%)
Place of birth for the foreign-born population - Sweden (%)
Place of birth for the foreign-born population - United Kingdom (%)
Place of birth for the foreign-born population - England (%)
Place of birth for the foreign-born population - Scotland (%)
Place of birth for the foreign-born population - Other Northern Europe (%)
Place of birth for the foreign-born population - Austria (%)
Place of birth for the foreign-born population - Belgium (%)
Place of birth for the foreign-born population - France (%)
Place of birth for the foreign-born population - Germany (%)
Place of birth for the foreign-born population - Netherlands (%)
Place of birth for the foreign-born population - Switzerland (%)
Place of birth for the foreign-born population - Other Western Europe (%)
Place of birth for the foreign-born population - Greece (%)
Place of birth for the foreign-born population - Italy (%)
Place of birth for the foreign-born population - Portugal (%)
Place of birth for the foreign-born population - Spain (%)
Place of birth for the foreign-born population - Other Southern Europe (%)
Place of birth for the foreign-born population - Albania (%)
Place of birth for the foreign-born population - Belarus (%)
Place of birth for the foreign-born population - Bosnia and Herzegovina (%)
Place of birth for the foreign-born population - Bulgaria (%)
Place of birth for the foreign-born population - Croatia (%)
Place of birth for the foreign-born population - Czechoslovakia (%)
Place of birth for the foreign-born population - Hungary (%)
Place of birth for the foreign-born population - Latvia (%)
Place of birth for the foreign-born population - Lithuania (%)
Place of birth for the foreign-born population - North Macedonia (Macedonia) (%)
Place of birth for the foreign-born population - Moldova (%)
Place of birth for the foreign-born population - Poland (%)
Place of birth for the foreign-born population - Romania (%)
Place of birth for the foreign-born population - Russia (%)
Place of birth for the foreign-born population - Serbia (%)
Place of birth for the foreign-born population - Ukraine (%)
Place of birth for the foreign-born population - Other Eastern Europe (%)
Place of birth for the foreign-born population - China (%)
Place of birth for the foreign-born population - Hong Kong (%)
Place of birth for the foreign-born population - Taiwan (%)
Place of birth for the foreign-born population - Japan (%)
Place of birth for the foreign-born population - Korea (%)
Place of birth for the foreign-born population - Other Eastern Asia (%)
Place of birth for the foreign-born population - Afghanistan (%)
Place of birth for the foreign-born population - Bangladesh (%)
Place of birth for the foreign-born population - India (%)
Place of birth for the foreign-born population - Iran (%)
Place of birth for the foreign-born population - Kazakhstan (%)
Place of birth for the foreign-born population - Nepal (%)
Place of birth for the foreign-born population - Pakistan (%)
Place of birth for the foreign-born population - Sri Lanka (%)
Place of birth for the foreign-born population - Uzbekistan (%)
Place of birth for the foreign-born population - Other South Central Asia (%)
Place of birth for the foreign-born population - Burma (%)
Place of birth for the foreign-born population - Cambodia (%)
Place of birth for the foreign-born population - Indonesia (%)
Place of birth for the foreign-born population - Laos (%)
Place of birth for the foreign-born population - Malaysia (%)
Place of birth for the foreign-born population - Philippines (%)
Place of birth for the foreign-born population - Singapore (%)
Place of birth for the foreign-born population - Thailand (%)
Place of birth for the foreign-born population - Vietnam (%)
Place of birth for the foreign-born population - Other South Eastern Asia (%)
Place of birth for the foreign-born population - Armenia (%)
Place of birth for the foreign-born population - Iraq (%)
Place of birth for the foreign-born population - Israel (%)
Place of birth for the foreign-born population - Jordan (%)
Place of birth for the foreign-born population - Kuwait (%)
Place of birth for the foreign-born population - Lebanon (%)
Place of birth for the foreign-born population - Saudi Arabia (%)
Place of birth for the foreign-born population - Syria (%)
Place of birth for the foreign-born population - Turkey (%)
Place of birth for the foreign-born population - Yemen (%)
Place of birth for the foreign-born population - Other Western Asia (%)
Place of birth for the foreign-born population - Eritrea (%)
Place of birth for the foreign-born population - Ethiopia (%)
Place of birth for the foreign-born population - Kenya (%)
Place of birth for the foreign-born population - Somalia (%)
Place of birth for the foreign-born population - Uganda (%)
Place of birth for the foreign-born population - Zimbabwe (%)
Place of birth for the foreign-born population - Other Eastern Africa (%)
Place of birth for the foreign-born population - Cameroon (%)
Place of birth for the foreign-born population - Congo (%)
Place of birth for the foreign-born population - Democratic Republic of Congo (Zaire) (%)
Place of birth for the foreign-born population - Other Middle Africa (%)
Place of birth for the foreign-born population - Egypt (%)
Place of birth for the foreign-born population - Morocco (%)
Place of birth for the foreign-born population - Sudan (%)
Place of birth for the foreign-born population - Other Northern Africa (%)
Place of birth for the foreign-born population - South Africa (%)
Place of birth for the foreign-born population - Other Southern Africa (%)
Place of birth for the foreign-born population - Cabo Verde (%)
Place of birth for the foreign-born population - Ghana (%)
Place of birth for the foreign-born population - Liberia (%)
Place of birth for the foreign-born population - Nigeria (%)
Place of birth for the foreign-born population - Senegal (%)
Place of birth for the foreign-born population - Sierra Leone (%)
Place of birth for the foreign-born population - Other Western Africa (%)
Place of birth for the foreign-born population - Australia (%)
Place of birth for the foreign-born population - New Zealand (%)
Place of birth for the foreign-born population - Fiji (%)
Place of birth for the foreign-born population - Micronesia (%)
Place of birth for the foreign-born population - Bahamas (%)
Place of birth for the foreign-born population - Barbados (%)
Place of birth for the foreign-born population - Cuba (%)
Place of birth for the foreign-born population - Dominica (%)
Place of birth for the foreign-born population - Dominican Republic (%)
Place of birth for the foreign-born population - Grenada (%)
Place of birth for the foreign-born population - Haiti (%)
Place of birth for the foreign-born population - Jamaica (%)
Place of birth for the foreign-born population - St. Vincent and the Grenadines (%)
Place of birth for the foreign-born population - Trinidad and Tobago (%)
Place of birth for the foreign-born population - West Indies (%)
Place of birth for the foreign-born population - Other Caribbean (%)
Place of birth for the foreign-born population - Belize (%)
Place of birth for the foreign-born population - Costa Rica (%)
Place of birth for the foreign-born population - El Salvador (%)
Place of birth for the foreign-born population - Guatemala (%)
Place of birth for the foreign-born population - Honduras (%)
Place of birth for the foreign-born population - Mexico (%)
Place of birth for the foreign-born population - Nicaragua (%)
Place of birth for the foreign-born population - Panama (%)
Place of birth for the foreign-born population - Other Central America (%)
Place of birth for the foreign-born population - Argentina (%)
Place of birth for the foreign-born population - Bolivia (%)
Place of birth for the foreign-born population - Brazil (%)
Place of birth for the foreign-born population - Chile (%)
Place of birth for the foreign-born population - Colombia (%)
Place of birth for the foreign-born population - Ecuador (%)
Place of birth for the foreign-born population - Guyana (%)
Place of birth for the foreign-born population - Peru (%)
Place of birth for the foreign-born population - Uruguay (%)
Place of birth for the foreign-born population - Venezuela (%)
Place of birth for the foreign-born population - Other South America (%)
Place of birth for the foreign-born population - Canada (%)
Place of birth for the foreign-born population - Other Northern America (%)
Place of birth for the foreign-born population - Other (%)
Latest news about races in Ephrata, PA collected exclusively by city-data.com from local newspapers, TV, and radio stations
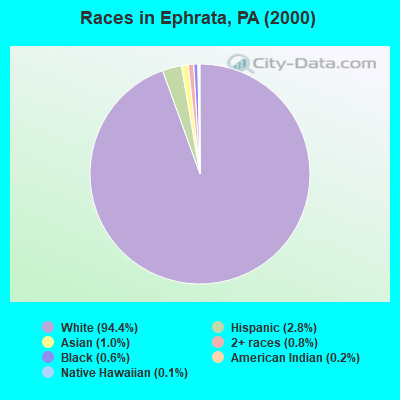
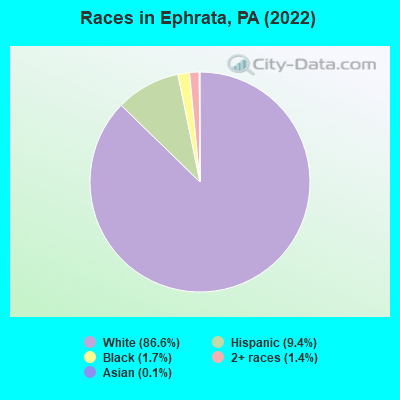
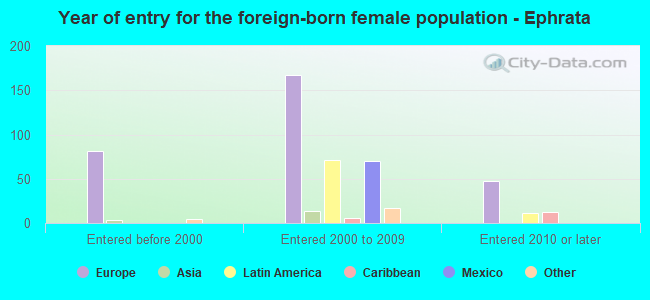
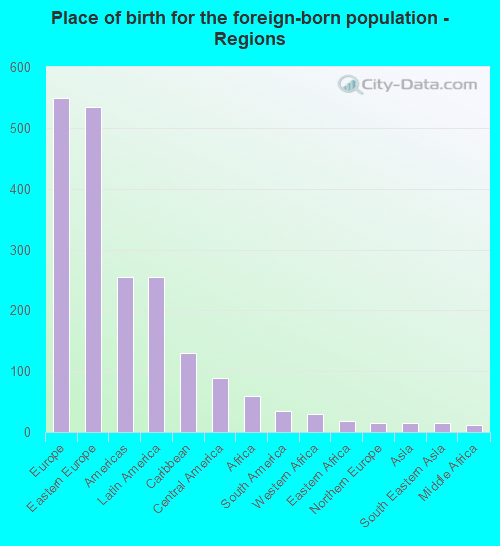
According to 2022 data, the most numerous races in Ephrata, PA are White alone (11,967 residents), Black alone (234 residents), and Hispanic (1,294 residents). 89.7% of Ephrata residents speak English at home. 6.4% of Ephrata, PA residents are foreign-born (3.8% born in Europe, 1.8% born in Latin America), which is 10.1% less than the foreign-born rate of 7.0% across the entire state of Pennsylvania.
Race distribution in Ephrata
2000 2022
10,322,455 84.1% White alone 1,202,437 9.8% Black alone 394,088 3.2% Hispanic 218,296 1.8% Asian alone 113,097 0.9% Two or more races 13,086 0.1% Other race alone 14,904 0.1% American Indian alone 2,691 0.02% Native Hawaiian and Other
9,487,228 73.1% White alone 1,311,581 10.1% Black alone 1,115,997 8.6% Hispanic 493,942 3.8% Two or more races 487,124 3.8% Asian alone 63,582 0.5% Other race alone 10,130 0.08% American Indian alone 2,424 0.02% Native Hawaiian and Other
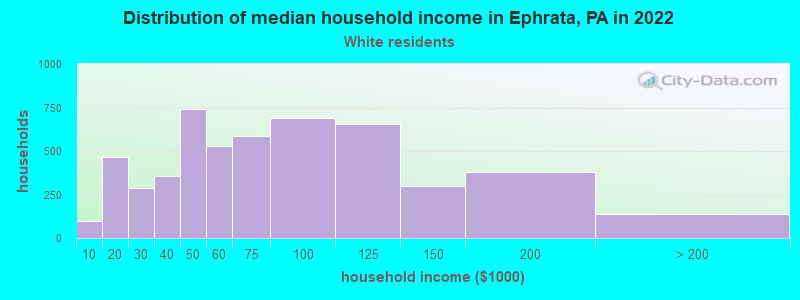
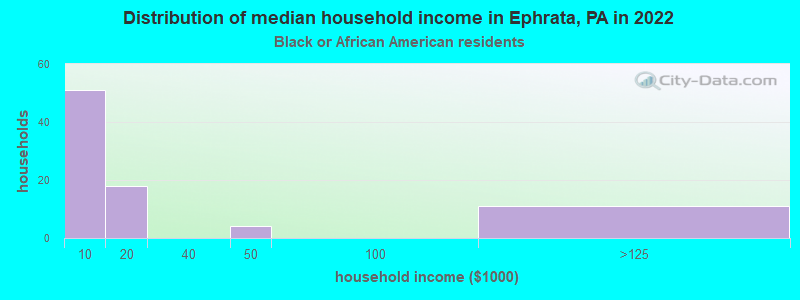
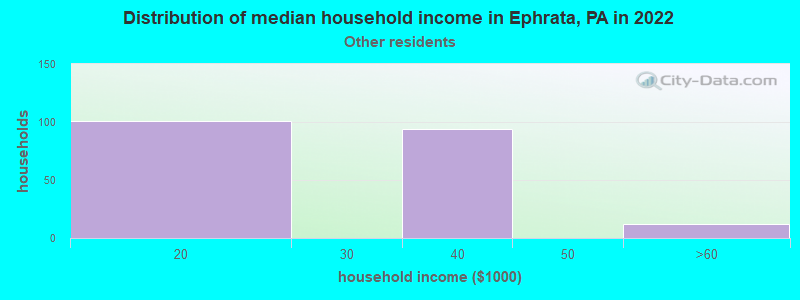
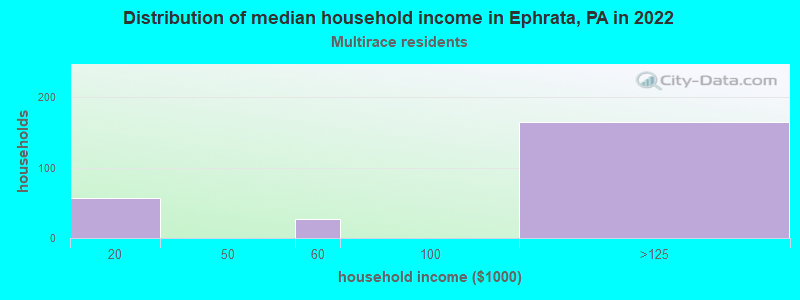
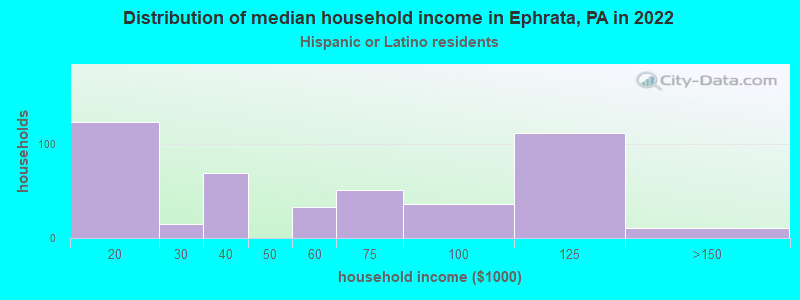
Income and house value in Ephrata Median household income in 2022 $66,228 White non-Hispanic householders$92,837 Two or more races householders$38,762 Hispanic or Latino race householdersMedian 2022 house value $223,158 White Non-Hispanic householders $253,846 Asian householders$261,517 Hispanic or Latino householders
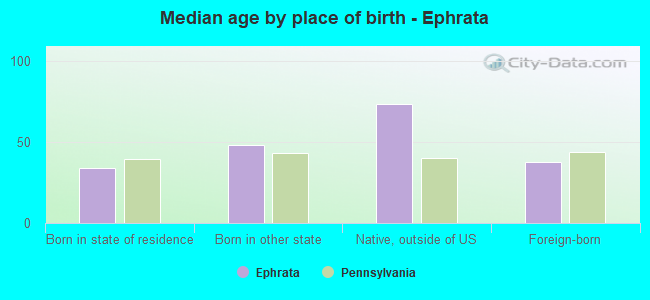
Median age by race in Ephrata
37.4 Median age for White residents37.3 37.9 29.2 Median age for Black or African American residents26.1 29.7 -642,857,142.2 Median age for American Indian / Alaska Native residents-714,583,332.6 -577,519,379.3 -700,098,327.7 Median age for Asian residents-683,026,584.2 -737,827,714.6 -612,499,999.4 Median age for Native Hawaiian / Pacific Islander residents-760,416,665.9 -747,474,746.7 28.2 Median age for Other race residents25.6 56.6 36.4 Median age for Two or more races residents41.9 33.4 37.3 Median age for White alone residents37.2 38.3 31.0 Median age for Hispanic or Latino residents26.9 32.0
Owner/renter occupied households by race in Ephrata
House owners and renters - White residents 3,017 57.6% Owner occupied2,218 42.4% Renter occupiedHouse owners and renters - Black or African American residents 53 100.0% Renter occupiedHouse owners and renters - American Indian / Alaska Native residents 7 100.0% Owner occupiedHouse owners and renters - Other race residents 22 12.6% Owner occupied152 87.4% Renter occupiedHouse owners and renters - Two or more races residents 7 2.6% Owner occupied275 97.4% Renter occupiedHouse owners and renters - White alone residents 2,994 59.0% Owner occupied2,078 41.0% Renter occupiedHouse owners and renters - Hispanic or Latino residents 81 13.1% Owner occupied537 86.9% Renter occupied
Language usage in Ephrata
English speakers - Total 89.7% of residents of Ephrata speak English at home.
4.6% of residents speak Spanish at home 296 50.3% Speak English very well292 49.7% Speak English less than very well5.8% of residents speak other language at home 327 43.5% Speak English very well425 56.5% Speak English less than very well
English speakers - Born in the United States 94.4% of residents of Ephrata speak English at home.
1.0% of residents speak Spanish at home 22 100.0% Speak English very well2.4% of residents speak other language at home 16 29.6% Speak English very well38 70.4% Speak English less than very well
English speakers - Native, born elsewhere 39.8% of residents of Ephrata speak English at home.
58.4% of residents speak Spanish at home 30 22.2% Speak English very well105 77.8% Speak English less than very well
English speakers - Foreign-born 9.1% of residents of Ephrata speak English at home.
17.8% of residents speak Spanish at home 129 100.0% Speak English less than very well68.4% of residents speak other language at home 182 36.7% Speak English very well314 63.3% Speak English less than very well
White (Caucasian) - Speak only English Native:
96.5% (10,762)Foreign-born:
11.9% (36)
White (Caucasian) - Speak another language Native:
3.3% (367)Foreign-born:
74.9% (224)
Black or African American - Speak only English Native:
100.0% (99)Foreign-born:
17.8% (14)
Other race - Speak another language Native:
57.0% (210)Foreign-born:
86.0% (58)
Two or more races - Speak another language Native:
25.9% (67)Foreign-born:
100.0% (161)
White alone - Speak only English Native:
97.4% (10,545)Foreign-born:
10.9% (38)
White alone - Speak another language Native:
1.8% (196)Foreign-born:
76.3% (268)
Hispanic or Latino - Speak another language Native:
41.0% (409)Foreign-born:
99.2% (163)
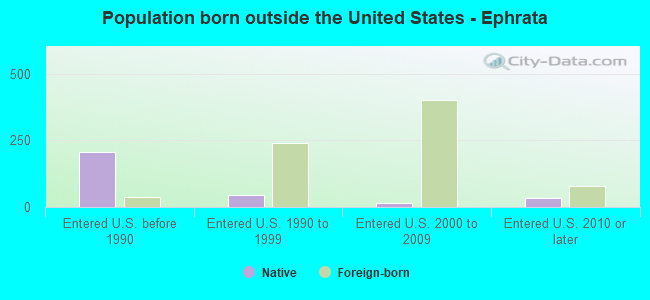
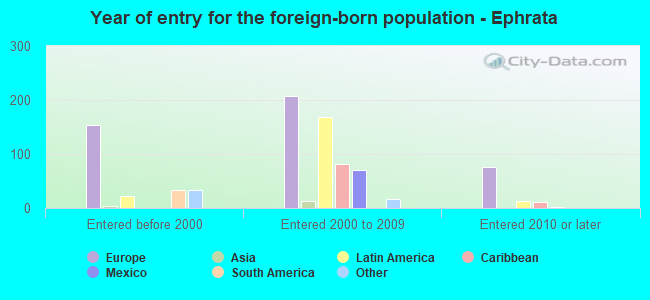
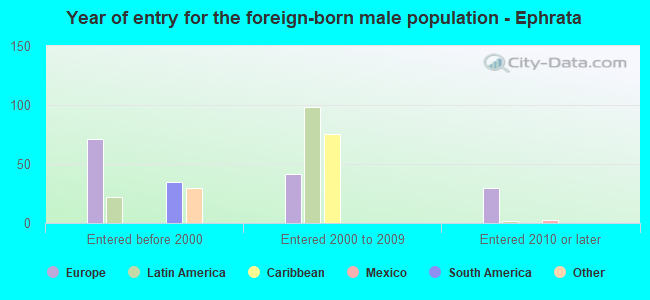
Foreign-born residents in Ephrata 879 residents are foreign born (3.8% Europe , 1.8% Latin America ).
This city:
6.4%Pennsylvania:
7.3%
Marital status for residents in Ephrata Marital status - White (Caucasian) population 15 years and over
Males 27.6% Never married54.7% Now married3.0% Separated4.8% Widowed9.8% DivorcedFemales 25.3% Never married50.9% Now married0.9% Separated11.9% Widowed11.0% DivorcedWomen who gave birth in the past 12 months Now married:
88.3% (145)Unmarried:
11.7% (19)
Women who did not give birth in the past 12 months Now married:
53.0% (1,371)Unmarried:
47.0% (1,217)
Marital status - Black or African American population 15 years and over
Males 46.8% Never married53.2% Now married0.0% Separated0.0% Widowed0.0% DivorcedFemales 22.2% Never married70.4% Now married0.0% Separated7.4% Widowed0.0% DivorcedWomen who did not give birth in the past 12 months Now married:
76.0% (39)Unmarried:
24.0% (12)
Marital status - Other race population 15 years and over
Males 82.3% Never married8.8% Now married8.8% Separated0.0% Widowed0.0% DivorcedFemales 12.9% Never married6.8% Now married0.0% Separated34.7% Widowed45.6% DivorcedWomen who did not give birth in the past 12 months Now married:
34.5% (12)Unmarried:
65.5% (22)
Marital status - Two or more races population 15 years and over
Males 83.0% Never married0.0% Now married0.0% Separated0.0% Widowed17.0% DivorcedFemales 61.3% Never married21.3% Now married0.0% Separated17.3% Widowed0.0% DivorcedWomen who gave birth in the past 12 months Now married:
0.0% (0)Unmarried:
100.0% (12)
Women who did not give birth in the past 12 months Now married:
16.0% (23)Unmarried:
84.0% (122)
Marital status - White alone, not Hispanic / Latino population 15 years and over
Males 27.1% Never married55.2% Now married2.6% Separated4.9% Widowed10.2% DivorcedFemales 25.9% Never married50.8% Now married0.9% Separated10.9% Widowed11.5% DivorcedWomen who gave birth in the past 12 months Now married:
84.6% (109)Unmarried:
15.4% (20)
Women who did not give birth in the past 12 months Now married:
52.4% (1,366)Unmarried:
47.6% (1,240)
Marital status - Hispanic or Latino population 15 years and over
Males 65.4% Never married21.2% Now married11.4% Separated0.0% Widowed2.0% DivorcedFemales 27.3% Never married28.6% Now married0.0% Separated28.6% Widowed15.5% DivorcedWomen who gave birth in the past 12 months Now married:
83.7% (40)Unmarried:
16.3% (8)
Women who did not give birth in the past 12 months Now married:
36.4% (62)Unmarried:
63.6% (108)
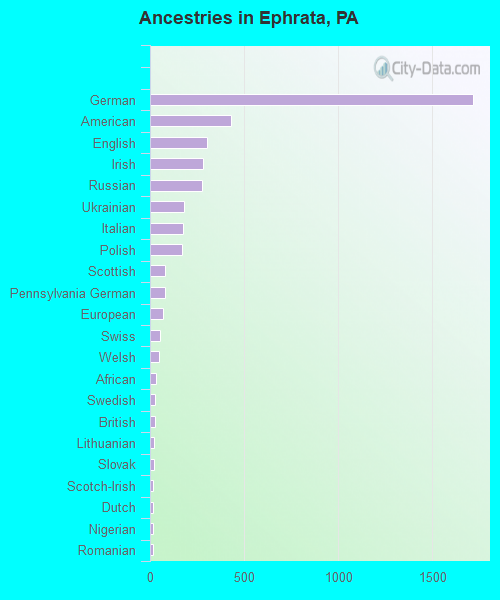
Ancestries in Ephrata
1,715 34.7% German428 8.7% American304 6.2% English283 5.7% Irish278 5.6% Russian178 3.6% Ukrainian174 3.5% Italian171 3.5% Polish81 1.6% Scottish78 1.6% Pennsylvania German70 1.4% European54 1.1% Swiss49 1.0% Welsh32 0.6% African29 0.6% Swedish26 0.5% British19 0.4% Lithuanian19 0.4% Slovak18 0.4% Scotch-Irish17 0.3% Dutch17 0.3% Nigerian16 0.3% Romanian13 0.3% Greek12 0.2% French6 0.1% Hungarian
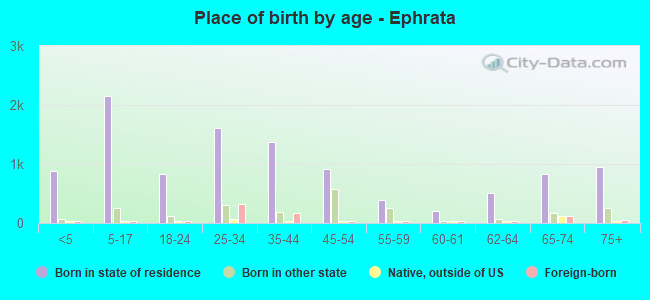
Children Nativity (place of birth) in Ephrata
Children under 6 years - Living with two parents Both parents native 692 100.0% NativeBoth parents foreign-born 66 100.0% NativeOne native, one foreign-born parent 40 100.0% NativeChildren under 6 years - Living with one parent Native parent 256 100.0% NativeChildren 6 to 17 years - Living with two parents Both parents native 1,271 100.0% NativeBoth parents foreign-born 36 100.0% NativeOne native, one foreign-born parent 151 100.0% NativeChildren 6 to 17 years - Living with one parent Native parent 667 100.0% NativeForeign-born parent 49 45.0% Native60 55.0% Foreign-born
Grandparents responsible for own grandchildren in Ephrata
Grandparents (30 to 59 years) White / Caucasian 30 24.7% Responsible for grandchildren90 75.3% Not responsible for grandchildrenWhite alone, not Hispanic / Latino 31 22.6% Responsible for grandchildren105 77.4% Not responsible for grandchildren
Grandparents (60 years and over) White / Caucasian 49 100.0% Not responsible for grandchildrenWhite alone, not Hispanic / Latino 52 100.0% Not responsible for grandchildren