Races in Emmaus, Pennsylvania (PA) Detailed Stats
Data:
Races - White alone (%)
Races - White alone (% change since 2000)
Races - Black alone (%)
Races - Black alone (% change since 2000)
Races - American Indian alone (%)
Races - American Indian alone (% change since 2000)
Races - Asian alone (%)
Races - Asian alone (% change since 2000)
Races - Hispanic (%)
Races - Hispanic (% change since 2000)
Races - Native Hawaiian and Other Pacific Islander alone (%)
Races - Native Hawaiian and Other Pacific Islander alone (% change since 2000)
Races - Two or more races(%)
Races - Two or more races(% change since 2000)
Races - Other race alone (%)
Races - Other race alone (% change since 2000)
Racial diversity
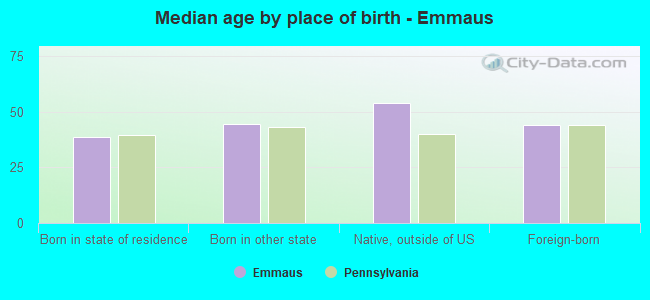
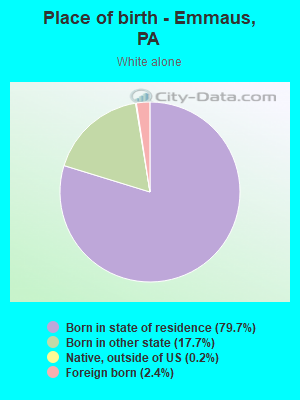
Place of birth - Born in state of residence (%)
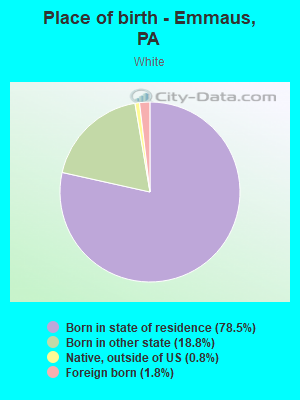
Place of birth - Born in state of residence (%) - White
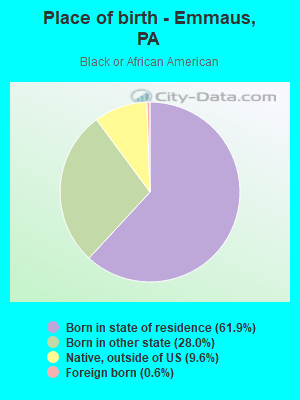
Place of birth - Born in state of residence (%) - Black or African American
Place of birth - Born in state of residence (%) - Asian
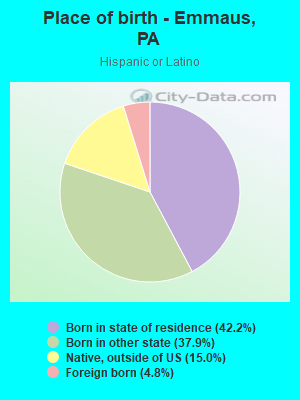
Place of birth - Born in state of residence (%) - Hispanic or Latino
Place of birth - Born in state of residence (%) - American Indian and Alaska Native
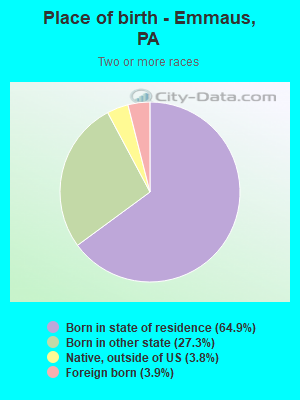
Place of birth - Born in state of residence (%) - Multirace
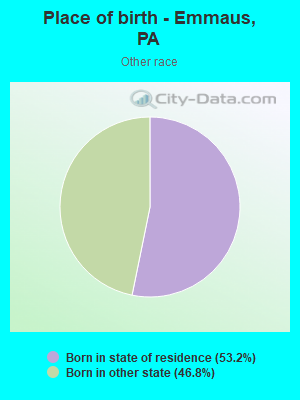
Place of birth - Born in state of residence (%) - Other Race
Place of birth - Born in other state (%)
Place of birth - Born in other state (%) - White
Place of birth - Born in other state (%) - Black or African American
Place of birth - Born in other state (%) - Asian
Place of birth - Born in other state (%) - Hispanic or Latino
Place of birth - Born in other state (%) - American Indian and Alaska Native
Place of birth - Born in other state (%) - Multirace
Place of birth - Born in other state (%) - Other Race
Place of birth - Native, outside of US (%)
Place of birth - Native, outside of US (%) - White
Place of birth - Native, outside of US (%) - Black or African American
Place of birth - Native, outside of US (%) - Asian
Place of birth - Native, outside of US (%) - Hispanic or Latino
Place of birth - Native, outside of US (%) - American Indian and Alaska Native
Place of birth - Native, outside of US (%) - Multirace
Place of birth - Native, outside of US (%) - Other Race
Place of birth - Foreign born (%)
Place of birth - Foreign born (%) - White
Place of birth - Foreign born (%) - Black or African American
Place of birth - Foreign born (%) - Asian
Place of birth - Foreign born (%) - Hispanic or Latino
Place of birth - Foreign born (%) - American Indian and Alaska Native
Place of birth - Foreign born (%) - Multirace
Place of birth - Foreign born (%) - Other Race
Residents speaking English at home (%)
Residents speaking English at home - Born in the United States (%)
Residents speaking English at home - Native, born elsewhere (%)
Residents speaking English at home - Foreign born (%)
Residents speaking Spanish at home (%)
Residents speaking Spanish at home - Born in the United States (%)
Residents speaking Spanish at home - Native, born elsewhere (%)
Residents speaking Spanish at home - Foreign born (%)
Residents speaking other language at home (%)
Residents speaking other language at home - Born in the United States (%)
Residents speaking other language at home - Native, born elsewhere (%)
Residents speaking other language at home - Foreign born (%)
Marital status - Never married (%)
Marital status - Now married (%)
Marital status - Separated (%)
Marital status - Widowed (%)
Marital status - Divorced (%)
Ancestries Reported - Arab (%)
Ancestries Reported - Czech (%)
Ancestries Reported - Danish (%)
Ancestries Reported - Dutch (%)
Ancestries Reported - English (%)
Ancestries Reported - French (%)
Ancestries Reported - French Canadian (%)
Ancestries Reported - German (%)
Ancestries Reported - Greek (%)
Ancestries Reported - Hungarian (%)
Ancestries Reported - Irish (%)
Ancestries Reported - Italian (%)
Ancestries Reported - Lithuanian (%)
Ancestries Reported - Norwegian (%)
Ancestries Reported - Polish (%)
Ancestries Reported - Portuguese (%)
Ancestries Reported - Russian (%)
Ancestries Reported - Scotch-Irish (%)
Ancestries Reported - Scottish (%)
Ancestries Reported - Slovak (%)
Ancestries Reported - Subsaharan African (%)
Ancestries Reported - Swedish (%)
Ancestries Reported - Swiss (%)
Ancestries Reported - Ukrainian (%)
Ancestries Reported - United States (%)
Ancestries Reported - Welsh (%)
Ancestries Reported - West Indian (%)
Ancestries Reported - Other (%)
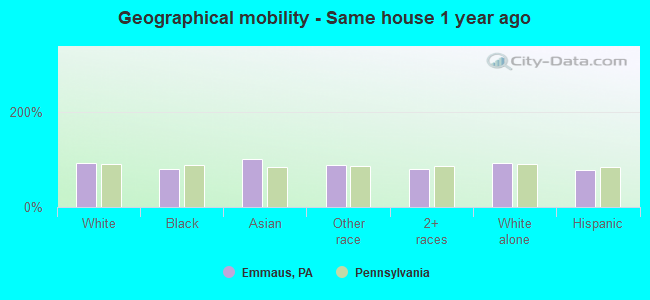
Geographical mobility - Same house 1 year ago (%)
Geographical mobility - Same house 1 year ago (%) - White
Geographical mobility - Same house 1 year ago (%) - Black or African American
Geographical mobility - Same house 1 year ago (%) - Asian
Geographical mobility - Same house 1 year ago (%) - Hispanic or Latino
Geographical mobility - Same house 1 year ago (%) - American Indian and Alaska Native
Geographical mobility - Same house 1 year ago (%) - Multirace
Geographical mobility - Same house 1 year ago (%) - Other Race
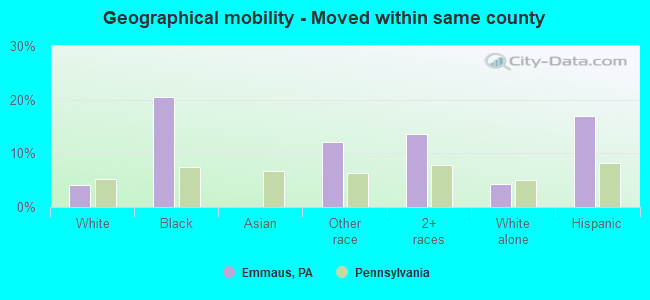
Geographical mobility - Moved within same county (%)
Geographical mobility - Moved within same county (%) - White
Geographical mobility - Moved within same county (%) - Black or African American
Geographical mobility - Moved within same county (%) - Asian
Geographical mobility - Moved within same county (%) - Hispanic or Latino
Geographical mobility - Moved within same county (%) - American Indian and Alaska Native
Geographical mobility - Moved within same county (%) - Multirace
Geographical mobility - Moved within same county (%) - Other Race
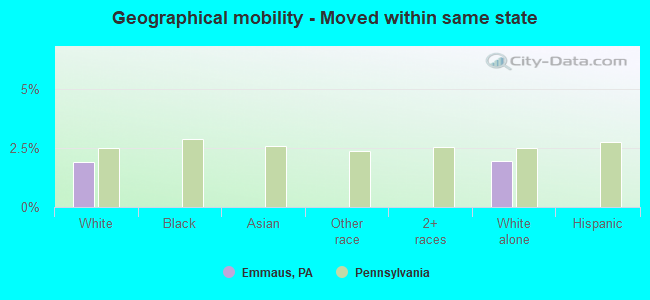
Geographical mobility - Moved from different county within same state (%)
Geographical mobility - Moved from different county within same state (%) - White
Geographical mobility - Moved from different county within same state (%) - Black or African American
Geographical mobility - Moved from different county within same state (%) - Asian
Geographical mobility - Moved from different county within same state (%) - Hispanic or Latino
Geographical mobility - Moved from different county within same state (%) - American Indian and Alaska Native
Geographical mobility - Moved from different county within same state (%) - Multirace
Geographical mobility - Moved from different county within same state (%) - Other Race
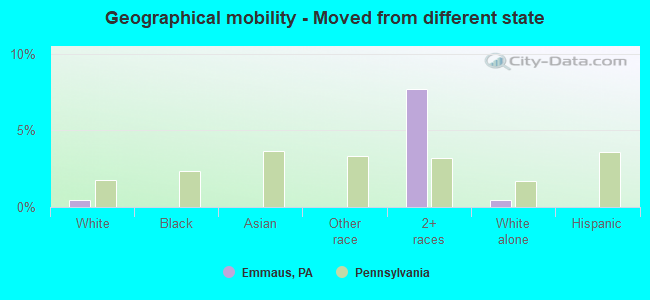
Geographical mobility - Moved from different state (%)
Geographical mobility - Moved from different state (%) - White
Geographical mobility - Moved from different state (%) - Black or African American
Geographical mobility - Moved from different state (%) - Asian
Geographical mobility - Moved from different state (%) - Hispanic or Latino
Geographical mobility - Moved from different state (%) - American Indian and Alaska Native
Geographical mobility - Moved from different state (%) - Multirace
Geographical mobility - Moved from different state (%) - Other Race
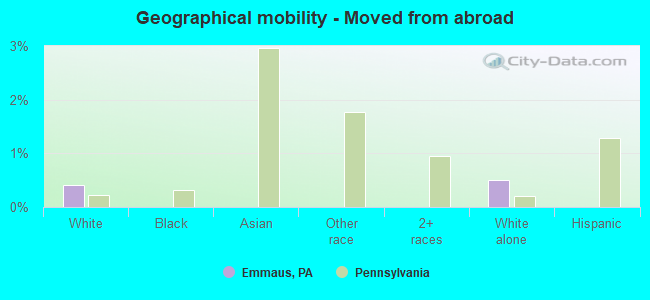
Geographical mobility - Moved from abroad (%)
Geographical mobility - Moved from abroad (%) - White
Geographical mobility - Moved from abroad (%) - Black or African American
Geographical mobility - Moved from abroad (%) - Asian
Geographical mobility - Moved from abroad (%) - Hispanic or Latino
Geographical mobility - Moved from abroad (%) - American Indian and Alaska Native
Geographical mobility - Moved from abroad (%) - Multirace
Geographical mobility - Moved from abroad (%) - Other Race
Place of birth for the foreign-born population - Ireland (%)
Place of birth for the foreign-born population - Denmark (%)
Place of birth for the foreign-born population - Norway (%)
Place of birth for the foreign-born population - Sweden (%)
Place of birth for the foreign-born population - United Kingdom (%)
Place of birth for the foreign-born population - England (%)
Place of birth for the foreign-born population - Scotland (%)
Place of birth for the foreign-born population - Other Northern Europe (%)
Place of birth for the foreign-born population - Austria (%)
Place of birth for the foreign-born population - Belgium (%)
Place of birth for the foreign-born population - France (%)
Place of birth for the foreign-born population - Germany (%)
Place of birth for the foreign-born population - Netherlands (%)
Place of birth for the foreign-born population - Switzerland (%)
Place of birth for the foreign-born population - Other Western Europe (%)
Place of birth for the foreign-born population - Greece (%)
Place of birth for the foreign-born population - Italy (%)
Place of birth for the foreign-born population - Portugal (%)
Place of birth for the foreign-born population - Spain (%)
Place of birth for the foreign-born population - Other Southern Europe (%)
Place of birth for the foreign-born population - Albania (%)
Place of birth for the foreign-born population - Belarus (%)
Place of birth for the foreign-born population - Bosnia and Herzegovina (%)
Place of birth for the foreign-born population - Bulgaria (%)
Place of birth for the foreign-born population - Croatia (%)
Place of birth for the foreign-born population - Czechoslovakia (%)
Place of birth for the foreign-born population - Hungary (%)
Place of birth for the foreign-born population - Latvia (%)
Place of birth for the foreign-born population - Lithuania (%)
Place of birth for the foreign-born population - North Macedonia (Macedonia) (%)
Place of birth for the foreign-born population - Moldova (%)
Place of birth for the foreign-born population - Poland (%)
Place of birth for the foreign-born population - Romania (%)
Place of birth for the foreign-born population - Russia (%)
Place of birth for the foreign-born population - Serbia (%)
Place of birth for the foreign-born population - Ukraine (%)
Place of birth for the foreign-born population - Other Eastern Europe (%)
Place of birth for the foreign-born population - China (%)
Place of birth for the foreign-born population - Hong Kong (%)
Place of birth for the foreign-born population - Taiwan (%)
Place of birth for the foreign-born population - Japan (%)
Place of birth for the foreign-born population - Korea (%)
Place of birth for the foreign-born population - Other Eastern Asia (%)
Place of birth for the foreign-born population - Afghanistan (%)
Place of birth for the foreign-born population - Bangladesh (%)
Place of birth for the foreign-born population - India (%)
Place of birth for the foreign-born population - Iran (%)
Place of birth for the foreign-born population - Kazakhstan (%)
Place of birth for the foreign-born population - Nepal (%)
Place of birth for the foreign-born population - Pakistan (%)
Place of birth for the foreign-born population - Sri Lanka (%)
Place of birth for the foreign-born population - Uzbekistan (%)
Place of birth for the foreign-born population - Other South Central Asia (%)
Place of birth for the foreign-born population - Burma (%)
Place of birth for the foreign-born population - Cambodia (%)
Place of birth for the foreign-born population - Indonesia (%)
Place of birth for the foreign-born population - Laos (%)
Place of birth for the foreign-born population - Malaysia (%)
Place of birth for the foreign-born population - Philippines (%)
Place of birth for the foreign-born population - Singapore (%)
Place of birth for the foreign-born population - Thailand (%)
Place of birth for the foreign-born population - Vietnam (%)
Place of birth for the foreign-born population - Other South Eastern Asia (%)
Place of birth for the foreign-born population - Armenia (%)
Place of birth for the foreign-born population - Iraq (%)
Place of birth for the foreign-born population - Israel (%)
Place of birth for the foreign-born population - Jordan (%)
Place of birth for the foreign-born population - Kuwait (%)
Place of birth for the foreign-born population - Lebanon (%)
Place of birth for the foreign-born population - Saudi Arabia (%)
Place of birth for the foreign-born population - Syria (%)
Place of birth for the foreign-born population - Turkey (%)
Place of birth for the foreign-born population - Yemen (%)
Place of birth for the foreign-born population - Other Western Asia (%)
Place of birth for the foreign-born population - Eritrea (%)
Place of birth for the foreign-born population - Ethiopia (%)
Place of birth for the foreign-born population - Kenya (%)
Place of birth for the foreign-born population - Somalia (%)
Place of birth for the foreign-born population - Uganda (%)
Place of birth for the foreign-born population - Zimbabwe (%)
Place of birth for the foreign-born population - Other Eastern Africa (%)
Place of birth for the foreign-born population - Cameroon (%)
Place of birth for the foreign-born population - Congo (%)
Place of birth for the foreign-born population - Democratic Republic of Congo (Zaire) (%)
Place of birth for the foreign-born population - Other Middle Africa (%)
Place of birth for the foreign-born population - Egypt (%)
Place of birth for the foreign-born population - Morocco (%)
Place of birth for the foreign-born population - Sudan (%)
Place of birth for the foreign-born population - Other Northern Africa (%)
Place of birth for the foreign-born population - South Africa (%)
Place of birth for the foreign-born population - Other Southern Africa (%)
Place of birth for the foreign-born population - Cabo Verde (%)
Place of birth for the foreign-born population - Ghana (%)
Place of birth for the foreign-born population - Liberia (%)
Place of birth for the foreign-born population - Nigeria (%)
Place of birth for the foreign-born population - Senegal (%)
Place of birth for the foreign-born population - Sierra Leone (%)
Place of birth for the foreign-born population - Other Western Africa (%)
Place of birth for the foreign-born population - Australia (%)
Place of birth for the foreign-born population - New Zealand (%)
Place of birth for the foreign-born population - Fiji (%)
Place of birth for the foreign-born population - Micronesia (%)
Place of birth for the foreign-born population - Bahamas (%)
Place of birth for the foreign-born population - Barbados (%)
Place of birth for the foreign-born population - Cuba (%)
Place of birth for the foreign-born population - Dominica (%)
Place of birth for the foreign-born population - Dominican Republic (%)
Place of birth for the foreign-born population - Grenada (%)
Place of birth for the foreign-born population - Haiti (%)
Place of birth for the foreign-born population - Jamaica (%)
Place of birth for the foreign-born population - St. Vincent and the Grenadines (%)
Place of birth for the foreign-born population - Trinidad and Tobago (%)
Place of birth for the foreign-born population - West Indies (%)
Place of birth for the foreign-born population - Other Caribbean (%)
Place of birth for the foreign-born population - Belize (%)
Place of birth for the foreign-born population - Costa Rica (%)
Place of birth for the foreign-born population - El Salvador (%)
Place of birth for the foreign-born population - Guatemala (%)
Place of birth for the foreign-born population - Honduras (%)
Place of birth for the foreign-born population - Mexico (%)
Place of birth for the foreign-born population - Nicaragua (%)
Place of birth for the foreign-born population - Panama (%)
Place of birth for the foreign-born population - Other Central America (%)
Place of birth for the foreign-born population - Argentina (%)
Place of birth for the foreign-born population - Bolivia (%)
Place of birth for the foreign-born population - Brazil (%)
Place of birth for the foreign-born population - Chile (%)
Place of birth for the foreign-born population - Colombia (%)
Place of birth for the foreign-born population - Ecuador (%)
Place of birth for the foreign-born population - Guyana (%)
Place of birth for the foreign-born population - Peru (%)
Place of birth for the foreign-born population - Uruguay (%)
Place of birth for the foreign-born population - Venezuela (%)
Place of birth for the foreign-born population - Other South America (%)
Place of birth for the foreign-born population - Canada (%)
Place of birth for the foreign-born population - Other Northern America (%)
Place of birth for the foreign-born population - Other (%)
Latest news about races in Emmaus, PA collected exclusively by city-data.com from local newspapers, TV, and radio stations
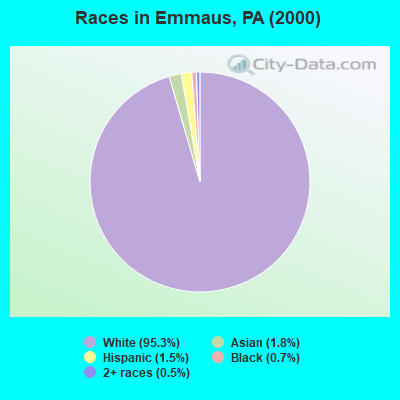
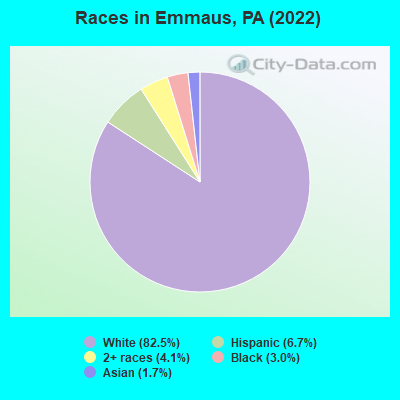
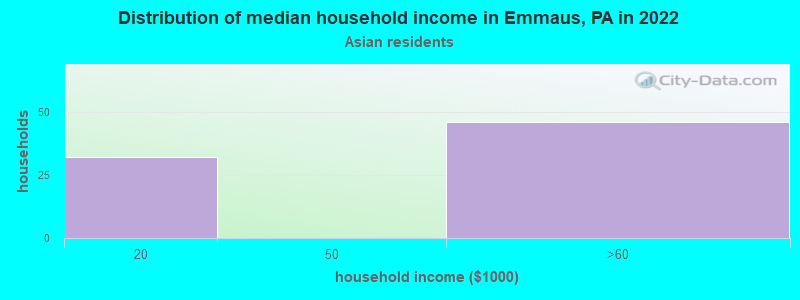
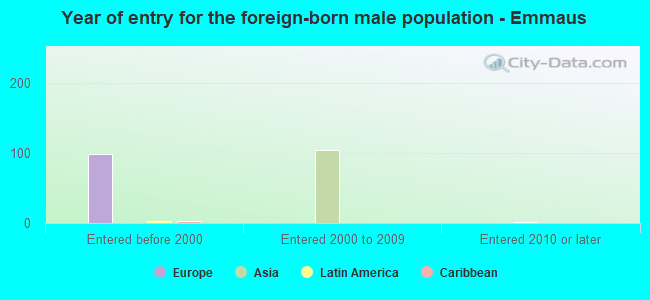
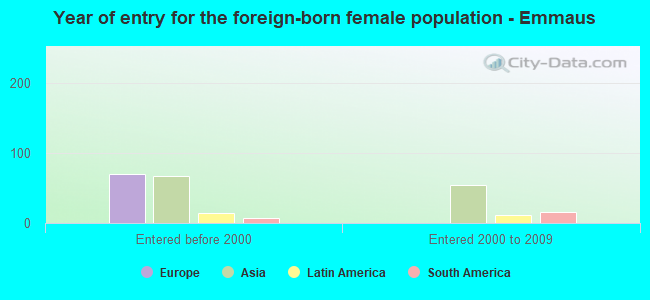
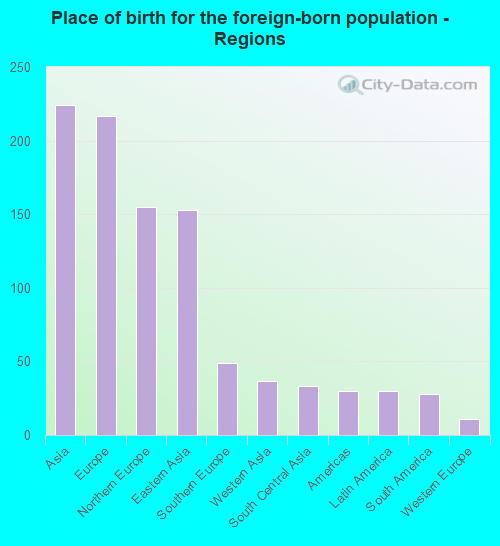
According to 2022 data, the most numerous races in Emmaus, PA are White alone (9,660 residents), Black alone (350 residents), and Hispanic (788 residents). 94.8% of Emmaus residents speak English at home. 4.0% of Emmaus, PA residents are foreign-born (1.9% born in Asia, 1.8% born in Europe), which is 73.7% less than the foreign-born rate of 7.0% across the entire state of Pennsylvania.
Race distribution in Emmaus
2000 2022
10,322,455 84.1% White alone 1,202,437 9.8% Black alone 394,088 3.2% Hispanic 218,296 1.8% Asian alone 113,097 0.9% Two or more races 13,086 0.1% Other race alone 14,904 0.1% American Indian alone 2,691 0.02% Native Hawaiian and Other
9,487,228 73.1% White alone 1,311,581 10.1% Black alone 1,115,997 8.6% Hispanic 493,942 3.8% Two or more races 487,124 3.8% Asian alone 63,582 0.5% Other race alone 10,130 0.08% American Indian alone 2,424 0.02% Native Hawaiian and Other
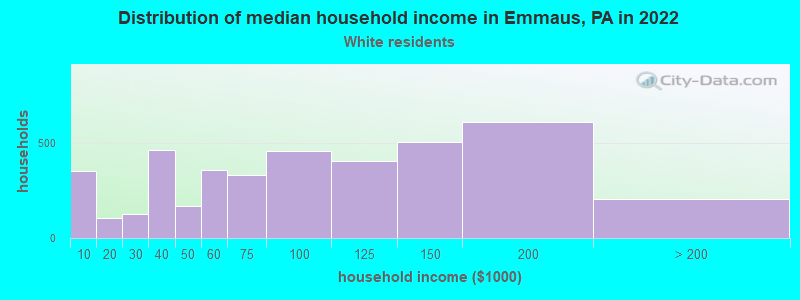
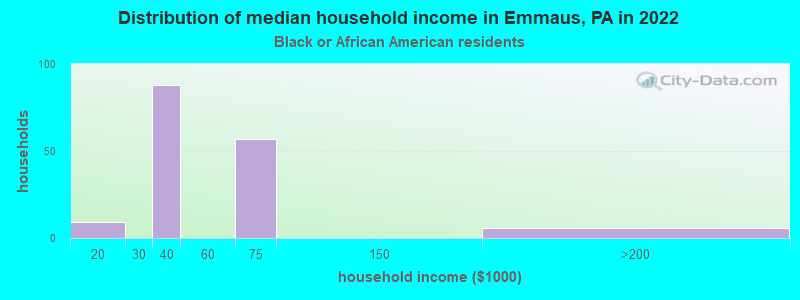
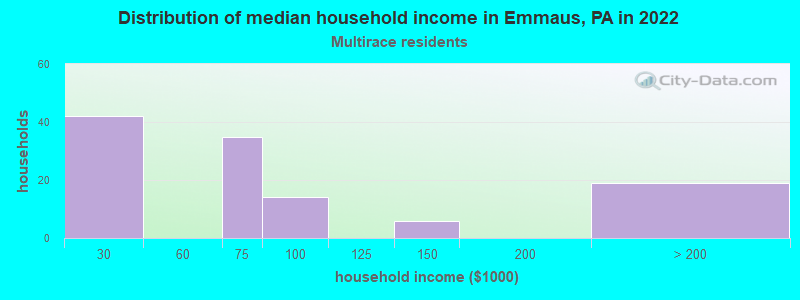
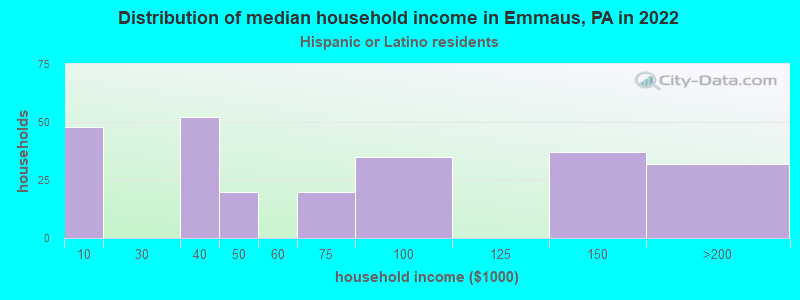
Income and house value in Emmaus Median household income in 2022 $82,677 White non-Hispanic householders$48,804 Black householders$74,526 Two or more races householders$64,402 Hispanic or Latino race householdersMedian 2022 house value $263,382 White Non-Hispanic householders $128,308 Asian householders$524,899 Two or more races householders$379,093 Hispanic or Latino householders
Median age by race in Emmaus
45.6 Median age for White residents42.6 46.5 14.9 Median age for Black or African American residents10.3 42.1 -700,389,104.4 Median age for American Indian / Alaska Native residents-611,303,344.3 -1,505,804,310.3 47.5 Median age for Asian residents-670,433,144.3 50.5 -680,432,644.4 Median age for Native Hawaiian / Pacific Islander residents-649,523,808.9 -747,474,746.7 38.1 Median age for Other race residents38.4 -687,631,026.6 20.4 Median age for Two or more races residents19.1 23.7 43.8 Median age for White alone residents40.4 45.3 31.6 Median age for Hispanic or Latino residents11.9 32.6
Owner/renter occupied households by race in Emmaus
House owners and renters - White residents 2,951 73.4% Owner occupied1,071 26.6% Renter occupiedHouse owners and renters - Black or African American residents 26 22.9% Owner occupied88 77.1% Renter occupiedHouse owners and renters - Asian residents 36 39.1% Owner occupied55 60.9% Renter occupiedHouse owners and renters - Other race residents 26 100.0% Renter occupiedHouse owners and renters - Two or more races residents 21 18.8% Owner occupied93 81.2% Renter occupiedHouse owners and renters - White alone residents 2,981 72.1% Owner occupied1,153 27.9% Renter occupiedHouse owners and renters - Hispanic or Latino residents 74 27.5% Owner occupied195 72.5% Renter occupied
Language usage in Emmaus
English speakers - Total 94.8% of residents of Emmaus speak English at home.
3.0% of residents speak Spanish at home 249 75.0% Speak English very well83 25.0% Speak English less than very well1.4% of residents speak other language at home 80 50.6% Speak English very well78 49.4% Speak English less than very well
English speakers - Born in the United States 97.1% of residents of Emmaus speak English at home.
4.5% of residents speak Spanish at home 87 87.9% Speak English very well12 12.1% Speak English less than very well
English speakers - Native, born elsewhere 17.1% of residents of Emmaus speak English at home.
72.9% of residents speak Spanish at home 55 53.9% Speak English very well47 46.1% Speak English less than very well
English speakers - Foreign-born 53.2% of residents of Emmaus speak English at home.
4.4% of residents speak Spanish at home 23 100.0% Speak English very well29.2% of residents speak other language at home 91 59.9% Speak English very well61 40.1% Speak English less than very well
White (Caucasian) - Speak only English Native:
100.0% (8,684)Foreign-born:
100.0% (177)
White (Caucasian) - Speak another language Native:
1.0% (90)Foreign-born:
13.0% (23)
Black or African American - Speak only English Native:
95.8% (462)Foreign-born:
99.5% (2)
Two or more races - Speak only English Native:
97.7% (487)Foreign-born:
60.1% (15)
Two or more races - Speak another language Native:
8.4% (42)Foreign-born:
49.4% (12)
White alone - Speak only English Native:
99.9% (8,918)Foreign-born:
100.0% (233)
White alone - Speak another language Native:
0.3% (27)Foreign-born:
12.1% (28)
Hispanic or Latino - Speak only English Native:
66.4% (409)Foreign-born:
22.1% (8)
Hispanic or Latino - Speak another language Native:
36.2% (223)Foreign-born:
56.9% (21)
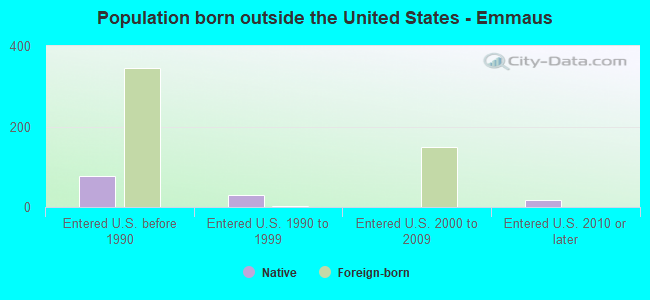
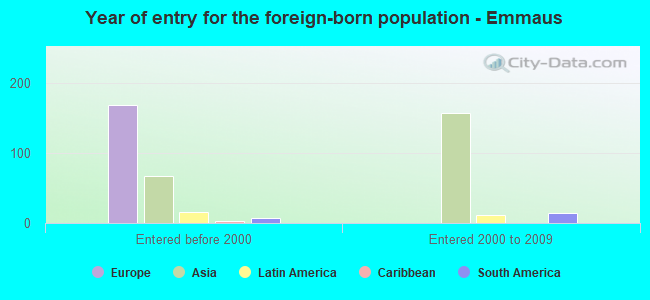
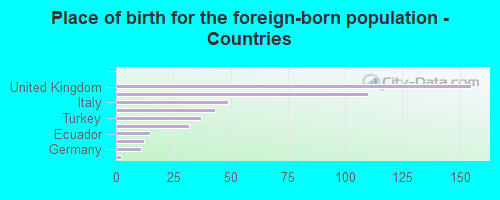
Foreign-born residents in Emmaus 472 residents are foreign born (1.9% Asia , 1.8% Europe ).
This city:
4.0%Pennsylvania:
7.3%
Marital status for residents in Emmaus Marital status - White (Caucasian) population 15 years and over
Males 35.3% Never married56.3% Now married0.1% Separated0.6% Widowed7.7% DivorcedFemales 23.8% Never married55.3% Now married1.0% Separated9.2% Widowed10.7% DivorcedWomen who gave birth in the past 12 months Now married:
83.9% (63)Unmarried:
16.1% (12)
Women who did not give birth in the past 12 months Now married:
55.8% (1,172)Unmarried:
44.2% (928)
Marital status - Black or African American population 15 years and over
Males 77.6% Never married20.6% Now married0.0% Separated0.0% Widowed1.9% DivorcedFemales 61.6% Never married17.4% Now married21.0% Separated0.0% Widowed0.0% DivorcedWomen who did not give birth in the past 12 months Now married:
36.1% (46)Unmarried:
63.9% (82)
Marital status - Asian population 15 years and over
Males 46.6% Never married53.4% Now married0.0% Separated0.0% Widowed0.0% DivorcedFemales 0.0% Never married65.3% Now married0.0% Separated0.0% Widowed34.7% DivorcedWomen who did not give birth in the past 12 months Now married:
65.3% (78)Unmarried:
34.7% (42)
Marital status - Other race population 15 years and over
Males 33.9% Never married66.1% Now married0.0% Separated0.0% Widowed0.0% DivorcedFemales 100.0% Never married0.0% Now married0.0% Separated0.0% Widowed0.0% DivorcedWomen who did not give birth in the past 12 months Now married:
0.0% (0)Unmarried:
100.0% (27)
Marital status - Two or more races population 15 years and over
Males 73.4% Never married26.6% Now married0.0% Separated0.0% Widowed0.0% DivorcedFemales 43.2% Never married44.5% Now married0.0% Separated0.0% Widowed12.3% DivorcedWomen who did not give birth in the past 12 months Now married:
50.8% (81)Unmarried:
49.2% (79)
Marital status - White alone, not Hispanic / Latino population 15 years and over
Males 36.0% Never married57.5% Now married0.1% Separated0.6% Widowed5.8% DivorcedFemales 24.1% Never married55.4% Now married1.0% Separated8.5% Widowed11.1% DivorcedWomen who gave birth in the past 12 months Now married:
83.9% (70)Unmarried:
16.1% (13)
Women who did not give birth in the past 12 months Now married:
54.9% (1,213)Unmarried:
45.1% (996)
Marital status - Hispanic or Latino population 15 years and over
Males 19.3% Never married31.5% Now married0.0% Separated0.0% Widowed49.2% DivorcedFemales 38.1% Never married45.5% Now married0.0% Separated16.4% Widowed0.0% DivorcedWomen who did not give birth in the past 12 months Now married:
53.4% (132)Unmarried:
46.6% (115)
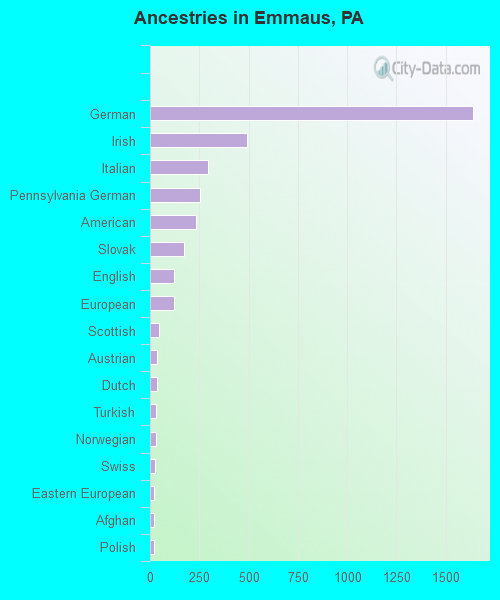
Ancestries in Emmaus
1,638 34.5% German492 10.4% Irish293 6.2% Italian256 5.4% Pennsylvania German231 4.9% American170 3.6% Slovak122 2.6% English121 2.5% European47 1.0% Scottish33 0.7% Austrian33 0.7% Dutch32 0.7% Turkish29 0.6% Norwegian24 0.5% Swiss22 0.5% Eastern European19 0.4% Afghan19 0.4% Polish13 0.3% Welsh10 0.2% Scotch-Irish
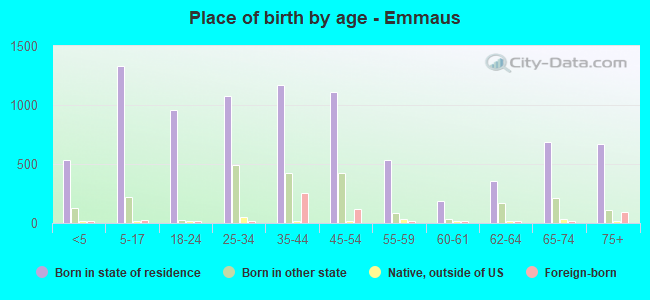
Children Nativity (place of birth) in Emmaus
Children under 6 years - Living with two parents Both parents native 460 100.0% NativeOne native, one foreign-born parent 78 100.0% NativeChildren under 6 years - Living with one parent Native parent 229 100.0% NativeChildren 6 to 17 years - Living with two parents Both parents native 689 100.0% NativeBoth parents foreign-born 25 100.0% Foreign-bornOne native, one foreign-born parent 46 100.0% NativeChildren 6 to 17 years - Living with one parent Native parent 710 100.0% NativeForeign-born parent 6 55.8% Native5 44.2% Foreign-born
Grandparents responsible for own grandchildren in Emmaus
Grandparents (30 to 59 years) White / Caucasian 44 23.0% Responsible for grandchildren146 77.0% Not responsible for grandchildrenOther race 60 100.0% Not responsible for grandchildrenWhite alone, not Hispanic / Latino 74 28.9% Responsible for grandchildren182 71.1% Not responsible for grandchildrenHispanic or Latino 46 100.0% Not responsible for grandchildrenGrandparents (60 years and over) White / Caucasian 107 93.7% Responsible for grandchildren7 6.3% Not responsible for grandchildrenWhite alone, not Hispanic / Latino 107 100.0% Responsible for grandchildrenHispanic or Latino 12 100.0% Not responsible for grandchildren