Races in Elmhurst, Illinois (IL) Detailed Stats
Data:
Races - White alone (%)
Races - White alone (% change since 2000)
Races - Black alone (%)
Races - Black alone (% change since 2000)
Races - American Indian alone (%)
Races - American Indian alone (% change since 2000)
Races - Asian alone (%)
Races - Asian alone (% change since 2000)
Races - Hispanic (%)
Races - Hispanic (% change since 2000)
Races - Native Hawaiian and Other Pacific Islander alone (%)
Races - Native Hawaiian and Other Pacific Islander alone (% change since 2000)
Races - Two or more races(%)
Races - Two or more races(% change since 2000)
Races - Other race alone (%)
Races - Other race alone (% change since 2000)
Racial diversity
Place of birth - Born in state of residence (%)
Place of birth - Born in state of residence (%) - White
Place of birth - Born in state of residence (%) - Black or African American
Place of birth - Born in state of residence (%) - Asian
Place of birth - Born in state of residence (%) - Hispanic or Latino
Place of birth - Born in state of residence (%) - American Indian and Alaska Native
Place of birth - Born in state of residence (%) - Multirace
Place of birth - Born in state of residence (%) - Other Race
Place of birth - Born in other state (%)
Place of birth - Born in other state (%) - White
Place of birth - Born in other state (%) - Black or African American
Place of birth - Born in other state (%) - Asian
Place of birth - Born in other state (%) - Hispanic or Latino
Place of birth - Born in other state (%) - American Indian and Alaska Native
Place of birth - Born in other state (%) - Multirace
Place of birth - Born in other state (%) - Other Race
Place of birth - Native, outside of US (%)
Place of birth - Native, outside of US (%) - White
Place of birth - Native, outside of US (%) - Black or African American
Place of birth - Native, outside of US (%) - Asian
Place of birth - Native, outside of US (%) - Hispanic or Latino
Place of birth - Native, outside of US (%) - American Indian and Alaska Native
Place of birth - Native, outside of US (%) - Multirace
Place of birth - Native, outside of US (%) - Other Race
Place of birth - Foreign born (%)
Place of birth - Foreign born (%) - White
Place of birth - Foreign born (%) - Black or African American
Place of birth - Foreign born (%) - Asian
Place of birth - Foreign born (%) - Hispanic or Latino
Place of birth - Foreign born (%) - American Indian and Alaska Native
Place of birth - Foreign born (%) - Multirace
Place of birth - Foreign born (%) - Other Race
Residents speaking English at home (%)
Residents speaking English at home - Born in the United States (%)
Residents speaking English at home - Native, born elsewhere (%)
Residents speaking English at home - Foreign born (%)
Residents speaking Spanish at home (%)
Residents speaking Spanish at home - Born in the United States (%)
Residents speaking Spanish at home - Native, born elsewhere (%)
Residents speaking Spanish at home - Foreign born (%)
Residents speaking other language at home (%)
Residents speaking other language at home - Born in the United States (%)
Residents speaking other language at home - Native, born elsewhere (%)
Residents speaking other language at home - Foreign born (%)
Marital status - Never married (%)
Marital status - Now married (%)
Marital status - Separated (%)
Marital status - Widowed (%)
Marital status - Divorced (%)
Ancestries Reported - Arab (%)
Ancestries Reported - Czech (%)
Ancestries Reported - Danish (%)
Ancestries Reported - Dutch (%)
Ancestries Reported - English (%)
Ancestries Reported - French (%)
Ancestries Reported - French Canadian (%)
Ancestries Reported - German (%)
Ancestries Reported - Greek (%)
Ancestries Reported - Hungarian (%)
Ancestries Reported - Irish (%)
Ancestries Reported - Italian (%)
Ancestries Reported - Lithuanian (%)
Ancestries Reported - Norwegian (%)
Ancestries Reported - Polish (%)
Ancestries Reported - Portuguese (%)
Ancestries Reported - Russian (%)
Ancestries Reported - Scotch-Irish (%)
Ancestries Reported - Scottish (%)
Ancestries Reported - Slovak (%)
Ancestries Reported - Subsaharan African (%)
Ancestries Reported - Swedish (%)
Ancestries Reported - Swiss (%)
Ancestries Reported - Ukrainian (%)
Ancestries Reported - United States (%)
Ancestries Reported - Welsh (%)
Ancestries Reported - West Indian (%)
Ancestries Reported - Other (%)
Geographical mobility - Same house 1 year ago (%)
Geographical mobility - Same house 1 year ago (%) - White
Geographical mobility - Same house 1 year ago (%) - Black or African American
Geographical mobility - Same house 1 year ago (%) - Asian
Geographical mobility - Same house 1 year ago (%) - Hispanic or Latino
Geographical mobility - Same house 1 year ago (%) - American Indian and Alaska Native
Geographical mobility - Same house 1 year ago (%) - Multirace
Geographical mobility - Same house 1 year ago (%) - Other Race
Geographical mobility - Moved within same county (%)
Geographical mobility - Moved within same county (%) - White
Geographical mobility - Moved within same county (%) - Black or African American
Geographical mobility - Moved within same county (%) - Asian
Geographical mobility - Moved within same county (%) - Hispanic or Latino
Geographical mobility - Moved within same county (%) - American Indian and Alaska Native
Geographical mobility - Moved within same county (%) - Multirace
Geographical mobility - Moved within same county (%) - Other Race
Geographical mobility - Moved from different county within same state (%)
Geographical mobility - Moved from different county within same state (%) - White
Geographical mobility - Moved from different county within same state (%) - Black or African American
Geographical mobility - Moved from different county within same state (%) - Asian
Geographical mobility - Moved from different county within same state (%) - Hispanic or Latino
Geographical mobility - Moved from different county within same state (%) - American Indian and Alaska Native
Geographical mobility - Moved from different county within same state (%) - Multirace
Geographical mobility - Moved from different county within same state (%) - Other Race
Geographical mobility - Moved from different state (%)
Geographical mobility - Moved from different state (%) - White
Geographical mobility - Moved from different state (%) - Black or African American
Geographical mobility - Moved from different state (%) - Asian
Geographical mobility - Moved from different state (%) - Hispanic or Latino
Geographical mobility - Moved from different state (%) - American Indian and Alaska Native
Geographical mobility - Moved from different state (%) - Multirace
Geographical mobility - Moved from different state (%) - Other Race
Geographical mobility - Moved from abroad (%)
Geographical mobility - Moved from abroad (%) - White
Geographical mobility - Moved from abroad (%) - Black or African American
Geographical mobility - Moved from abroad (%) - Asian
Geographical mobility - Moved from abroad (%) - Hispanic or Latino
Geographical mobility - Moved from abroad (%) - American Indian and Alaska Native
Geographical mobility - Moved from abroad (%) - Multirace
Geographical mobility - Moved from abroad (%) - Other Race
Place of birth for the foreign-born population - Ireland (%)
Place of birth for the foreign-born population - Denmark (%)
Place of birth for the foreign-born population - Norway (%)
Place of birth for the foreign-born population - Sweden (%)
Place of birth for the foreign-born population - United Kingdom (%)
Place of birth for the foreign-born population - England (%)
Place of birth for the foreign-born population - Scotland (%)
Place of birth for the foreign-born population - Other Northern Europe (%)
Place of birth for the foreign-born population - Austria (%)
Place of birth for the foreign-born population - Belgium (%)
Place of birth for the foreign-born population - France (%)
Place of birth for the foreign-born population - Germany (%)
Place of birth for the foreign-born population - Netherlands (%)
Place of birth for the foreign-born population - Switzerland (%)
Place of birth for the foreign-born population - Other Western Europe (%)
Place of birth for the foreign-born population - Greece (%)
Place of birth for the foreign-born population - Italy (%)
Place of birth for the foreign-born population - Portugal (%)
Place of birth for the foreign-born population - Spain (%)
Place of birth for the foreign-born population - Other Southern Europe (%)
Place of birth for the foreign-born population - Albania (%)
Place of birth for the foreign-born population - Belarus (%)
Place of birth for the foreign-born population - Bosnia and Herzegovina (%)
Place of birth for the foreign-born population - Bulgaria (%)
Place of birth for the foreign-born population - Croatia (%)
Place of birth for the foreign-born population - Czechoslovakia (%)
Place of birth for the foreign-born population - Hungary (%)
Place of birth for the foreign-born population - Latvia (%)
Place of birth for the foreign-born population - Lithuania (%)
Place of birth for the foreign-born population - North Macedonia (Macedonia) (%)
Place of birth for the foreign-born population - Moldova (%)
Place of birth for the foreign-born population - Poland (%)
Place of birth for the foreign-born population - Romania (%)
Place of birth for the foreign-born population - Russia (%)
Place of birth for the foreign-born population - Serbia (%)
Place of birth for the foreign-born population - Ukraine (%)
Place of birth for the foreign-born population - Other Eastern Europe (%)
Place of birth for the foreign-born population - China (%)
Place of birth for the foreign-born population - Hong Kong (%)
Place of birth for the foreign-born population - Taiwan (%)
Place of birth for the foreign-born population - Japan (%)
Place of birth for the foreign-born population - Korea (%)
Place of birth for the foreign-born population - Other Eastern Asia (%)
Place of birth for the foreign-born population - Afghanistan (%)
Place of birth for the foreign-born population - Bangladesh (%)
Place of birth for the foreign-born population - India (%)
Place of birth for the foreign-born population - Iran (%)
Place of birth for the foreign-born population - Kazakhstan (%)
Place of birth for the foreign-born population - Nepal (%)
Place of birth for the foreign-born population - Pakistan (%)
Place of birth for the foreign-born population - Sri Lanka (%)
Place of birth for the foreign-born population - Uzbekistan (%)
Place of birth for the foreign-born population - Other South Central Asia (%)
Place of birth for the foreign-born population - Burma (%)
Place of birth for the foreign-born population - Cambodia (%)
Place of birth for the foreign-born population - Indonesia (%)
Place of birth for the foreign-born population - Laos (%)
Place of birth for the foreign-born population - Malaysia (%)
Place of birth for the foreign-born population - Philippines (%)
Place of birth for the foreign-born population - Singapore (%)
Place of birth for the foreign-born population - Thailand (%)
Place of birth for the foreign-born population - Vietnam (%)
Place of birth for the foreign-born population - Other South Eastern Asia (%)
Place of birth for the foreign-born population - Armenia (%)
Place of birth for the foreign-born population - Iraq (%)
Place of birth for the foreign-born population - Israel (%)
Place of birth for the foreign-born population - Jordan (%)
Place of birth for the foreign-born population - Kuwait (%)
Place of birth for the foreign-born population - Lebanon (%)
Place of birth for the foreign-born population - Saudi Arabia (%)
Place of birth for the foreign-born population - Syria (%)
Place of birth for the foreign-born population - Turkey (%)
Place of birth for the foreign-born population - Yemen (%)
Place of birth for the foreign-born population - Other Western Asia (%)
Place of birth for the foreign-born population - Eritrea (%)
Place of birth for the foreign-born population - Ethiopia (%)
Place of birth for the foreign-born population - Kenya (%)
Place of birth for the foreign-born population - Somalia (%)
Place of birth for the foreign-born population - Uganda (%)
Place of birth for the foreign-born population - Zimbabwe (%)
Place of birth for the foreign-born population - Other Eastern Africa (%)
Place of birth for the foreign-born population - Cameroon (%)
Place of birth for the foreign-born population - Congo (%)
Place of birth for the foreign-born population - Democratic Republic of Congo (Zaire) (%)
Place of birth for the foreign-born population - Other Middle Africa (%)
Place of birth for the foreign-born population - Egypt (%)
Place of birth for the foreign-born population - Morocco (%)
Place of birth for the foreign-born population - Sudan (%)
Place of birth for the foreign-born population - Other Northern Africa (%)
Place of birth for the foreign-born population - South Africa (%)
Place of birth for the foreign-born population - Other Southern Africa (%)
Place of birth for the foreign-born population - Cabo Verde (%)
Place of birth for the foreign-born population - Ghana (%)
Place of birth for the foreign-born population - Liberia (%)
Place of birth for the foreign-born population - Nigeria (%)
Place of birth for the foreign-born population - Senegal (%)
Place of birth for the foreign-born population - Sierra Leone (%)
Place of birth for the foreign-born population - Other Western Africa (%)
Place of birth for the foreign-born population - Australia (%)
Place of birth for the foreign-born population - New Zealand (%)
Place of birth for the foreign-born population - Fiji (%)
Place of birth for the foreign-born population - Micronesia (%)
Place of birth for the foreign-born population - Bahamas (%)
Place of birth for the foreign-born population - Barbados (%)
Place of birth for the foreign-born population - Cuba (%)
Place of birth for the foreign-born population - Dominica (%)
Place of birth for the foreign-born population - Dominican Republic (%)
Place of birth for the foreign-born population - Grenada (%)
Place of birth for the foreign-born population - Haiti (%)
Place of birth for the foreign-born population - Jamaica (%)
Place of birth for the foreign-born population - St. Vincent and the Grenadines (%)
Place of birth for the foreign-born population - Trinidad and Tobago (%)
Place of birth for the foreign-born population - West Indies (%)
Place of birth for the foreign-born population - Other Caribbean (%)
Place of birth for the foreign-born population - Belize (%)
Place of birth for the foreign-born population - Costa Rica (%)
Place of birth for the foreign-born population - El Salvador (%)
Place of birth for the foreign-born population - Guatemala (%)
Place of birth for the foreign-born population - Honduras (%)
Place of birth for the foreign-born population - Mexico (%)
Place of birth for the foreign-born population - Nicaragua (%)
Place of birth for the foreign-born population - Panama (%)
Place of birth for the foreign-born population - Other Central America (%)
Place of birth for the foreign-born population - Argentina (%)
Place of birth for the foreign-born population - Bolivia (%)
Place of birth for the foreign-born population - Brazil (%)
Place of birth for the foreign-born population - Chile (%)
Place of birth for the foreign-born population - Colombia (%)
Place of birth for the foreign-born population - Ecuador (%)
Place of birth for the foreign-born population - Guyana (%)
Place of birth for the foreign-born population - Peru (%)
Place of birth for the foreign-born population - Uruguay (%)
Place of birth for the foreign-born population - Venezuela (%)
Place of birth for the foreign-born population - Other South America (%)
Place of birth for the foreign-born population - Canada (%)
Place of birth for the foreign-born population - Other Northern America (%)
Place of birth for the foreign-born population - Other (%)
Latest news about races in Elmhurst, IL collected exclusively by city-data.com from local newspapers, TV, and radio stations
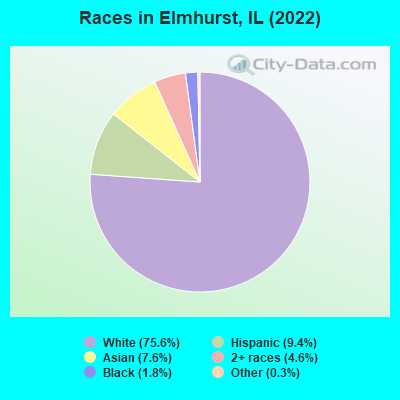
According to 2022 data, the most numerous races in Elmhurst, IL are White alone (34,139 residents), Hispanic (4,250 residents), and Black alone (835 residents). 83.8% of Elmhurst residents speak English at home. 10.6% of Elmhurst, IL residents are foreign-born (4.4% born in Asia, 3.4% born in Europe, 2.2% born in Latin America), which is 32.6% less than the foreign-born rate of 14.0% across the entire state of Illinois.
Race distribution in Elmhurst
2000 2022
8,424,140 67.8% White alone 1,856,152 14.9% Black alone 1,530,262 12.3% Hispanic 419,916 3.4% Asian alone 153,996 1.2% Two or more races 13,479 0.1% Other race alone 18,232 0.1% American Indian alone 3,116 0.03% Native Hawaiian and Other
7,356,301 58.5% White alone 2,299,726 18.3% Hispanic 1,660,423 13.2% Black alone 747,296 5.9% Asian alone 458,599 3.6% Two or more races 45,386 0.4% Other race alone 10,405 0.08% American Indian alone 3,896 0.03% Native Hawaiian and Other
Income and house value in Elmhurst Median household income in 2022 $141,509 White non-Hispanic householders$52,276 Black householders$140,693 Asian householders$145,530 Two or more races householders$133,727 Hispanic or Latino race householdersMedian 2022 house value $544,400 White Non-Hispanic householders$498,290 Black or African American householders$314,361 American Indian or Alaska Native householders $461,352 Asian householders$546,438 Some other race householdersover $1,000,000 Two or more races householders$495,998 Hispanic or Latino householders
Median age by race in Elmhurst
45.2 Median age for White residents44.5 45.9 29.6 Median age for Black or African American residents43.2 27.0 38.3 Median age for American Indian / Alaska Native residents-721,943,047.9 29.9 39.2 Median age for Asian residents37.0 42.2 -593,236,714.4 Median age for Native Hawaiian / Pacific Islander residents-658,536,584.7 -576,015,108.0 31.5 Median age for Other race residents37.6 30.3 20.1 Median age for Two or more races residents18.4 24.9 44.9 Median age for White alone residents44.7 45.8 33.8 Median age for Hispanic or Latino residents25.1 35.7
Owner/renter occupied households by race in Elmhurst
House owners and renters - White residents 11,507 83.9% Owner occupied2,207 16.1% Renter occupiedHouse owners and renters - Black or African American residents 56 14.1% Owner occupied340 85.9% Renter occupiedHouse owners and renters - American Indian / Alaska Native residents 12 100.0% Owner occupiedHouse owners and renters - Asian residents 1,031 87.2% Owner occupied151 12.8% Renter occupiedHouse owners and renters - Other race residents 150 76.0% Owner occupied47 24.0% Renter occupiedHouse owners and renters - Two or more races residents 798 73.6% Owner occupied286 26.4% Renter occupiedHouse owners and renters - White alone residents 11,360 83.5% Owner occupied2,249 16.5% Renter occupiedHouse owners and renters - Hispanic or Latino residents 879 74.6% Owner occupied299 25.4% Renter occupied
Language usage in Elmhurst
English speakers - Total 83.8% of residents of Elmhurst speak English at home.
5.4% of residents speak Spanish at home 1,659 72.6% Speak English very well627 27.4% Speak English less than very well10.5% of residents speak other language at home 3,557 80.2% Speak English very well877 19.8% Speak English less than very well
English speakers - Born in the United States 94.3% of residents of Elmhurst speak English at home.
2.0% of residents speak Spanish at home 129 73.7% Speak English very well46 26.3% Speak English less than very well3.9% of residents speak other language at home 313 90.2% Speak English very well34 9.8% Speak English less than very well
English speakers - Native, born elsewhere 76.8% of residents of Elmhurst speak English at home.
10.6% of residents speak Spanish at home 37 100.0% Speak English very well12.6% of residents speak other language at home 44 100.0% Speak English very well
English speakers - Foreign-born 17.7% of residents of Elmhurst speak English at home.
17.3% of residents speak Spanish at home 497 61.0% Speak English very well318 39.0% Speak English less than very well63.1% of residents speak other language at home 2,153 72.5% Speak English very well818 27.5% Speak English less than very well
White (Caucasian) - Speak only English Native:
97.2% (29,475)Foreign-born:
27.1% (509)
White (Caucasian) - Speak another language Native:
3.6% (1,099)Foreign-born:
74.2% (1,393)
Asian - Speak only English Native:
76.0% (1,070)Foreign-born:
14.1% (273)
Asian - Speak another language Native:
27.7% (389)Foreign-born:
85.1% (1,654)
Other race - Speak only English Native:
51.9% (326)Foreign-born:
1.9% (4)
Other race - Speak another language Native:
52.6% (331)Foreign-born:
99.0% (181)
Two or more races - Speak only English Native:
69.5% (2,590)Foreign-born:
10.6% (56)
Two or more races - Speak another language Native:
29.7% (1,109)Foreign-born:
89.4% (471)
White alone - Speak only English Native:
96.5% (29,317)Foreign-born:
27.9% (520)
White alone - Speak another language Native:
3.5% (1,078)Foreign-born:
72.5% (1,351)
Hispanic or Latino - Speak only English Native:
54.1% (1,633)Foreign-born:
7.9% (70)
Hispanic or Latino - Speak another language Native:
45.3% (1,369)Foreign-born:
92.0% (824)
Foreign-born residents in Elmhurst 4,770 residents are foreign born (4.4% Asia , 3.4% Europe , 2.2% Latin America ).
This city:
10.6%Illinois:
14.1%
Marital status for residents in Elmhurst Marital status - White (Caucasian) population 15 years and over
Males 25.8% Never married64.2% Now married0.4% Separated3.6% Widowed6.0% DivorcedFemales 23.7% Never married58.0% Now married0.3% Separated9.7% Widowed8.2% DivorcedWomen who gave birth in the past 12 months Now married:
95.2% (318)Unmarried:
4.8% (16)
Women who did not give birth in the past 12 months Now married:
50.9% (3,278)Unmarried:
49.1% (3,156)
Marital status - Black or African American population 15 years and over
Males 36.5% Never married57.4% Now married4.3% Separated1.7% Widowed0.0% DivorcedFemales 66.3% Never married5.4% Now married9.0% Separated12.7% Widowed6.7% DivorcedWomen who gave birth in the past 12 months Now married:
100.0% (20)Unmarried:
0.0% (0)
Women who did not give birth in the past 12 months Now married:
11.3% (56)Unmarried:
88.7% (441)
Marital status - American Indian / Alaska Native population 15 years and over
Males 0.0% Never married100.0% Now married0.0% Separated0.0% Widowed0.0% DivorcedFemales 0.0% Never married64.9% Now married0.0% Separated32.4% Widowed2.7% DivorcedWomen who did not give birth in the past 12 months Now married:
100.0% (40)Unmarried:
0.0% (0)
Marital status - Asian population 15 years and over
Males 30.7% Never married68.2% Now married0.0% Separated0.8% Widowed0.4% DivorcedFemales 27.1% Never married63.6% Now married0.0% Separated4.5% Widowed4.8% DivorcedWomen who gave birth in the past 12 months Now married:
100.0% (47)Unmarried:
0.0% (0)
Women who did not give birth in the past 12 months Now married:
56.5% (536)Unmarried:
43.5% (414)
Marital status - Other race population 15 years and over
Males 31.5% Never married68.5% Now married0.0% Separated0.0% Widowed0.0% DivorcedFemales 55.4% Never married36.5% Now married5.2% Separated1.7% Widowed1.3% DivorcedWomen who gave birth in the past 12 months Now married:
100.0% (15)Unmarried:
0.0% (0)
Women who did not give birth in the past 12 months Now married:
18.9% (42)Unmarried:
81.1% (180)
Marital status - Two or more races population 15 years and over
Males 53.2% Never married45.7% Now married0.0% Separated1.1% Widowed0.0% DivorcedFemales 31.2% Never married51.2% Now married0.0% Separated11.3% Widowed6.3% DivorcedWomen who gave birth in the past 12 months Now married:
81.1% (43)Unmarried:
18.9% (10)
Women who did not give birth in the past 12 months Now married:
49.3% (449)Unmarried:
50.7% (461)
Marital status - White alone, not Hispanic / Latino population 15 years and over
Males 25.2% Never married64.8% Now married0.4% Separated3.6% Widowed6.0% DivorcedFemales 22.8% Never married58.5% Now married0.3% Separated9.9% Widowed8.4% DivorcedWomen who gave birth in the past 12 months Now married:
94.9% (316)Unmarried:
5.1% (17)
Women who did not give birth in the past 12 months Now married:
51.7% (3,317)Unmarried:
48.3% (3,095)
Marital status - Hispanic or Latino population 15 years and over
Males 47.2% Never married48.4% Now married0.0% Separated1.4% Widowed3.1% DivorcedFemales 39.9% Never married48.8% Now married0.7% Separated7.6% Widowed3.0% DivorcedWomen who gave birth in the past 12 months Now married:
100.0% (61)Unmarried:
0.0% (0)
Women who did not give birth in the past 12 months Now married:
40.5% (461)Unmarried:
59.5% (677)
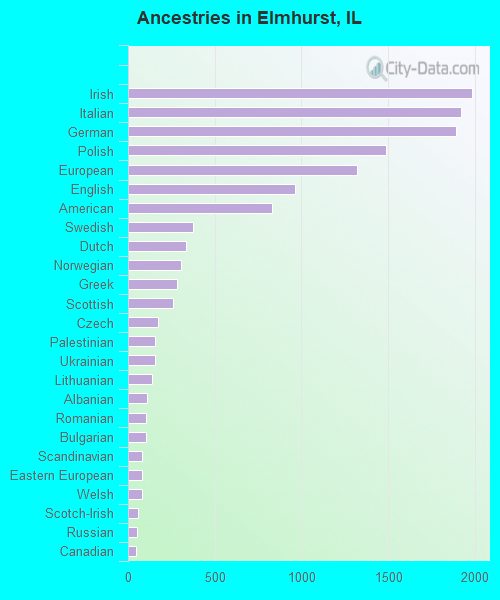
Ancestries in Elmhurst
1,983 10.3% Irish1,920 10.0% Italian1,894 9.9% German1,490 7.8% Polish1,323 6.9% European962 5.0% English831 4.3% American374 1.9% Swedish334 1.7% Dutch304 1.6% Norwegian281 1.5% Greek260 1.4% Scottish172 0.9% Czech158 0.8% Palestinian156 0.8% Ukrainian140 0.7% Lithuanian110 0.6% Albanian106 0.6% Romanian103 0.5% Bulgarian82 0.4% Scandinavian81 0.4% Eastern European78 0.4% Welsh56 0.3% Scotch-Irish54 0.3% Russian44 0.2% Canadian41 0.2% Iranian38 0.2% Hungarian30 0.2% Brazilian29 0.2% West Indian28 0.1% Latvian27 0.1% Finnish24 0.1% Slovak23 0.1% Czechoslovakian22 0.1% Croatian20 0.1% French20 0.1% Belgian19 0.10% Austrian18 0.09% Lebanese16 0.08% Slovene15 0.08% Egyptian15 0.08% Armenian13 0.07% Danish12 0.06% British11 0.06% Moroccan11 0.06% Portuguese10 0.05% Northern European9 0.05% Jordanian9 0.05% French Canadian9 0.05% Estonian9 0.05% Carpatho Rusyn8 0.04% Serbian6 0.03% Ethiopian6 0.03% Nigerian6 0.03% Assyrian5 0.03% Turkish5 0.03% Yugoslavian
Geographical mobility in Elmhurst Same house 1 year ago 30,670 91.2% White (Caucasian)703 84.5% Black or African American115 99.7% American Indian / Alaska Native3,044 88.5% Asian816 97.4% Other race4,696 95.1% Two or more races30,985 91.5% White alone, not Hispanic / Latino3,767 90.2% Hispanic or LatinoMoved within same county 1,271 3.8% White / Caucasian76 9.1% Black or African American92 2.7% Asian6 0.7% Other race23 0.5% Two or more races1,161 3.4% White alone, not Hispanic / Latino187 4.5% Hispanic or LatinoMoved within same state 1,148 3.4% White / Caucasian61 7.3% Black or African American211 6.1% Asian4 0.4% Other race163 3.3% Two or more races1,147 3.4% White alone, not Hispanic / Latino134 3.2% Hispanic or LatinoMoved from different state 451 1.3% White / Caucasian3 0.4% Black or African American42 1.2% Asian63 1.3% Two or more races468 1.4% White alone, not Hispanic / Latino26 0.6% Hispanic or LatinoMoved from abroad 80 0.2% White61 1.8% Asian13 0.3% Two or more races86 0.3% White alone, not Hispanic / Latino
Children Nativity (place of birth) in Elmhurst
Children under 6 years - Living with two parents Both parents native 2,607 99.7% Native9 0.3% Foreign-bornBoth parents foreign-born 76 83.5% Native15 16.5% Foreign-bornOne native, one foreign-born parent 403 100.0% NativeChildren under 6 years - Living with one parent Native parent 190 100.0% NativeForeign-born parent 9 100.0% NativeChildren 6 to 17 years - Living with two parents Both parents native 4,727 99.1% Native42 0.9% Foreign-bornBoth parents foreign-born 516 83.3% Native104 16.7% Foreign-bornOne native, one foreign-born parent 970 100.0% NativeChildren 6 to 17 years - Living with one parent Native parent 972 100.0% NativeForeign-born parent 125 53.1% Native110 46.9% Foreign-born