Races in Ellensburg, Washington (WA) Detailed Stats
Data:
Races - White alone (%)
Races - White alone (% change since 2000)
Races - Black alone (%)
Races - Black alone (% change since 2000)
Races - American Indian alone (%)
Races - American Indian alone (% change since 2000)
Races - Asian alone (%)
Races - Asian alone (% change since 2000)
Races - Hispanic (%)
Races - Hispanic (% change since 2000)
Races - Native Hawaiian and Other Pacific Islander alone (%)
Races - Native Hawaiian and Other Pacific Islander alone (% change since 2000)
Races - Two or more races(%)
Races - Two or more races(% change since 2000)
Races - Other race alone (%)
Races - Other race alone (% change since 2000)
Racial diversity
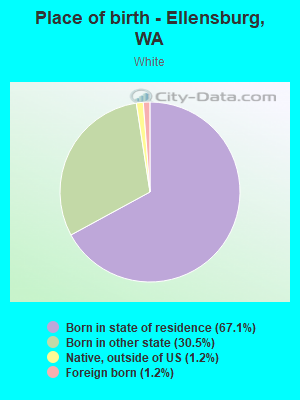
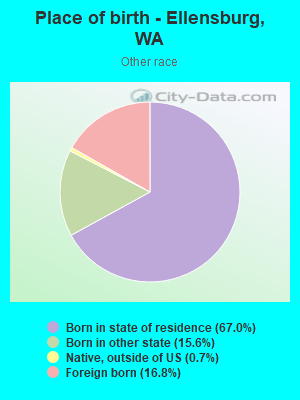
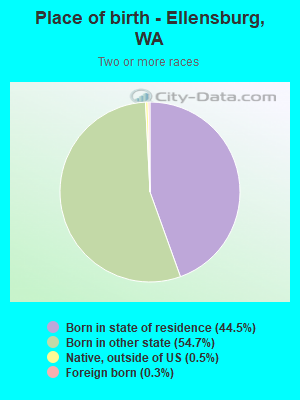
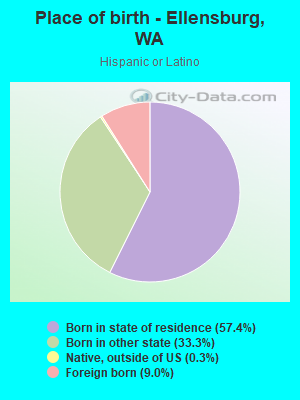
Place of birth - Born in state of residence (%)
Place of birth - Born in state of residence (%) - White
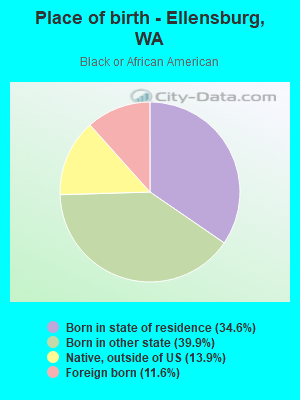
Place of birth - Born in state of residence (%) - Black or African American
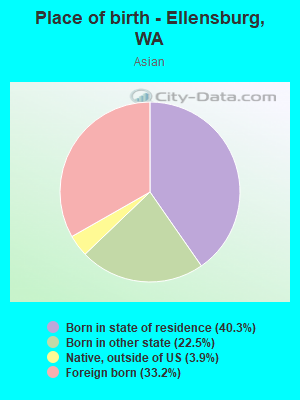
Place of birth - Born in state of residence (%) - Asian
Place of birth - Born in state of residence (%) - Hispanic or Latino
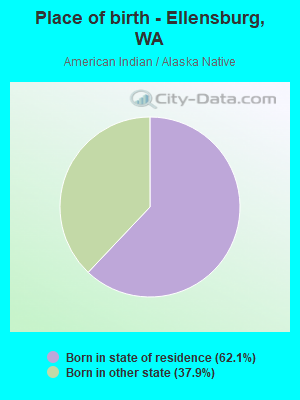
Place of birth - Born in state of residence (%) - American Indian and Alaska Native
Place of birth - Born in state of residence (%) - Multirace
Place of birth - Born in state of residence (%) - Other Race
Place of birth - Born in other state (%)
Place of birth - Born in other state (%) - White
Place of birth - Born in other state (%) - Black or African American
Place of birth - Born in other state (%) - Asian
Place of birth - Born in other state (%) - Hispanic or Latino
Place of birth - Born in other state (%) - American Indian and Alaska Native
Place of birth - Born in other state (%) - Multirace
Place of birth - Born in other state (%) - Other Race
Place of birth - Native, outside of US (%)
Place of birth - Native, outside of US (%) - White
Place of birth - Native, outside of US (%) - Black or African American
Place of birth - Native, outside of US (%) - Asian
Place of birth - Native, outside of US (%) - Hispanic or Latino
Place of birth - Native, outside of US (%) - American Indian and Alaska Native
Place of birth - Native, outside of US (%) - Multirace
Place of birth - Native, outside of US (%) - Other Race
Place of birth - Foreign born (%)
Place of birth - Foreign born (%) - White
Place of birth - Foreign born (%) - Black or African American
Place of birth - Foreign born (%) - Asian
Place of birth - Foreign born (%) - Hispanic or Latino
Place of birth - Foreign born (%) - American Indian and Alaska Native
Place of birth - Foreign born (%) - Multirace
Place of birth - Foreign born (%) - Other Race
Residents speaking English at home (%)
Residents speaking English at home - Born in the United States (%)
Residents speaking English at home - Native, born elsewhere (%)
Residents speaking English at home - Foreign born (%)
Residents speaking Spanish at home (%)
Residents speaking Spanish at home - Born in the United States (%)
Residents speaking Spanish at home - Native, born elsewhere (%)
Residents speaking Spanish at home - Foreign born (%)
Residents speaking other language at home (%)
Residents speaking other language at home - Born in the United States (%)
Residents speaking other language at home - Native, born elsewhere (%)
Residents speaking other language at home - Foreign born (%)
Marital status - Never married (%)
Marital status - Now married (%)
Marital status - Separated (%)
Marital status - Widowed (%)
Marital status - Divorced (%)
Ancestries Reported - Arab (%)
Ancestries Reported - Czech (%)
Ancestries Reported - Danish (%)
Ancestries Reported - Dutch (%)
Ancestries Reported - English (%)
Ancestries Reported - French (%)
Ancestries Reported - French Canadian (%)
Ancestries Reported - German (%)
Ancestries Reported - Greek (%)
Ancestries Reported - Hungarian (%)
Ancestries Reported - Irish (%)
Ancestries Reported - Italian (%)
Ancestries Reported - Lithuanian (%)
Ancestries Reported - Norwegian (%)
Ancestries Reported - Polish (%)
Ancestries Reported - Portuguese (%)
Ancestries Reported - Russian (%)
Ancestries Reported - Scotch-Irish (%)
Ancestries Reported - Scottish (%)
Ancestries Reported - Slovak (%)
Ancestries Reported - Subsaharan African (%)
Ancestries Reported - Swedish (%)
Ancestries Reported - Swiss (%)
Ancestries Reported - Ukrainian (%)
Ancestries Reported - United States (%)
Ancestries Reported - Welsh (%)
Ancestries Reported - West Indian (%)
Ancestries Reported - Other (%)
Geographical mobility - Same house 1 year ago (%)
Geographical mobility - Same house 1 year ago (%) - White
Geographical mobility - Same house 1 year ago (%) - Black or African American
Geographical mobility - Same house 1 year ago (%) - Asian
Geographical mobility - Same house 1 year ago (%) - Hispanic or Latino
Geographical mobility - Same house 1 year ago (%) - American Indian and Alaska Native
Geographical mobility - Same house 1 year ago (%) - Multirace
Geographical mobility - Same house 1 year ago (%) - Other Race
Geographical mobility - Moved within same county (%)
Geographical mobility - Moved within same county (%) - White
Geographical mobility - Moved within same county (%) - Black or African American
Geographical mobility - Moved within same county (%) - Asian
Geographical mobility - Moved within same county (%) - Hispanic or Latino
Geographical mobility - Moved within same county (%) - American Indian and Alaska Native
Geographical mobility - Moved within same county (%) - Multirace
Geographical mobility - Moved within same county (%) - Other Race
Geographical mobility - Moved from different county within same state (%)
Geographical mobility - Moved from different county within same state (%) - White
Geographical mobility - Moved from different county within same state (%) - Black or African American
Geographical mobility - Moved from different county within same state (%) - Asian
Geographical mobility - Moved from different county within same state (%) - Hispanic or Latino
Geographical mobility - Moved from different county within same state (%) - American Indian and Alaska Native
Geographical mobility - Moved from different county within same state (%) - Multirace
Geographical mobility - Moved from different county within same state (%) - Other Race
Geographical mobility - Moved from different state (%)
Geographical mobility - Moved from different state (%) - White
Geographical mobility - Moved from different state (%) - Black or African American
Geographical mobility - Moved from different state (%) - Asian
Geographical mobility - Moved from different state (%) - Hispanic or Latino
Geographical mobility - Moved from different state (%) - American Indian and Alaska Native
Geographical mobility - Moved from different state (%) - Multirace
Geographical mobility - Moved from different state (%) - Other Race
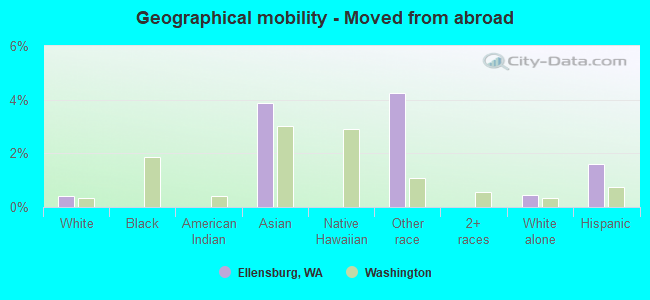
Geographical mobility - Moved from abroad (%)
Geographical mobility - Moved from abroad (%) - White
Geographical mobility - Moved from abroad (%) - Black or African American
Geographical mobility - Moved from abroad (%) - Asian
Geographical mobility - Moved from abroad (%) - Hispanic or Latino
Geographical mobility - Moved from abroad (%) - American Indian and Alaska Native
Geographical mobility - Moved from abroad (%) - Multirace
Geographical mobility - Moved from abroad (%) - Other Race
Place of birth for the foreign-born population - Ireland (%)
Place of birth for the foreign-born population - Denmark (%)
Place of birth for the foreign-born population - Norway (%)
Place of birth for the foreign-born population - Sweden (%)
Place of birth for the foreign-born population - United Kingdom (%)
Place of birth for the foreign-born population - England (%)
Place of birth for the foreign-born population - Scotland (%)
Place of birth for the foreign-born population - Other Northern Europe (%)
Place of birth for the foreign-born population - Austria (%)
Place of birth for the foreign-born population - Belgium (%)
Place of birth for the foreign-born population - France (%)
Place of birth for the foreign-born population - Germany (%)
Place of birth for the foreign-born population - Netherlands (%)
Place of birth for the foreign-born population - Switzerland (%)
Place of birth for the foreign-born population - Other Western Europe (%)
Place of birth for the foreign-born population - Greece (%)
Place of birth for the foreign-born population - Italy (%)
Place of birth for the foreign-born population - Portugal (%)
Place of birth for the foreign-born population - Spain (%)
Place of birth for the foreign-born population - Other Southern Europe (%)
Place of birth for the foreign-born population - Albania (%)
Place of birth for the foreign-born population - Belarus (%)
Place of birth for the foreign-born population - Bosnia and Herzegovina (%)
Place of birth for the foreign-born population - Bulgaria (%)
Place of birth for the foreign-born population - Croatia (%)
Place of birth for the foreign-born population - Czechoslovakia (%)
Place of birth for the foreign-born population - Hungary (%)
Place of birth for the foreign-born population - Latvia (%)
Place of birth for the foreign-born population - Lithuania (%)
Place of birth for the foreign-born population - North Macedonia (Macedonia) (%)
Place of birth for the foreign-born population - Moldova (%)
Place of birth for the foreign-born population - Poland (%)
Place of birth for the foreign-born population - Romania (%)
Place of birth for the foreign-born population - Russia (%)
Place of birth for the foreign-born population - Serbia (%)
Place of birth for the foreign-born population - Ukraine (%)
Place of birth for the foreign-born population - Other Eastern Europe (%)
Place of birth for the foreign-born population - China (%)
Place of birth for the foreign-born population - Hong Kong (%)
Place of birth for the foreign-born population - Taiwan (%)
Place of birth for the foreign-born population - Japan (%)
Place of birth for the foreign-born population - Korea (%)
Place of birth for the foreign-born population - Other Eastern Asia (%)
Place of birth for the foreign-born population - Afghanistan (%)
Place of birth for the foreign-born population - Bangladesh (%)
Place of birth for the foreign-born population - India (%)
Place of birth for the foreign-born population - Iran (%)
Place of birth for the foreign-born population - Kazakhstan (%)
Place of birth for the foreign-born population - Nepal (%)
Place of birth for the foreign-born population - Pakistan (%)
Place of birth for the foreign-born population - Sri Lanka (%)
Place of birth for the foreign-born population - Uzbekistan (%)
Place of birth for the foreign-born population - Other South Central Asia (%)
Place of birth for the foreign-born population - Burma (%)
Place of birth for the foreign-born population - Cambodia (%)
Place of birth for the foreign-born population - Indonesia (%)
Place of birth for the foreign-born population - Laos (%)
Place of birth for the foreign-born population - Malaysia (%)
Place of birth for the foreign-born population - Philippines (%)
Place of birth for the foreign-born population - Singapore (%)
Place of birth for the foreign-born population - Thailand (%)
Place of birth for the foreign-born population - Vietnam (%)
Place of birth for the foreign-born population - Other South Eastern Asia (%)
Place of birth for the foreign-born population - Armenia (%)
Place of birth for the foreign-born population - Iraq (%)
Place of birth for the foreign-born population - Israel (%)
Place of birth for the foreign-born population - Jordan (%)
Place of birth for the foreign-born population - Kuwait (%)
Place of birth for the foreign-born population - Lebanon (%)
Place of birth for the foreign-born population - Saudi Arabia (%)
Place of birth for the foreign-born population - Syria (%)
Place of birth for the foreign-born population - Turkey (%)
Place of birth for the foreign-born population - Yemen (%)
Place of birth for the foreign-born population - Other Western Asia (%)
Place of birth for the foreign-born population - Eritrea (%)
Place of birth for the foreign-born population - Ethiopia (%)
Place of birth for the foreign-born population - Kenya (%)
Place of birth for the foreign-born population - Somalia (%)
Place of birth for the foreign-born population - Uganda (%)
Place of birth for the foreign-born population - Zimbabwe (%)
Place of birth for the foreign-born population - Other Eastern Africa (%)
Place of birth for the foreign-born population - Cameroon (%)
Place of birth for the foreign-born population - Congo (%)
Place of birth for the foreign-born population - Democratic Republic of Congo (Zaire) (%)
Place of birth for the foreign-born population - Other Middle Africa (%)
Place of birth for the foreign-born population - Egypt (%)
Place of birth for the foreign-born population - Morocco (%)
Place of birth for the foreign-born population - Sudan (%)
Place of birth for the foreign-born population - Other Northern Africa (%)
Place of birth for the foreign-born population - South Africa (%)
Place of birth for the foreign-born population - Other Southern Africa (%)
Place of birth for the foreign-born population - Cabo Verde (%)
Place of birth for the foreign-born population - Ghana (%)
Place of birth for the foreign-born population - Liberia (%)
Place of birth for the foreign-born population - Nigeria (%)
Place of birth for the foreign-born population - Senegal (%)
Place of birth for the foreign-born population - Sierra Leone (%)
Place of birth for the foreign-born population - Other Western Africa (%)
Place of birth for the foreign-born population - Australia (%)
Place of birth for the foreign-born population - New Zealand (%)
Place of birth for the foreign-born population - Fiji (%)
Place of birth for the foreign-born population - Micronesia (%)
Place of birth for the foreign-born population - Bahamas (%)
Place of birth for the foreign-born population - Barbados (%)
Place of birth for the foreign-born population - Cuba (%)
Place of birth for the foreign-born population - Dominica (%)
Place of birth for the foreign-born population - Dominican Republic (%)
Place of birth for the foreign-born population - Grenada (%)
Place of birth for the foreign-born population - Haiti (%)
Place of birth for the foreign-born population - Jamaica (%)
Place of birth for the foreign-born population - St. Vincent and the Grenadines (%)
Place of birth for the foreign-born population - Trinidad and Tobago (%)
Place of birth for the foreign-born population - West Indies (%)
Place of birth for the foreign-born population - Other Caribbean (%)
Place of birth for the foreign-born population - Belize (%)
Place of birth for the foreign-born population - Costa Rica (%)
Place of birth for the foreign-born population - El Salvador (%)
Place of birth for the foreign-born population - Guatemala (%)
Place of birth for the foreign-born population - Honduras (%)
Place of birth for the foreign-born population - Mexico (%)
Place of birth for the foreign-born population - Nicaragua (%)
Place of birth for the foreign-born population - Panama (%)
Place of birth for the foreign-born population - Other Central America (%)
Place of birth for the foreign-born population - Argentina (%)
Place of birth for the foreign-born population - Bolivia (%)
Place of birth for the foreign-born population - Brazil (%)
Place of birth for the foreign-born population - Chile (%)
Place of birth for the foreign-born population - Colombia (%)
Place of birth for the foreign-born population - Ecuador (%)
Place of birth for the foreign-born population - Guyana (%)
Place of birth for the foreign-born population - Peru (%)
Place of birth for the foreign-born population - Uruguay (%)
Place of birth for the foreign-born population - Venezuela (%)
Place of birth for the foreign-born population - Other South America (%)
Place of birth for the foreign-born population - Canada (%)
Place of birth for the foreign-born population - Other Northern America (%)
Place of birth for the foreign-born population - Other (%)
Latest news about races in Ellensburg, WA collected exclusively by city-data.com from local newspapers, TV, and radio stations
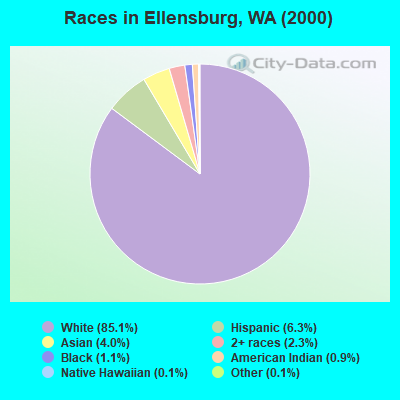
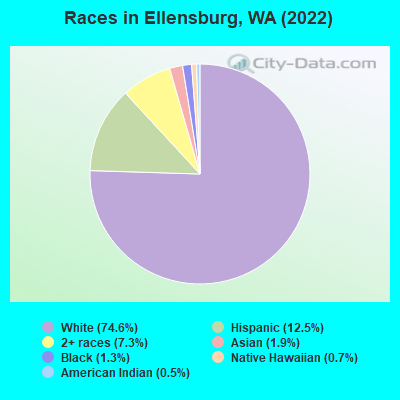
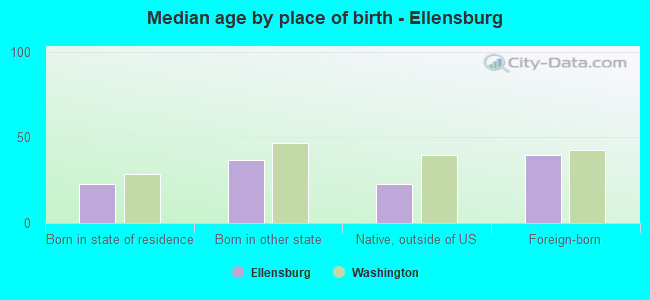
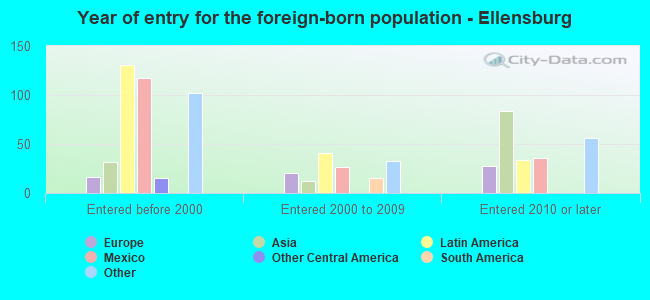
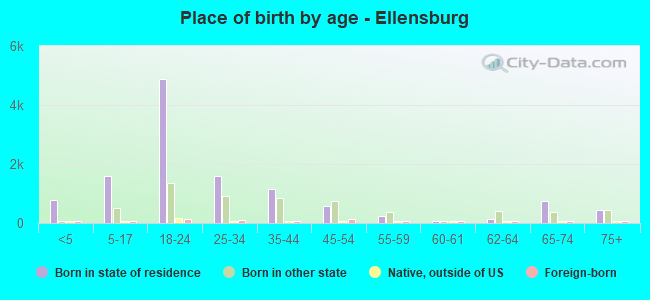
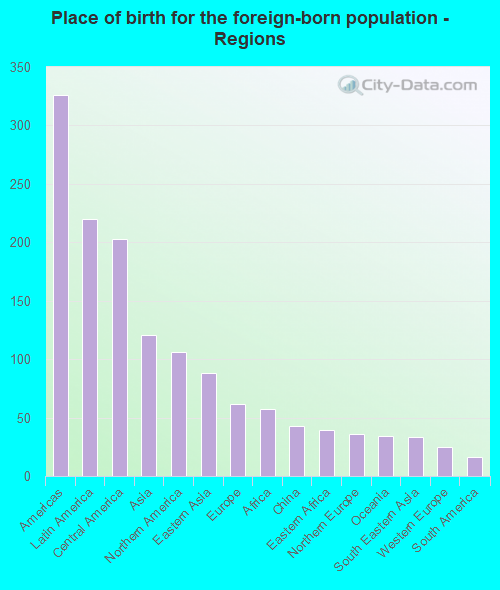
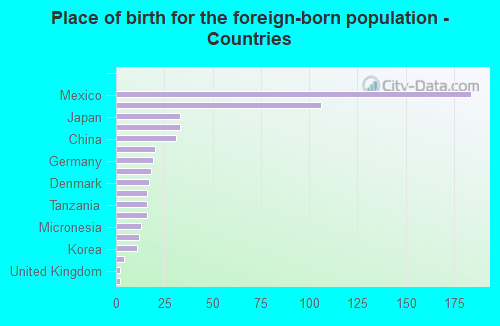
According to 2022 data, the most numerous races in Ellensburg, WA are White alone (14,360 residents), Hispanic (2,405 residents), and Asian alone (374 residents). 91.4% of Ellensburg residents speak English at home. 3.1% of Ellensburg, WA residents are foreign-born (1.1% born in Latin America, 0.6% born in Asia, 0.5% born in North America), which is 380.3% less than the foreign-born rate of 15.0% across the entire state of Washington.
Race distribution in Ellensburg
2000 2022
4,652,490 78.9% White alone 441,509 7.5% Hispanic 319,401 5.4% Asian alone 184,631 3.1% Black alone 175,926 3.0% Two or more races 85,396 1.4% American Indian alone 22,779 0.4% Native Hawaiian and Other 11,989 0.2% Other race alone
4,941,456 63.5% White alone 1,093,313 14.0% Hispanic 755,832 9.7% Asian alone 523,448 6.7% Two or more races 299,537 3.8% Black alone 69,024 0.9% American Indian alone 52,231 0.7% Native Hawaiian and Other 50,945 0.7% Other race alone
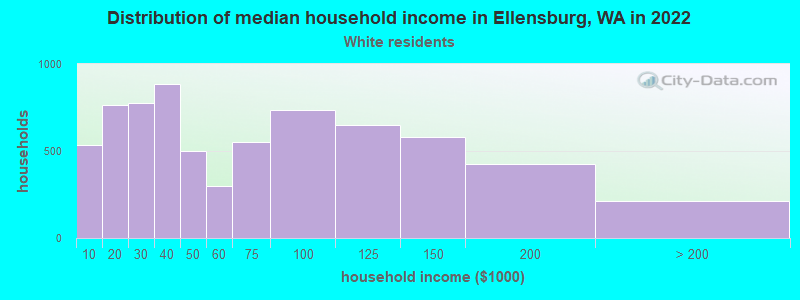
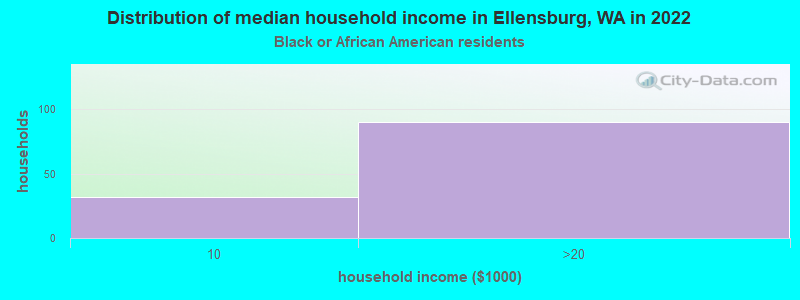
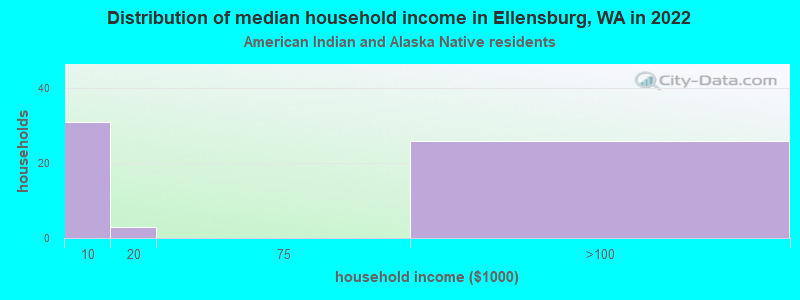
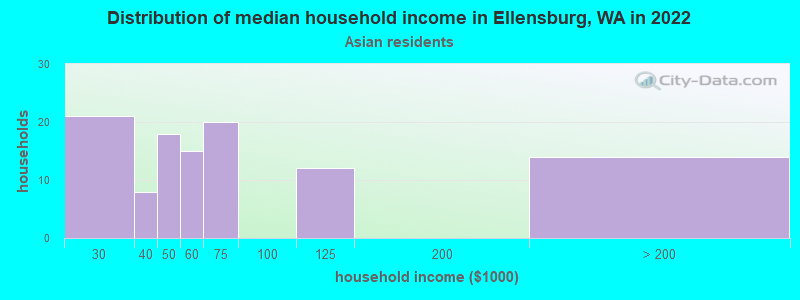
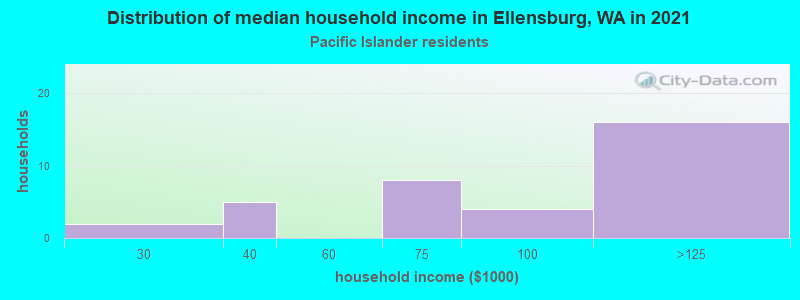
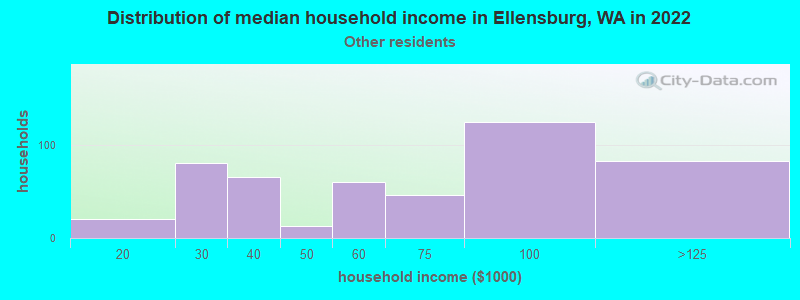
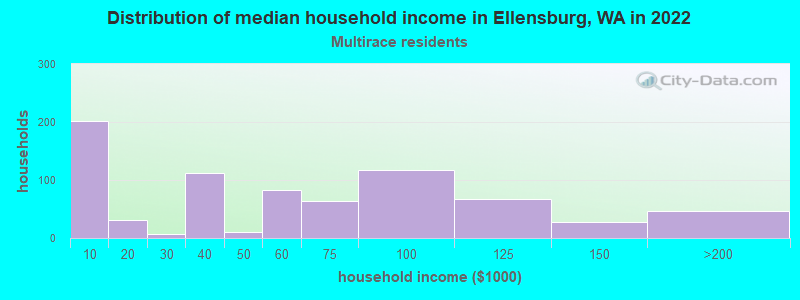
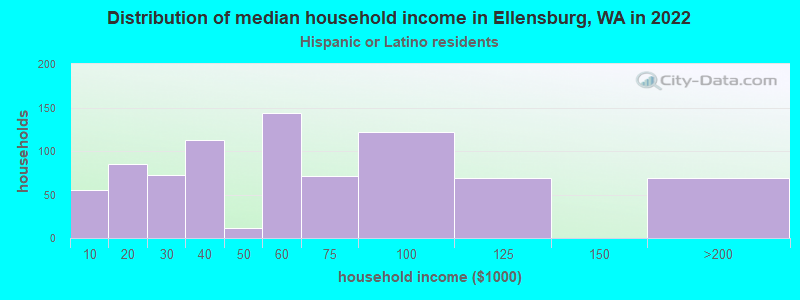
Income and house value in Ellensburg Median household income in 2022 $51,765 White non-Hispanic householders$13,481 Black householders$58,906 Asian householders$101,578 Native Hawaiian and other Pacific Islander householders$62,909 Some other race householders$60,554 Two or more races householders$62,136 Hispanic or Latino race householdersMedian 2022 house value $427,629 White Non-Hispanic householders$612,244 Black or African American householders$518,053 American Indian or Alaska Native householders $423,861 Asian householders$386,185 Some other race householders$410,298 Two or more races householders$365,086 Hispanic or Latino householders
Median age by race in Ellensburg
27.5 Median age for White residents25.8 29.1 21.1 Median age for Black or African American residents21.4 20.9 26.7 Median age for American Indian / Alaska Native residents46.2 26.0 21.6 Median age for Asian residents20.6 22.4 21.3 Median age for Native Hawaiian / Pacific Islander residents19.1 25.8 22.9 Median age for Other race residents29.0 22.5 22.6 Median age for Two or more races residents23.9 21.9 27.4 Median age for White alone residents25.5 28.8 21.2 Median age for Hispanic or Latino residents21.3 21.2
Owner/renter occupied households by race in Ellensburg
House owners and renters - White residents 2,855 41.6% Owner occupied4,016 58.4% Renter occupiedHouse owners and renters - Black or African American residents 128 100.0% Renter occupiedHouse owners and renters - American Indian / Alaska Native residents 18 28.0% Owner occupied46 72.0% Renter occupiedHouse owners and renters - Asian residents 21 20.3% Owner occupied84 79.7% Renter occupiedHouse owners and renters - Native Hawaiian / Pacific Islander residents 58 100.0% Renter occupiedHouse owners and renters - Other race residents 149 29.8% Owner occupied352 70.2% Renter occupiedHouse owners and renters - Two or more races residents 177 24.5% Owner occupied546 75.5% Renter occupiedHouse owners and renters - White alone residents 2,764 40.8% Owner occupied4,014 59.2% Renter occupiedHouse owners and renters - Hispanic or Latino residents 279 34.1% Owner occupied540 65.9% Renter occupied
Language usage in Ellensburg
English speakers - Total 91.4% of residents of Ellensburg speak English at home.
5.6% of residents speak Spanish at home 892 86.6% Speak English very well138 13.4% Speak English less than very well2.5% of residents speak other language at home 428 92.8% Speak English very well33 7.2% Speak English less than very well
English speakers - Born in the United States 97.8% of residents of Ellensburg speak English at home.
1.4% of residents speak Spanish at home 84 100.0% Speak English very well0.4% of residents speak other language at home 15 55.6% Speak English very well12 44.4% Speak English less than very well
English speakers - Native, born elsewhere 66.8% of residents of Ellensburg speak English at home.
2.3% of residents speak Spanish at home 7 100.0% Speak English very well31.9% of residents speak other language at home 96 100.0% Speak English very well
English speakers - Foreign-born 38.3% of residents of Ellensburg speak English at home.
34.9% of residents speak Spanish at home 147 70.0% Speak English very well63 30.0% Speak English less than very well26.3% of residents speak other language at home 138 87.3% Speak English very well20 12.7% Speak English less than very well
White (Caucasian) - Speak only English Native:
98.8% (13,614)Foreign-born:
87.5% (150)
White (Caucasian) - Speak another language Native:
1.7% (228)Foreign-born:
18.8% (32)
Black or African American - Speak another language Native:
13.2% (35)Foreign-born:
97.1% (33)
Asian - Speak only English Native:
52.8% (126)Foreign-born:
34.2% (43)
Asian - Speak another language Native:
47.5% (113)Foreign-born:
67.0% (84)
Native Hawaiian / Pacific Islander - Speak only English Native:
48.1% (51)Foreign-born:
69.6% (22)
Native Hawaiian / Pacific Islander - Speak another language Native:
57.5% (61)Foreign-born:
37.8% (12)
Other race - Speak another language Native:
56.0% (570)Foreign-born:
100.0% (202)
Two or more races - Speak another language Native:
5.5% (126)Foreign-born:
100.0% (8)
White alone - Speak only English Native:
98.2% (13,376)Foreign-born:
81.0% (146)
White alone - Speak another language Native:
1.8% (240)Foreign-born:
14.1% (26)
Hispanic or Latino - Speak only English Native:
70.0% (1,423)Foreign-born:
4.1% (9)
Hispanic or Latino - Speak another language Native:
31.3% (636)Foreign-born:
96.0% (208)
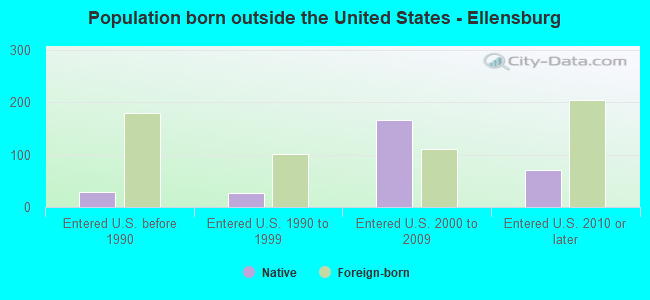
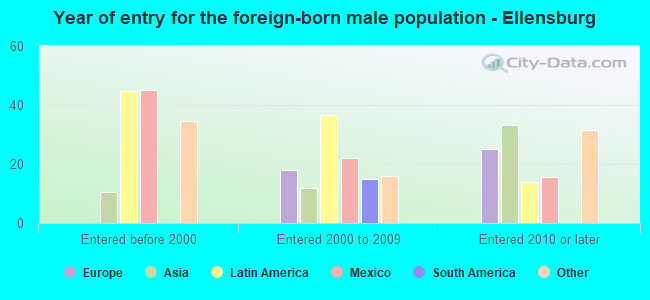
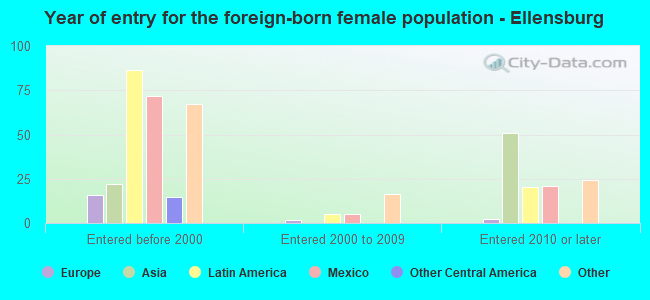
Foreign-born residents in Ellensburg 601 residents are foreign born (1.1% Latin America , 0.6% Asia , 0.5% North America ).
This city:
3.1%Washington:
14.9%
Marital status for residents in Ellensburg Marital status - White (Caucasian) population 15 years and over
Males 55.8% Never married30.0% Now married1.2% Separated3.1% Widowed9.8% DivorcedFemales 48.4% Never married26.5% Now married1.1% Separated6.4% Widowed17.6% DivorcedWomen who gave birth in the past 12 months Now married:
100.0% (81)Unmarried:
0.0% (0)
Women who did not give birth in the past 12 months Now married:
23.6% (1,027)Unmarried:
76.4% (3,325)
Marital status - Black or African American population 15 years and over
Males 100.0% Never married0.0% Now married0.0% Separated0.0% Widowed0.0% DivorcedFemales 100.0% Never married0.0% Now married0.0% Separated0.0% Widowed0.0% DivorcedWomen who did not give birth in the past 12 months Now married:
0.0% (0)Unmarried:
100.0% (130)
Marital status - American Indian / Alaska Native population 15 years and over
Males 67.3% Never married0.0% Now married0.0% Separated0.0% Widowed32.7% DivorcedFemales 47.8% Never married0.0% Now married0.0% Separated0.0% Widowed52.2% DivorcedWomen who did not give birth in the past 12 months Now married:
0.0% (0)Unmarried:
100.0% (51)
Marital status - Asian population 15 years and over
Males 83.8% Never married16.2% Now married0.0% Separated0.0% Widowed0.0% DivorcedFemales 57.5% Never married20.0% Now married11.2% Separated4.4% Widowed6.9% DivorcedWomen who did not give birth in the past 12 months Now married:
24.0% (32)Unmarried:
76.0% (100)
Marital status - Native Hawaiian / Pacific Islander population 15 years and over
Males 42.9% Never married57.1% Now married0.0% Separated0.0% Widowed0.0% DivorcedFemales 57.0% Never married32.6% Now married0.0% Separated0.0% Widowed10.5% DivorcedWomen who did not give birth in the past 12 months Now married:
36.4% (30)Unmarried:
63.6% (53)
Marital status - Other race population 15 years and over
Males 32.6% Never married67.4% Now married0.0% Separated0.0% Widowed0.0% DivorcedFemales 73.1% Never married23.5% Now married0.0% Separated0.0% Widowed3.4% DivorcedWomen who gave birth in the past 12 months Now married:
100.0% (7)Unmarried:
0.0% (0)
Women who did not give birth in the past 12 months Now married:
18.0% (99)Unmarried:
82.0% (450)
Marital status - Two or more races population 15 years and over
Males 61.7% Never married38.3% Now married0.0% Separated0.0% Widowed0.0% DivorcedFemales 64.4% Never married29.6% Now married0.0% Separated2.2% Widowed3.9% DivorcedWomen who did not give birth in the past 12 months Now married:
27.1% (222)Unmarried:
72.9% (597)
Marital status - White alone, not Hispanic / Latino population 15 years and over
Males 55.2% Never married31.0% Now married1.3% Separated2.9% Widowed9.6% DivorcedFemales 48.3% Never married26.4% Now married1.1% Separated6.5% Widowed17.8% DivorcedWomen who gave birth in the past 12 months Now married:
100.0% (76)Unmarried:
0.0% (0)
Women who did not give birth in the past 12 months Now married:
23.6% (1,044)Unmarried:
76.4% (3,385)
Marital status - Hispanic or Latino population 15 years and over
Males 55.8% Never married36.3% Now married0.0% Separated2.5% Widowed5.4% DivorcedFemales 71.2% Never married25.9% Now married0.0% Separated0.0% Widowed2.9% DivorcedWomen who gave birth in the past 12 months Now married:
100.0% (15)Unmarried:
0.0% (0)
Women who did not give birth in the past 12 months Now married:
21.0% (166)Unmarried:
79.0% (625)
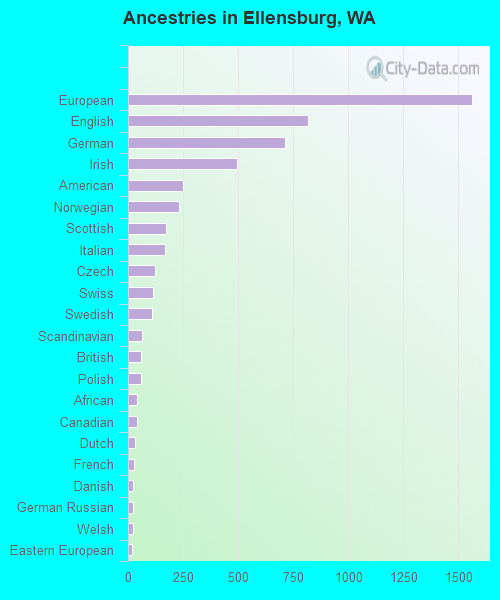
Ancestries in Ellensburg
1,561 21.1% European815 11.0% English713 9.6% German495 6.7% Irish249 3.4% American232 3.1% Norwegian173 2.3% Scottish170 2.3% Italian123 1.7% Czech112 1.5% Swiss110 1.5% Swedish63 0.8% Scandinavian61 0.8% British57 0.8% Polish43 0.6% African41 0.6% Canadian32 0.4% Dutch29 0.4% French24 0.3% Danish21 0.3% German Russian21 0.3% Welsh19 0.3% Eastern European13 0.2% Finnish13 0.2% Trinidadian and Tobagonian5 0.07% French Canadian5 0.07% Pennsylvania German3 0.04% Russian2 0.03% Scotch-Irish
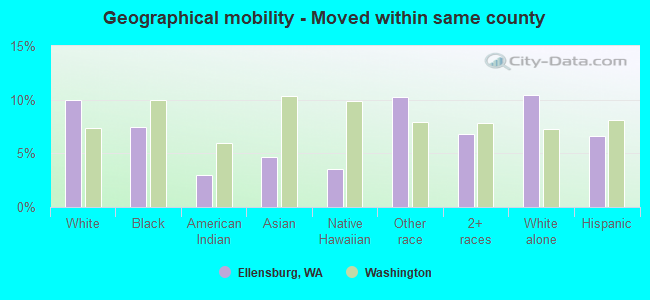
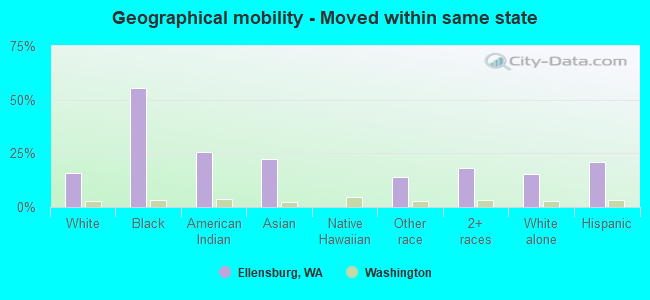
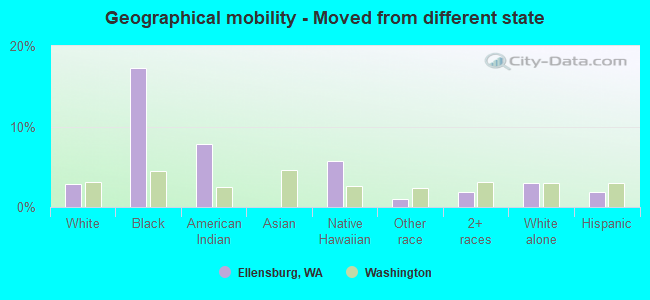
Geographical mobility in Ellensburg Same house 1 year ago 10,073 70.2% White (Caucasian)59 19.6% Black or African American73 62.9% American Indian / Alaska Native249 66.5% Asian137 90.3% Native Hawaiian / Pacific Islander814 67.6% Other race1,678 71.9% Two or more races9,981 69.9% White alone, not Hispanic / Latino1,561 68.4% Hispanic or LatinoMoved within same county 1,436 10.0% White / Caucasian22 7.4% Black or African American3 3.0% American Indian / Alaska Native17 4.7% Asian5 3.5% Native Hawaiian / Pacific Islander123 10.2% Other race159 6.8% Two or more races1,488 10.4% White alone, not Hispanic / Latino152 6.7% Hispanic or LatinoMoved within same state 2,257 15.7% White / Caucasian165 55.2% Black or African American30 25.6% American Indian / Alaska Native84 22.3% Asian170 14.1% Other race428 18.3% Two or more races2,206 15.4% White alone, not Hispanic / Latino476 20.9% Hispanic or LatinoMoved from different state 418 2.9% White / Caucasian52 17.3% Black or African American9 7.9% American Indian / Alaska Native9 5.8% Native Hawaiian / Pacific Islander12 1.0% Other race43 1.8% Two or more races429 3.0% White alone, not Hispanic / Latino43 1.9% Hispanic or LatinoMoved from abroad 57 0.4% White14 3.9% Asian51 4.2% Other race62 0.4% White alone, not Hispanic / Latino36 1.6% Hispanic or Latino
Children Nativity (place of birth) in Ellensburg
Children under 6 years - Living with two parents Both parents native 365 100.0% NativeBoth parents foreign-born 20 100.0% NativeOne native, one foreign-born parent 82 100.0% NativeChildren under 6 years - Living with one parent Native parent 377 100.0% Native
Children 6 to 17 years - Living with two parents Both parents native 1,191 100.0% NativeBoth parents foreign-born 12 100.0% NativeOne native, one foreign-born parent 34 100.0% NativeChildren 6 to 17 years - Living with one parent Native parent 592 100.0% Native
Grandparents responsible for own grandchildren in Ellensburg
Grandparents (30 to 59 years) White / Caucasian 40 100.0% Responsible for grandchildrenAmerican Indian / Alaska Native 15 100.0% Responsible for grandchildrenWhite alone, not Hispanic / Latino 40 100.0% Responsible for grandchildren
Grandparents (60 years and over) White / Caucasian 30 100.0% Responsible for grandchildrenWhite alone, not Hispanic / Latino 31 100.0% Responsible for grandchildren