Races in Elk Plain, Washington (WA) Detailed Stats
Data:
Races - White alone (%)
Races - White alone (% change since 2000)
Races - Black alone (%)
Races - Black alone (% change since 2000)
Races - American Indian alone (%)
Races - American Indian alone (% change since 2000)
Races - Asian alone (%)
Races - Asian alone (% change since 2000)
Races - Hispanic (%)
Races - Hispanic (% change since 2000)
Races - Native Hawaiian and Other Pacific Islander alone (%)
Races - Native Hawaiian and Other Pacific Islander alone (% change since 2000)
Races - Two or more races(%)
Races - Two or more races(% change since 2000)
Races - Other race alone (%)
Races - Other race alone (% change since 2000)
Racial diversity
Place of birth - Born in state of residence (%)
Place of birth - Born in state of residence (%) - White
Place of birth - Born in state of residence (%) - Black or African American
Place of birth - Born in state of residence (%) - Asian
Place of birth - Born in state of residence (%) - Hispanic or Latino
Place of birth - Born in state of residence (%) - American Indian and Alaska Native
Place of birth - Born in state of residence (%) - Multirace
Place of birth - Born in state of residence (%) - Other Race
Place of birth - Born in other state (%)
Place of birth - Born in other state (%) - White
Place of birth - Born in other state (%) - Black or African American
Place of birth - Born in other state (%) - Asian
Place of birth - Born in other state (%) - Hispanic or Latino
Place of birth - Born in other state (%) - American Indian and Alaska Native
Place of birth - Born in other state (%) - Multirace
Place of birth - Born in other state (%) - Other Race
Place of birth - Native, outside of US (%)
Place of birth - Native, outside of US (%) - White
Place of birth - Native, outside of US (%) - Black or African American
Place of birth - Native, outside of US (%) - Asian
Place of birth - Native, outside of US (%) - Hispanic or Latino
Place of birth - Native, outside of US (%) - American Indian and Alaska Native
Place of birth - Native, outside of US (%) - Multirace
Place of birth - Native, outside of US (%) - Other Race
Place of birth - Foreign born (%)
Place of birth - Foreign born (%) - White
Place of birth - Foreign born (%) - Black or African American
Place of birth - Foreign born (%) - Asian
Place of birth - Foreign born (%) - Hispanic or Latino
Place of birth - Foreign born (%) - American Indian and Alaska Native
Place of birth - Foreign born (%) - Multirace
Place of birth - Foreign born (%) - Other Race
Residents speaking English at home (%)
Residents speaking English at home - Born in the United States (%)
Residents speaking English at home - Native, born elsewhere (%)
Residents speaking English at home - Foreign born (%)
Residents speaking Spanish at home (%)
Residents speaking Spanish at home - Born in the United States (%)
Residents speaking Spanish at home - Native, born elsewhere (%)
Residents speaking Spanish at home - Foreign born (%)
Residents speaking other language at home (%)
Residents speaking other language at home - Born in the United States (%)
Residents speaking other language at home - Native, born elsewhere (%)
Residents speaking other language at home - Foreign born (%)
Marital status - Never married (%)
Marital status - Now married (%)
Marital status - Separated (%)
Marital status - Widowed (%)
Marital status - Divorced (%)
Ancestries Reported - Arab (%)
Ancestries Reported - Czech (%)
Ancestries Reported - Danish (%)
Ancestries Reported - Dutch (%)
Ancestries Reported - English (%)
Ancestries Reported - French (%)
Ancestries Reported - French Canadian (%)
Ancestries Reported - German (%)
Ancestries Reported - Greek (%)
Ancestries Reported - Hungarian (%)
Ancestries Reported - Irish (%)
Ancestries Reported - Italian (%)
Ancestries Reported - Lithuanian (%)
Ancestries Reported - Norwegian (%)
Ancestries Reported - Polish (%)
Ancestries Reported - Portuguese (%)
Ancestries Reported - Russian (%)
Ancestries Reported - Scotch-Irish (%)
Ancestries Reported - Scottish (%)
Ancestries Reported - Slovak (%)
Ancestries Reported - Subsaharan African (%)
Ancestries Reported - Swedish (%)
Ancestries Reported - Swiss (%)
Ancestries Reported - Ukrainian (%)
Ancestries Reported - United States (%)
Ancestries Reported - Welsh (%)
Ancestries Reported - West Indian (%)
Ancestries Reported - Other (%)
Geographical mobility - Same house 1 year ago (%)
Geographical mobility - Same house 1 year ago (%) - White
Geographical mobility - Same house 1 year ago (%) - Black or African American
Geographical mobility - Same house 1 year ago (%) - Asian
Geographical mobility - Same house 1 year ago (%) - Hispanic or Latino
Geographical mobility - Same house 1 year ago (%) - American Indian and Alaska Native
Geographical mobility - Same house 1 year ago (%) - Multirace
Geographical mobility - Same house 1 year ago (%) - Other Race
Geographical mobility - Moved within same county (%)
Geographical mobility - Moved within same county (%) - White
Geographical mobility - Moved within same county (%) - Black or African American
Geographical mobility - Moved within same county (%) - Asian
Geographical mobility - Moved within same county (%) - Hispanic or Latino
Geographical mobility - Moved within same county (%) - American Indian and Alaska Native
Geographical mobility - Moved within same county (%) - Multirace
Geographical mobility - Moved within same county (%) - Other Race
Geographical mobility - Moved from different county within same state (%)
Geographical mobility - Moved from different county within same state (%) - White
Geographical mobility - Moved from different county within same state (%) - Black or African American
Geographical mobility - Moved from different county within same state (%) - Asian
Geographical mobility - Moved from different county within same state (%) - Hispanic or Latino
Geographical mobility - Moved from different county within same state (%) - American Indian and Alaska Native
Geographical mobility - Moved from different county within same state (%) - Multirace
Geographical mobility - Moved from different county within same state (%) - Other Race
Geographical mobility - Moved from different state (%)
Geographical mobility - Moved from different state (%) - White
Geographical mobility - Moved from different state (%) - Black or African American
Geographical mobility - Moved from different state (%) - Asian
Geographical mobility - Moved from different state (%) - Hispanic or Latino
Geographical mobility - Moved from different state (%) - American Indian and Alaska Native
Geographical mobility - Moved from different state (%) - Multirace
Geographical mobility - Moved from different state (%) - Other Race
Geographical mobility - Moved from abroad (%)
Geographical mobility - Moved from abroad (%) - White
Geographical mobility - Moved from abroad (%) - Black or African American
Geographical mobility - Moved from abroad (%) - Asian
Geographical mobility - Moved from abroad (%) - Hispanic or Latino
Geographical mobility - Moved from abroad (%) - American Indian and Alaska Native
Geographical mobility - Moved from abroad (%) - Multirace
Geographical mobility - Moved from abroad (%) - Other Race
Place of birth for the foreign-born population - Ireland (%)
Place of birth for the foreign-born population - Denmark (%)
Place of birth for the foreign-born population - Norway (%)
Place of birth for the foreign-born population - Sweden (%)
Place of birth for the foreign-born population - United Kingdom (%)
Place of birth for the foreign-born population - England (%)
Place of birth for the foreign-born population - Scotland (%)
Place of birth for the foreign-born population - Other Northern Europe (%)
Place of birth for the foreign-born population - Austria (%)
Place of birth for the foreign-born population - Belgium (%)
Place of birth for the foreign-born population - France (%)
Place of birth for the foreign-born population - Germany (%)
Place of birth for the foreign-born population - Netherlands (%)
Place of birth for the foreign-born population - Switzerland (%)
Place of birth for the foreign-born population - Other Western Europe (%)
Place of birth for the foreign-born population - Greece (%)
Place of birth for the foreign-born population - Italy (%)
Place of birth for the foreign-born population - Portugal (%)
Place of birth for the foreign-born population - Spain (%)
Place of birth for the foreign-born population - Other Southern Europe (%)
Place of birth for the foreign-born population - Albania (%)
Place of birth for the foreign-born population - Belarus (%)
Place of birth for the foreign-born population - Bosnia and Herzegovina (%)
Place of birth for the foreign-born population - Bulgaria (%)
Place of birth for the foreign-born population - Croatia (%)
Place of birth for the foreign-born population - Czechoslovakia (%)
Place of birth for the foreign-born population - Hungary (%)
Place of birth for the foreign-born population - Latvia (%)
Place of birth for the foreign-born population - Lithuania (%)
Place of birth for the foreign-born population - North Macedonia (Macedonia) (%)
Place of birth for the foreign-born population - Moldova (%)
Place of birth for the foreign-born population - Poland (%)
Place of birth for the foreign-born population - Romania (%)
Place of birth for the foreign-born population - Russia (%)
Place of birth for the foreign-born population - Serbia (%)
Place of birth for the foreign-born population - Ukraine (%)
Place of birth for the foreign-born population - Other Eastern Europe (%)
Place of birth for the foreign-born population - China (%)
Place of birth for the foreign-born population - Hong Kong (%)
Place of birth for the foreign-born population - Taiwan (%)
Place of birth for the foreign-born population - Japan (%)
Place of birth for the foreign-born population - Korea (%)
Place of birth for the foreign-born population - Other Eastern Asia (%)
Place of birth for the foreign-born population - Afghanistan (%)
Place of birth for the foreign-born population - Bangladesh (%)
Place of birth for the foreign-born population - India (%)
Place of birth for the foreign-born population - Iran (%)
Place of birth for the foreign-born population - Kazakhstan (%)
Place of birth for the foreign-born population - Nepal (%)
Place of birth for the foreign-born population - Pakistan (%)
Place of birth for the foreign-born population - Sri Lanka (%)
Place of birth for the foreign-born population - Uzbekistan (%)
Place of birth for the foreign-born population - Other South Central Asia (%)
Place of birth for the foreign-born population - Burma (%)
Place of birth for the foreign-born population - Cambodia (%)
Place of birth for the foreign-born population - Indonesia (%)
Place of birth for the foreign-born population - Laos (%)
Place of birth for the foreign-born population - Malaysia (%)
Place of birth for the foreign-born population - Philippines (%)
Place of birth for the foreign-born population - Singapore (%)
Place of birth for the foreign-born population - Thailand (%)
Place of birth for the foreign-born population - Vietnam (%)
Place of birth for the foreign-born population - Other South Eastern Asia (%)
Place of birth for the foreign-born population - Armenia (%)
Place of birth for the foreign-born population - Iraq (%)
Place of birth for the foreign-born population - Israel (%)
Place of birth for the foreign-born population - Jordan (%)
Place of birth for the foreign-born population - Kuwait (%)
Place of birth for the foreign-born population - Lebanon (%)
Place of birth for the foreign-born population - Saudi Arabia (%)
Place of birth for the foreign-born population - Syria (%)
Place of birth for the foreign-born population - Turkey (%)
Place of birth for the foreign-born population - Yemen (%)
Place of birth for the foreign-born population - Other Western Asia (%)
Place of birth for the foreign-born population - Eritrea (%)
Place of birth for the foreign-born population - Ethiopia (%)
Place of birth for the foreign-born population - Kenya (%)
Place of birth for the foreign-born population - Somalia (%)
Place of birth for the foreign-born population - Uganda (%)
Place of birth for the foreign-born population - Zimbabwe (%)
Place of birth for the foreign-born population - Other Eastern Africa (%)
Place of birth for the foreign-born population - Cameroon (%)
Place of birth for the foreign-born population - Congo (%)
Place of birth for the foreign-born population - Democratic Republic of Congo (Zaire) (%)
Place of birth for the foreign-born population - Other Middle Africa (%)
Place of birth for the foreign-born population - Egypt (%)
Place of birth for the foreign-born population - Morocco (%)
Place of birth for the foreign-born population - Sudan (%)
Place of birth for the foreign-born population - Other Northern Africa (%)
Place of birth for the foreign-born population - South Africa (%)
Place of birth for the foreign-born population - Other Southern Africa (%)
Place of birth for the foreign-born population - Cabo Verde (%)
Place of birth for the foreign-born population - Ghana (%)
Place of birth for the foreign-born population - Liberia (%)
Place of birth for the foreign-born population - Nigeria (%)
Place of birth for the foreign-born population - Senegal (%)
Place of birth for the foreign-born population - Sierra Leone (%)
Place of birth for the foreign-born population - Other Western Africa (%)
Place of birth for the foreign-born population - Australia (%)
Place of birth for the foreign-born population - New Zealand (%)
Place of birth for the foreign-born population - Fiji (%)
Place of birth for the foreign-born population - Micronesia (%)
Place of birth for the foreign-born population - Bahamas (%)
Place of birth for the foreign-born population - Barbados (%)
Place of birth for the foreign-born population - Cuba (%)
Place of birth for the foreign-born population - Dominica (%)
Place of birth for the foreign-born population - Dominican Republic (%)
Place of birth for the foreign-born population - Grenada (%)
Place of birth for the foreign-born population - Haiti (%)
Place of birth for the foreign-born population - Jamaica (%)
Place of birth for the foreign-born population - St. Vincent and the Grenadines (%)
Place of birth for the foreign-born population - Trinidad and Tobago (%)
Place of birth for the foreign-born population - West Indies (%)
Place of birth for the foreign-born population - Other Caribbean (%)
Place of birth for the foreign-born population - Belize (%)
Place of birth for the foreign-born population - Costa Rica (%)
Place of birth for the foreign-born population - El Salvador (%)
Place of birth for the foreign-born population - Guatemala (%)
Place of birth for the foreign-born population - Honduras (%)
Place of birth for the foreign-born population - Mexico (%)
Place of birth for the foreign-born population - Nicaragua (%)
Place of birth for the foreign-born population - Panama (%)
Place of birth for the foreign-born population - Other Central America (%)
Place of birth for the foreign-born population - Argentina (%)
Place of birth for the foreign-born population - Bolivia (%)
Place of birth for the foreign-born population - Brazil (%)
Place of birth for the foreign-born population - Chile (%)
Place of birth for the foreign-born population - Colombia (%)
Place of birth for the foreign-born population - Ecuador (%)
Place of birth for the foreign-born population - Guyana (%)
Place of birth for the foreign-born population - Peru (%)
Place of birth for the foreign-born population - Uruguay (%)
Place of birth for the foreign-born population - Venezuela (%)
Place of birth for the foreign-born population - Other South America (%)
Place of birth for the foreign-born population - Canada (%)
Place of birth for the foreign-born population - Other Northern America (%)
Place of birth for the foreign-born population - Other (%)
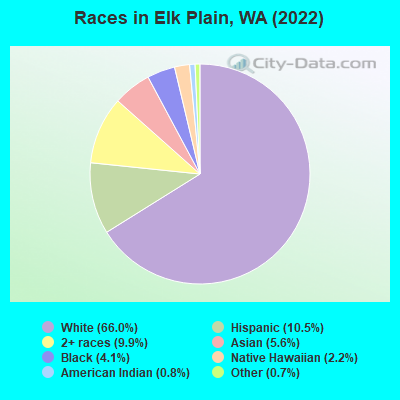
According to 2022 data, the most numerous races in Elk Plain, WA are White alone (9,475 residents), Hispanic (1,506 residents), and Asian alone (801 residents). 88.9% of Elk Plain residents speak English at home. 7.9% of Elk Plain, WA residents are foreign-born (3.3% born in Asia, 1.7% born in Latin America, 1.6% born in Europe), which is 88.7% less than the foreign-born rate of 15.0% across the entire state of Washington.
Race distribution in Elk Plain
2000 2022
4,652,490 78.9% White alone 441,509 7.5% Hispanic 319,401 5.4% Asian alone 184,631 3.1% Black alone 175,926 3.0% Two or more races 85,396 1.4% American Indian alone 22,779 0.4% Native Hawaiian and Other 11,989 0.2% Other race alone
4,941,456 63.5% White alone 1,093,313 14.0% Hispanic 755,832 9.7% Asian alone 523,448 6.7% Two or more races 299,537 3.8% Black alone 69,024 0.9% American Indian alone 52,231 0.7% Native Hawaiian and Other 50,945 0.7% Other race alone
Income and house value in Elk Plain Median household income in 2022 $100,415 White non-Hispanic householders$70,175 Black householders$121,548 Asian householders$96,658 Some other race householders$95,147 Two or more races householders$90,963 Hispanic or Latino race householdersMedian 2022 house value $511,817 White Non-Hispanic householders$482,528 Black or African American householders$514,746 American Indian or Alaska Native householders $538,177 Asian householders$535,980 Native Hawaiian and other Pacific Islander householders$622,015 Some other race householders$601,513 Two or more races householders$600,781 Hispanic or Latino householders
Median age by race in Elk Plain
42.2 Median age for White residents43.1 41.6 48.7 Median age for Black or African American residents60.1 22.2 43.8 Median age for American Indian / Alaska Native residents36.4 42.5 39.1 Median age for Asian residents37.3 59.9 42.3 Median age for Native Hawaiian / Pacific Islander residents39.6 59.8 27.7 Median age for Other race residents38.8 21.9 25.9 Median age for Two or more races residents30.2 18.8 44.3 Median age for White alone residents43.3 44.4 27.6 Median age for Hispanic or Latino residents34.7 27.6
Owner/renter occupied households by race in Elk Plain
House owners and renters - White residents 3,282 86.0% Owner occupied535 14.0% Renter occupiedHouse owners and renters - Black or African American residents 49 27.6% Owner occupied129 72.4% Renter occupiedHouse owners and renters - American Indian / Alaska Native residents 26 100.0% Owner occupiedHouse owners and renters - Asian residents 250 82.2% Owner occupied54 17.8% Renter occupiedHouse owners and renters - Native Hawaiian / Pacific Islander residents 22 54.4% Owner occupied19 45.6% Renter occupiedHouse owners and renters - Other race residents 199 100.0% Owner occupiedHouse owners and renters - Two or more races residents 392 79.7% Owner occupied100 20.3% Renter occupiedHouse owners and renters - White alone residents 3,145 85.3% Owner occupied544 14.7% Renter occupiedHouse owners and renters - Hispanic or Latino residents 444 94.6% Owner occupied26 5.4% Renter occupied
Language usage in Elk Plain
English speakers - Total 88.9% of residents of Elk Plain speak English at home.
3.6% of residents speak Spanish at home 471 95.9% Speak English very well20 4.1% Speak English less than very well7.5% of residents speak other language at home 534 51.9% Speak English very well494 48.1% Speak English less than very well
English speakers - Born in the United States 95.9% of residents of Elk Plain speak English at home.
1.5% of residents speak Spanish at home 80 100.0% Speak English very well2.4% of residents speak other language at home 113 86.9% Speak English very well17 13.1% Speak English less than very well
English speakers - Native, born elsewhere 72.0% of residents of Elk Plain speak English at home.
2.5% of residents speak Spanish at home 10 71.4% Speak English very well4 28.6% Speak English less than very well28.6% of residents speak other language at home 106 65.4% Speak English very well56 34.6% Speak English less than very well
English speakers - Foreign-born 27.7% of residents of Elk Plain speak English at home.
17.4% of residents speak Spanish at home 192 93.7% Speak English very well13 6.3% Speak English less than very well53.5% of residents speak other language at home 264 42.0% Speak English very well365 58.0% Speak English less than very well
White (Caucasian) - Speak only English Native:
99.6% (9,195)Foreign-born:
65.9% (135)
White (Caucasian) - Speak another language Native:
1.1% (105)Foreign-born:
26.9% (55)
Black or African American - Speak another language Native:
8.4% (53)Foreign-born:
100.0% (13)
Asian - Speak only English Native:
52.5% (158)Foreign-born:
35.5% (183)
Asian - Speak another language Native:
45.9% (138)Foreign-born:
68.5% (352)
Native Hawaiian / Pacific Islander - Speak another language Native:
56.8% (119)Foreign-born:
91.9% (84)
Other race - Speak another language Native:
17.9% (42)Foreign-born:
99.0% (63)
Two or more races - Speak only English Native:
84.9% (1,461)Foreign-born:
10.9% (39)
Two or more races - Speak another language Native:
15.0% (257)Foreign-born:
89.4% (321)
White alone - Speak only English Native:
99.3% (8,812)Foreign-born:
67.1% (142)
White alone - Speak another language Native:
1.0% (86)Foreign-born:
18.6% (40)
Hispanic or Latino - Speak only English Native:
84.2% (925)Foreign-born:
9.1% (25)
Hispanic or Latino - Speak another language Native:
18.0% (198)Foreign-born:
90.5% (249)
Foreign-born residents in Elk Plain 1,141 residents are foreign born (3.3% Asia , 1.7% Latin America , 1.6% Europe ).
This city:
7.9%Washington:
14.9%
Marital status for residents in Elk Plain Marital status - White (Caucasian) population 15 years and over
Males 21.4% Never married61.4% Now married1.8% Separated1.8% Widowed13.6% DivorcedFemales 18.1% Never married61.1% Now married0.9% Separated6.7% Widowed13.2% DivorcedWomen who gave birth in the past 12 months Now married:
100.0% (132)Unmarried:
0.0% (0)
Women who did not give birth in the past 12 months Now married:
56.0% (998)Unmarried:
44.0% (784)
Marital status - Black or African American population 15 years and over
Males 32.5% Never married67.5% Now married0.0% Separated0.0% Widowed0.0% DivorcedFemales 64.2% Never married8.7% Now married0.0% Separated3.9% Widowed23.3% DivorcedWomen who gave birth in the past 12 months Now married:
0.0% (0)Unmarried:
100.0% (22)
Women who did not give birth in the past 12 months Now married:
7.5% (19)Unmarried:
92.5% (230)
Marital status - American Indian / Alaska Native population 15 years and over
Males 56.2% Never married43.8% Now married0.0% Separated0.0% Widowed0.0% DivorcedFemales 0.0% Never married80.7% Now married0.0% Separated0.0% Widowed19.3% DivorcedWomen who did not give birth in the past 12 months Now married:
0.0% (0)Unmarried:
100.0% (11)
Marital status - Asian population 15 years and over
Males 41.0% Never married55.3% Now married0.0% Separated0.0% Widowed3.8% DivorcedFemales 18.2% Never married63.0% Now married0.0% Separated2.5% Widowed16.3% DivorcedWomen who did not give birth in the past 12 months Now married:
58.5% (129)Unmarried:
41.5% (92)
Marital status - Native Hawaiian / Pacific Islander population 15 years and over
Males 63.2% Never married36.8% Now married0.0% Separated0.0% Widowed0.0% DivorcedFemales 15.4% Never married39.1% Now married0.0% Separated45.6% Widowed0.0% DivorcedWomen who did not give birth in the past 12 months Now married:
56.7% (38)Unmarried:
43.3% (29)
Marital status - Other race population 15 years and over
Males 52.9% Never married36.5% Now married0.0% Separated10.6% Widowed0.0% DivorcedFemales 28.2% Never married38.8% Now married0.0% Separated0.0% Widowed33.0% DivorcedWomen who gave birth in the past 12 months Now married:
100.0% (49)Unmarried:
0.0% (0)
Women who did not give birth in the past 12 months Now married:
0.0% (0)Unmarried:
100.0% (104)
Marital status - Two or more races population 15 years and over
Males 61.2% Never married35.2% Now married0.0% Separated1.2% Widowed2.4% DivorcedFemales 41.0% Never married59.0% Now married0.0% Separated0.0% Widowed0.0% DivorcedWomen who gave birth in the past 12 months Now married:
100.0% (29)Unmarried:
0.0% (0)
Women who did not give birth in the past 12 months Now married:
50.3% (225)Unmarried:
49.7% (222)
Marital status - White alone, not Hispanic / Latino population 15 years and over
Males 21.6% Never married61.4% Now married1.9% Separated1.5% Widowed13.6% DivorcedFemales 14.8% Never married62.7% Now married1.0% Separated7.2% Widowed14.3% DivorcedWomen who gave birth in the past 12 months Now married:
100.0% (107)Unmarried:
0.0% (0)
Women who did not give birth in the past 12 months Now married:
60.0% (946)Unmarried:
40.0% (629)
Marital status - Hispanic or Latino population 15 years and over
Males 51.7% Never married40.7% Now married0.0% Separated5.6% Widowed2.1% DivorcedFemales 48.4% Never married41.8% Now married0.0% Separated0.0% Widowed9.8% DivorcedWomen who gave birth in the past 12 months Now married:
77.1% (80)Unmarried:
22.9% (24)
Women who did not give birth in the past 12 months Now married:
28.4% (130)Unmarried:
71.6% (327)
Ancestries in Elk Plain
734 13.0% German587 10.4% English476 8.4% American414 7.3% Irish207 3.7% Norwegian121 2.1% European107 1.9% Scottish90 1.6% French Canadian78 1.4% Italian72 1.3% Swedish65 1.2% Polish50 0.9% Dutch45 0.8% Scandinavian38 0.7% French34 0.6% Welsh28 0.5% Finnish23 0.4% Scotch-Irish21 0.4% Somali18 0.3% Romanian16 0.3% Belgian15 0.3% British15 0.3% Danish9 0.2% Canadian9 0.2% Yugoslavian5 0.09% Moroccan
Geographical mobility in Elk Plain Same house 1 year ago 8,099 83.1% White (Caucasian)508 78.0% Black or African American110 90.6% American Indian / Alaska Native757 92.8% Asian248 84.4% Native Hawaiian / Pacific Islander214 61.9% Other race1,584 74.2% Two or more races7,790 82.9% White alone, not Hispanic / Latino1,130 76.9% Hispanic or LatinoMoved within same county 1,058 10.9% White / Caucasian77 11.9% Black or African American12 10.0% American Indian / Alaska Native10 1.3% Asian46 15.5% Native Hawaiian / Pacific Islander271 12.7% Two or more races1,015 10.8% White alone, not Hispanic / Latino64 4.4% Hispanic or LatinoMoved within same state 339 3.5% White / Caucasian25 3.9% Black or African American133 38.4% Other race15 0.7% Two or more races341 3.6% White alone, not Hispanic / Latino123 8.3% Hispanic or LatinoMoved from different state 157 1.6% White / Caucasian264 12.4% Two or more races156 1.7% White alone, not Hispanic / Latino115 7.8% Hispanic or Latino
Children Nativity (place of birth) in Elk Plain
Children under 6 years - Living with two parents Both parents native 673 100.0% NativeBoth parents foreign-born 18 100.0% NativeOne native, one foreign-born parent 5 100.0% NativeChildren under 6 years - Living with one parent Native parent 120 100.0% Native
Children 6 to 17 years - Living with two parents Both parents native 1,333 100.0% NativeBoth parents foreign-born 148 100.0% NativeOne native, one foreign-born parent 62 100.0% NativeChildren 6 to 17 years - Living with one parent Native parent 589 100.0% Native
Grandparents responsible for own grandchildren in Elk Plain
Grandparents (30 to 59 years) White / Caucasian 68 58.2% Responsible for grandchildren49 41.8% Not responsible for grandchildrenAsian 30 100.0% Not responsible for grandchildrenOther race 8 100.0% Responsible for grandchildrenTwo or more races 16 100.0% Not responsible for grandchildrenWhite alone, not Hispanic / Latino 59 54.3% Responsible for grandchildren50 45.7% Not responsible for grandchildrenHispanic or Latino 17 100.0% Responsible for grandchildrenGrandparents (60 years and over) White / Caucasian 55 51.9% Responsible for grandchildren51 48.1% Not responsible for grandchildrenAsian 22 100.0% Not responsible for grandchildrenTwo or more races 15 100.0% Responsible for grandchildrenWhite alone, not Hispanic / Latino 57 52.9% Responsible for grandchildren51 47.1% Not responsible for grandchildren