Races in Edmond, Oklahoma (OK) Detailed Stats
Data:
Races - White alone (%)
Races - White alone (% change since 2000)
Races - Black alone (%)
Races - Black alone (% change since 2000)
Races - American Indian alone (%)
Races - American Indian alone (% change since 2000)
Races - Asian alone (%)
Races - Asian alone (% change since 2000)
Races - Hispanic (%)
Races - Hispanic (% change since 2000)
Races - Native Hawaiian and Other Pacific Islander alone (%)
Races - Native Hawaiian and Other Pacific Islander alone (% change since 2000)
Races - Two or more races(%)
Races - Two or more races(% change since 2000)
Races - Other race alone (%)
Races - Other race alone (% change since 2000)
Racial diversity
Place of birth - Born in state of residence (%)
Place of birth - Born in state of residence (%) - White
Place of birth - Born in state of residence (%) - Black or African American
Place of birth - Born in state of residence (%) - Asian
Place of birth - Born in state of residence (%) - Hispanic or Latino
Place of birth - Born in state of residence (%) - American Indian and Alaska Native
Place of birth - Born in state of residence (%) - Multirace
Place of birth - Born in state of residence (%) - Other Race
Place of birth - Born in other state (%)
Place of birth - Born in other state (%) - White
Place of birth - Born in other state (%) - Black or African American
Place of birth - Born in other state (%) - Asian
Place of birth - Born in other state (%) - Hispanic or Latino
Place of birth - Born in other state (%) - American Indian and Alaska Native
Place of birth - Born in other state (%) - Multirace
Place of birth - Born in other state (%) - Other Race
Place of birth - Native, outside of US (%)
Place of birth - Native, outside of US (%) - White
Place of birth - Native, outside of US (%) - Black or African American
Place of birth - Native, outside of US (%) - Asian
Place of birth - Native, outside of US (%) - Hispanic or Latino
Place of birth - Native, outside of US (%) - American Indian and Alaska Native
Place of birth - Native, outside of US (%) - Multirace
Place of birth - Native, outside of US (%) - Other Race
Place of birth - Foreign born (%)
Place of birth - Foreign born (%) - White
Place of birth - Foreign born (%) - Black or African American
Place of birth - Foreign born (%) - Asian
Place of birth - Foreign born (%) - Hispanic or Latino
Place of birth - Foreign born (%) - American Indian and Alaska Native
Place of birth - Foreign born (%) - Multirace
Place of birth - Foreign born (%) - Other Race
Residents speaking English at home (%)
Residents speaking English at home - Born in the United States (%)
Residents speaking English at home - Native, born elsewhere (%)
Residents speaking English at home - Foreign born (%)
Residents speaking Spanish at home (%)
Residents speaking Spanish at home - Born in the United States (%)
Residents speaking Spanish at home - Native, born elsewhere (%)
Residents speaking Spanish at home - Foreign born (%)
Residents speaking other language at home (%)
Residents speaking other language at home - Born in the United States (%)
Residents speaking other language at home - Native, born elsewhere (%)
Residents speaking other language at home - Foreign born (%)
Marital status - Never married (%)
Marital status - Now married (%)
Marital status - Separated (%)
Marital status - Widowed (%)
Marital status - Divorced (%)
Ancestries Reported - Arab (%)
Ancestries Reported - Czech (%)
Ancestries Reported - Danish (%)
Ancestries Reported - Dutch (%)
Ancestries Reported - English (%)
Ancestries Reported - French (%)
Ancestries Reported - French Canadian (%)
Ancestries Reported - German (%)
Ancestries Reported - Greek (%)
Ancestries Reported - Hungarian (%)
Ancestries Reported - Irish (%)
Ancestries Reported - Italian (%)
Ancestries Reported - Lithuanian (%)
Ancestries Reported - Norwegian (%)
Ancestries Reported - Polish (%)
Ancestries Reported - Portuguese (%)
Ancestries Reported - Russian (%)
Ancestries Reported - Scotch-Irish (%)
Ancestries Reported - Scottish (%)
Ancestries Reported - Slovak (%)
Ancestries Reported - Subsaharan African (%)
Ancestries Reported - Swedish (%)
Ancestries Reported - Swiss (%)
Ancestries Reported - Ukrainian (%)
Ancestries Reported - United States (%)
Ancestries Reported - Welsh (%)
Ancestries Reported - West Indian (%)
Ancestries Reported - Other (%)
Geographical mobility - Same house 1 year ago (%)
Geographical mobility - Same house 1 year ago (%) - White
Geographical mobility - Same house 1 year ago (%) - Black or African American
Geographical mobility - Same house 1 year ago (%) - Asian
Geographical mobility - Same house 1 year ago (%) - Hispanic or Latino
Geographical mobility - Same house 1 year ago (%) - American Indian and Alaska Native
Geographical mobility - Same house 1 year ago (%) - Multirace
Geographical mobility - Same house 1 year ago (%) - Other Race
Geographical mobility - Moved within same county (%)
Geographical mobility - Moved within same county (%) - White
Geographical mobility - Moved within same county (%) - Black or African American
Geographical mobility - Moved within same county (%) - Asian
Geographical mobility - Moved within same county (%) - Hispanic or Latino
Geographical mobility - Moved within same county (%) - American Indian and Alaska Native
Geographical mobility - Moved within same county (%) - Multirace
Geographical mobility - Moved within same county (%) - Other Race
Geographical mobility - Moved from different county within same state (%)
Geographical mobility - Moved from different county within same state (%) - White
Geographical mobility - Moved from different county within same state (%) - Black or African American
Geographical mobility - Moved from different county within same state (%) - Asian
Geographical mobility - Moved from different county within same state (%) - Hispanic or Latino
Geographical mobility - Moved from different county within same state (%) - American Indian and Alaska Native
Geographical mobility - Moved from different county within same state (%) - Multirace
Geographical mobility - Moved from different county within same state (%) - Other Race
Geographical mobility - Moved from different state (%)
Geographical mobility - Moved from different state (%) - White
Geographical mobility - Moved from different state (%) - Black or African American
Geographical mobility - Moved from different state (%) - Asian
Geographical mobility - Moved from different state (%) - Hispanic or Latino
Geographical mobility - Moved from different state (%) - American Indian and Alaska Native
Geographical mobility - Moved from different state (%) - Multirace
Geographical mobility - Moved from different state (%) - Other Race
Geographical mobility - Moved from abroad (%)
Geographical mobility - Moved from abroad (%) - White
Geographical mobility - Moved from abroad (%) - Black or African American
Geographical mobility - Moved from abroad (%) - Asian
Geographical mobility - Moved from abroad (%) - Hispanic or Latino
Geographical mobility - Moved from abroad (%) - American Indian and Alaska Native
Geographical mobility - Moved from abroad (%) - Multirace
Geographical mobility - Moved from abroad (%) - Other Race
Place of birth for the foreign-born population - Ireland (%)
Place of birth for the foreign-born population - Denmark (%)
Place of birth for the foreign-born population - Norway (%)
Place of birth for the foreign-born population - Sweden (%)
Place of birth for the foreign-born population - United Kingdom (%)
Place of birth for the foreign-born population - England (%)
Place of birth for the foreign-born population - Scotland (%)
Place of birth for the foreign-born population - Other Northern Europe (%)
Place of birth for the foreign-born population - Austria (%)
Place of birth for the foreign-born population - Belgium (%)
Place of birth for the foreign-born population - France (%)
Place of birth for the foreign-born population - Germany (%)
Place of birth for the foreign-born population - Netherlands (%)
Place of birth for the foreign-born population - Switzerland (%)
Place of birth for the foreign-born population - Other Western Europe (%)
Place of birth for the foreign-born population - Greece (%)
Place of birth for the foreign-born population - Italy (%)
Place of birth for the foreign-born population - Portugal (%)
Place of birth for the foreign-born population - Spain (%)
Place of birth for the foreign-born population - Other Southern Europe (%)
Place of birth for the foreign-born population - Albania (%)
Place of birth for the foreign-born population - Belarus (%)
Place of birth for the foreign-born population - Bosnia and Herzegovina (%)
Place of birth for the foreign-born population - Bulgaria (%)
Place of birth for the foreign-born population - Croatia (%)
Place of birth for the foreign-born population - Czechoslovakia (%)
Place of birth for the foreign-born population - Hungary (%)
Place of birth for the foreign-born population - Latvia (%)
Place of birth for the foreign-born population - Lithuania (%)
Place of birth for the foreign-born population - North Macedonia (Macedonia) (%)
Place of birth for the foreign-born population - Moldova (%)
Place of birth for the foreign-born population - Poland (%)
Place of birth for the foreign-born population - Romania (%)
Place of birth for the foreign-born population - Russia (%)
Place of birth for the foreign-born population - Serbia (%)
Place of birth for the foreign-born population - Ukraine (%)
Place of birth for the foreign-born population - Other Eastern Europe (%)
Place of birth for the foreign-born population - China (%)
Place of birth for the foreign-born population - Hong Kong (%)
Place of birth for the foreign-born population - Taiwan (%)
Place of birth for the foreign-born population - Japan (%)
Place of birth for the foreign-born population - Korea (%)
Place of birth for the foreign-born population - Other Eastern Asia (%)
Place of birth for the foreign-born population - Afghanistan (%)
Place of birth for the foreign-born population - Bangladesh (%)
Place of birth for the foreign-born population - India (%)
Place of birth for the foreign-born population - Iran (%)
Place of birth for the foreign-born population - Kazakhstan (%)
Place of birth for the foreign-born population - Nepal (%)
Place of birth for the foreign-born population - Pakistan (%)
Place of birth for the foreign-born population - Sri Lanka (%)
Place of birth for the foreign-born population - Uzbekistan (%)
Place of birth for the foreign-born population - Other South Central Asia (%)
Place of birth for the foreign-born population - Burma (%)
Place of birth for the foreign-born population - Cambodia (%)
Place of birth for the foreign-born population - Indonesia (%)
Place of birth for the foreign-born population - Laos (%)
Place of birth for the foreign-born population - Malaysia (%)
Place of birth for the foreign-born population - Philippines (%)
Place of birth for the foreign-born population - Singapore (%)
Place of birth for the foreign-born population - Thailand (%)
Place of birth for the foreign-born population - Vietnam (%)
Place of birth for the foreign-born population - Other South Eastern Asia (%)
Place of birth for the foreign-born population - Armenia (%)
Place of birth for the foreign-born population - Iraq (%)
Place of birth for the foreign-born population - Israel (%)
Place of birth for the foreign-born population - Jordan (%)
Place of birth for the foreign-born population - Kuwait (%)
Place of birth for the foreign-born population - Lebanon (%)
Place of birth for the foreign-born population - Saudi Arabia (%)
Place of birth for the foreign-born population - Syria (%)
Place of birth for the foreign-born population - Turkey (%)
Place of birth for the foreign-born population - Yemen (%)
Place of birth for the foreign-born population - Other Western Asia (%)
Place of birth for the foreign-born population - Eritrea (%)
Place of birth for the foreign-born population - Ethiopia (%)
Place of birth for the foreign-born population - Kenya (%)
Place of birth for the foreign-born population - Somalia (%)
Place of birth for the foreign-born population - Uganda (%)
Place of birth for the foreign-born population - Zimbabwe (%)
Place of birth for the foreign-born population - Other Eastern Africa (%)
Place of birth for the foreign-born population - Cameroon (%)
Place of birth for the foreign-born population - Congo (%)
Place of birth for the foreign-born population - Democratic Republic of Congo (Zaire) (%)
Place of birth for the foreign-born population - Other Middle Africa (%)
Place of birth for the foreign-born population - Egypt (%)
Place of birth for the foreign-born population - Morocco (%)
Place of birth for the foreign-born population - Sudan (%)
Place of birth for the foreign-born population - Other Northern Africa (%)
Place of birth for the foreign-born population - South Africa (%)
Place of birth for the foreign-born population - Other Southern Africa (%)
Place of birth for the foreign-born population - Cabo Verde (%)
Place of birth for the foreign-born population - Ghana (%)
Place of birth for the foreign-born population - Liberia (%)
Place of birth for the foreign-born population - Nigeria (%)
Place of birth for the foreign-born population - Senegal (%)
Place of birth for the foreign-born population - Sierra Leone (%)
Place of birth for the foreign-born population - Other Western Africa (%)
Place of birth for the foreign-born population - Australia (%)
Place of birth for the foreign-born population - New Zealand (%)
Place of birth for the foreign-born population - Fiji (%)
Place of birth for the foreign-born population - Micronesia (%)
Place of birth for the foreign-born population - Bahamas (%)
Place of birth for the foreign-born population - Barbados (%)
Place of birth for the foreign-born population - Cuba (%)
Place of birth for the foreign-born population - Dominica (%)
Place of birth for the foreign-born population - Dominican Republic (%)
Place of birth for the foreign-born population - Grenada (%)
Place of birth for the foreign-born population - Haiti (%)
Place of birth for the foreign-born population - Jamaica (%)
Place of birth for the foreign-born population - St. Vincent and the Grenadines (%)
Place of birth for the foreign-born population - Trinidad and Tobago (%)
Place of birth for the foreign-born population - West Indies (%)
Place of birth for the foreign-born population - Other Caribbean (%)
Place of birth for the foreign-born population - Belize (%)
Place of birth for the foreign-born population - Costa Rica (%)
Place of birth for the foreign-born population - El Salvador (%)
Place of birth for the foreign-born population - Guatemala (%)
Place of birth for the foreign-born population - Honduras (%)
Place of birth for the foreign-born population - Mexico (%)
Place of birth for the foreign-born population - Nicaragua (%)
Place of birth for the foreign-born population - Panama (%)
Place of birth for the foreign-born population - Other Central America (%)
Place of birth for the foreign-born population - Argentina (%)
Place of birth for the foreign-born population - Bolivia (%)
Place of birth for the foreign-born population - Brazil (%)
Place of birth for the foreign-born population - Chile (%)
Place of birth for the foreign-born population - Colombia (%)
Place of birth for the foreign-born population - Ecuador (%)
Place of birth for the foreign-born population - Guyana (%)
Place of birth for the foreign-born population - Peru (%)
Place of birth for the foreign-born population - Uruguay (%)
Place of birth for the foreign-born population - Venezuela (%)
Place of birth for the foreign-born population - Other South America (%)
Place of birth for the foreign-born population - Canada (%)
Place of birth for the foreign-born population - Other Northern America (%)
Place of birth for the foreign-born population - Other (%)
Latest news about races in Edmond, OK collected exclusively by city-data.com from local newspapers, TV, and radio stations
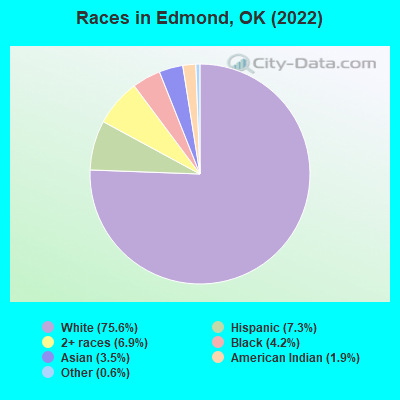
According to 2022 data, the most numerous races in Edmond, OK are White alone (72,806 residents), Hispanic (7,025 residents), and Two or more races (6,615 residents). 93.1% of Edmond residents speak English at home. 5.8% of Edmond, OK residents are foreign-born (3.0% born in Asia, 1.5% born in Latin America), which is 3.4% less than the foreign-born rate of 6.0% across the entire state of Oklahoma.
Race distribution in Edmond
2000 2022
58,104 85.1% White alone 2,721 4.0% Black alone 2,215 3.2% Asian alone 1,881 2.8% Hispanic 1,769 2.6% Two or more races 1,535 2.2% American Indian alone 46 0.07% Native Hawaiian and Other 44 0.06% Other race alone
72,806 75.6% White alone 7,025 7.3% Hispanic 6,615 6.9% Two or more races 4,045 4.2% Black alone 3,358 3.5% Asian alone 1,798 1.9% American Indian alone 561 0.6% Other race alone 96 0.10% Native Hawaiian and Other
2000 2022
2,556,368 74.1% White alone 266,158 7.7% American Indian alone 257,981 7.5% Black alone 179,304 5.2% Hispanic 140,249 4.1% Two or more races 46,172 1.3% Asian alone 2,322 0.07% Other race alone 2,100 0.06% Native Hawaiian and Other
2,517,403 62.6% White alone 486,692 12.1% Hispanic 364,453 9.1% Two or more races 273,650 6.8% American Indian alone 268,543 6.7% Black alone 92,672 2.3% Asian alone 10,786 0.3% Other race alone 5,601 0.1% Native Hawaiian and Other
Income and house value in Edmond Median household income in 2022 $111,046 White non-Hispanic householders$66,595 Black householders$77,214 American Indian and Alaska Native householders$94,838 Asian householders$128,618 Some other race householders$84,118 Two or more races householders$80,888 Hispanic or Latino race householdersMedian 2022 house value $347,732 White Non-Hispanic householders$296,259 Black or African American householders$318,193 American Indian or Alaska Native householders $508,876 Asian householders$475,243 Native Hawaiian and other Pacific Islander householders$262,042 Some other race householders$350,071 Two or more races householders$301,523 Hispanic or Latino householders
Median age by race in Edmond
38.5 Median age for White residents38.3 39.1 41.6 Median age for Black or African American residents38.6 56.6 25.3 Median age for American Indian / Alaska Native residents18.6 26.1 33.5 Median age for Asian residents33.6 33.0 -666,666,666.0 Median age for Native Hawaiian / Pacific Islander residents-666,666,666.0 -666,666,666.0 20.4 Median age for Other race residents34.9 17.7 23.3 Median age for Two or more races residents27.6 17.0 38.7 Median age for White alone residents38.5 39.3 29.3 Median age for Hispanic or Latino residents37.0 17.5
Owner/renter occupied households by race in Edmond
House owners and renters - White residents 22,707 78.5% Owner occupied6,215 21.5% Renter occupiedHouse owners and renters - Black or African American residents 426 29.2% Owner occupied1,031 70.8% Renter occupiedHouse owners and renters - American Indian / Alaska Native residents 86 25.7% Owner occupied248 74.3% Renter occupiedHouse owners and renters - Asian residents 543 61.4% Owner occupied341 38.6% Renter occupiedHouse owners and renters - Native Hawaiian / Pacific Islander residents 13 100.0% Owner occupiedHouse owners and renters - Other race residents 306 58.5% Owner occupied217 41.5% Renter occupiedHouse owners and renters - Two or more races residents 1,790 52.1% Owner occupied1,649 47.9% Renter occupiedHouse owners and renters - White alone residents 22,392 79.0% Owner occupied5,950 21.0% Renter occupiedHouse owners and renters - Hispanic or Latino residents 1,295 54.3% Owner occupied1,090 45.7% Renter occupied
Language usage in Edmond
English speakers - Total 93.1% of residents of Edmond speak English at home.
2.8% of residents speak Spanish at home 1,483 60.1% Speak English very well986 39.9% Speak English less than very well4.1% of residents speak other language at home 3,081 84.1% Speak English very well583 15.9% Speak English less than very well
English speakers - Born in the United States 97.1% of residents of Edmond speak English at home.
1.4% of residents speak Spanish at home 228 44.8% Speak English very well281 55.2% Speak English less than very well1.4% of residents speak other language at home 464 91.5% Speak English very well43 8.5% Speak English less than very well
All residents speak only English at home
English speakers - Foreign-born 31.9% of residents of Edmond speak English at home.
20.7% of residents speak Spanish at home 586 53.1% Speak English very well518 46.9% Speak English less than very well47.4% of residents speak other language at home 2,059 81.6% Speak English very well465 18.4% Speak English less than very well
White (Caucasian) - Speak only English Native:
98.5% (66,719)Foreign-born:
49.7% (683)
White (Caucasian) - Speak another language Native:
1.5% (1,006)Foreign-born:
50.3% (690)
Black or African American - Speak only English Native:
98.5% (3,880)Foreign-born:
30.4% (127)
Black or African American - Speak another language Native:
1.6% (62)Foreign-born:
68.0% (285)
Asian - Speak only English Native:
67.1% (712)Foreign-born:
22.4% (456)
Asian - Speak another language Native:
32.9% (349)Foreign-born:
77.6% (1,584)
Other race - Speak only English Native:
70.5% (689)Foreign-born:
7.8% (59)
Other race - Speak another language Native:
23.7% (231)Foreign-born:
92.2% (692)
Two or more races - Speak only English Native:
90.9% (7,262)Foreign-born:
26.5% (274)
Two or more races - Speak another language Native:
9.1% (730)Foreign-born:
73.5% (761)
White alone - Speak only English Native:
98.9% (65,872)Foreign-born:
52.5% (683)
White alone - Speak another language Native:
1.1% (763)Foreign-born:
47.5% (618)
Hispanic or Latino - Speak only English Native:
77.1% (4,090)Foreign-born:
19.9% (274)
Hispanic or Latino - Speak another language Native:
22.9% (1,215)Foreign-born:
80.1% (1,104)
Foreign-born residents in Edmond 5,532 residents are foreign born (3.0% Asia , 1.5% Latin America ).
This city:
5.8%Oklahoma:
6.1%
Marital status for residents in Edmond Marital status - White (Caucasian) population 15 years and over
Males 27.1% Never married64.0% Now married0.6% Separated1.7% Widowed6.6% DivorcedFemales 21.3% Never married62.4% Now married0.6% Separated6.6% Widowed9.1% DivorcedWomen who gave birth in the past 12 months Now married:
88.3% (1,393)Unmarried:
11.7% (185)
Women who did not give birth in the past 12 months Now married:
58.8% (9,013)Unmarried:
41.2% (6,321)
Marital status - Black or African American population 15 years and over
Males 48.5% Never married44.6% Now married0.0% Separated1.7% Widowed5.2% DivorcedFemales 43.4% Never married28.7% Now married14.2% Separated3.7% Widowed9.9% DivorcedWomen who gave birth in the past 12 months Now married:
91.2% (93)Unmarried:
8.8% (9)
Women who did not give birth in the past 12 months Now married:
24.8% (312)Unmarried:
75.2% (949)
Marital status - American Indian / Alaska Native population 15 years and over
Males 53.0% Never married33.4% Now married6.3% Separated0.7% Widowed6.6% DivorcedFemales 25.3% Never married62.1% Now married0.6% Separated8.3% Widowed3.7% DivorcedWomen who gave birth in the past 12 months Now married:
100.0% (12)Unmarried:
0.0% (0)
Women who did not give birth in the past 12 months Now married:
39.9% (151)Unmarried:
60.1% (227)
Marital status - Asian population 15 years and over
Males 24.4% Never married72.2% Now married0.0% Separated0.0% Widowed3.4% DivorcedFemales 33.1% Never married54.3% Now married0.5% Separated2.3% Widowed9.8% DivorcedWomen who gave birth in the past 12 months Now married:
100.0% (98)Unmarried:
0.0% (0)
Women who did not give birth in the past 12 months Now married:
43.3% (416)Unmarried:
56.7% (545)
Marital status - Other race population 15 years and over
Males 31.7% Never married66.2% Now married0.0% Separated0.0% Widowed2.1% DivorcedFemales 40.1% Never married45.0% Now married4.1% Separated7.5% Widowed3.4% DivorcedWomen who did not give birth in the past 12 months Now married:
43.4% (282)Unmarried:
56.6% (369)
Marital status - Two or more races population 15 years and over
Males 32.8% Never married56.6% Now married0.3% Separated0.9% Widowed9.5% DivorcedFemales 42.0% Never married47.6% Now married0.0% Separated2.1% Widowed8.3% DivorcedWomen who gave birth in the past 12 months Now married:
76.1% (188)Unmarried:
23.9% (59)
Women who did not give birth in the past 12 months Now married:
45.7% (1,347)Unmarried:
54.3% (1,599)
Marital status - White alone, not Hispanic / Latino population 15 years and over
Males 27.1% Never married63.9% Now married0.6% Separated1.8% Widowed6.7% DivorcedFemales 21.0% Never married62.6% Now married0.5% Separated6.6% Widowed9.2% DivorcedWomen who gave birth in the past 12 months Now married:
88.3% (1,393)Unmarried:
11.7% (185)
Women who did not give birth in the past 12 months Now married:
59.0% (8,907)Unmarried:
41.0% (6,180)
Marital status - Hispanic or Latino population 15 years and over
Males 38.3% Never married56.9% Now married0.0% Separated0.0% Widowed4.8% DivorcedFemales 40.0% Never married49.4% Now married2.1% Separated3.5% Widowed4.9% DivorcedWomen who gave birth in the past 12 months Now married:
100.0% (89)Unmarried:
0.0% (0)
Women who did not give birth in the past 12 months Now married:
43.3% (691)Unmarried:
56.7% (904)
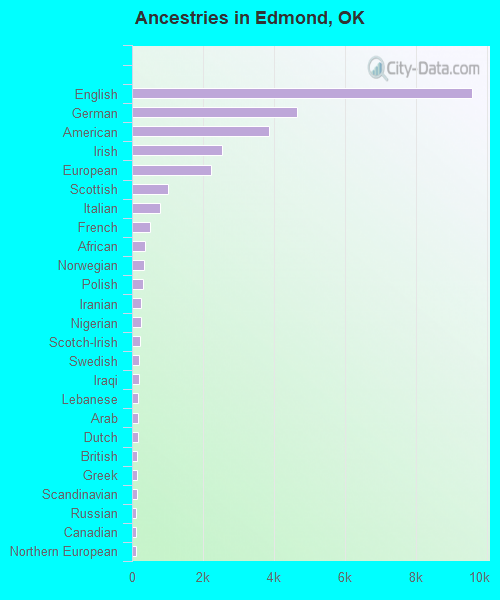
Ancestries in Edmond
9,586 21.6% English4,652 10.5% German3,856 8.7% American2,527 5.7% Irish2,223 5.0% European1,025 2.3% Scottish793 1.8% Italian509 1.1% French369 0.8% African335 0.8% Norwegian308 0.7% Polish258 0.6% Iranian257 0.6% Nigerian237 0.5% Scotch-Irish211 0.5% Swedish198 0.4% Iraqi183 0.4% Lebanese166 0.4% Arab166 0.4% Dutch144 0.3% British142 0.3% Greek131 0.3% Scandinavian124 0.3% Russian110 0.2% Canadian101 0.2% Northern European94 0.2% Czech84 0.2% French Canadian78 0.2% Ghanaian77 0.2% Welsh75 0.2% Hungarian64 0.1% Portuguese59 0.1% Danish54 0.1% Eastern European53 0.1% Lithuanian52 0.1% Turkish46 0.1% Moroccan44 0.10% Slovak23 0.05% Romanian21 0.05% Croatian18 0.04% Czechoslovakian15 0.03% Brazilian15 0.03% Ethiopian15 0.03% Slovene15 0.03% Egyptian12 0.03% Ugandan10 0.02% Slavic9 0.02% Kenyan7 0.02% Armenian7 0.02% Ukrainian6 0.01% Austrian6 0.01% Swiss6 0.01% British West Indian
Geographical mobility in Edmond Same house 1 year ago 62,927 86.3% White (Caucasian)3,274 80.9% Black or African American1,362 82.2% American Indian / Alaska Native2,525 81.7% Asian24 100.0% Native Hawaiian / Pacific Islander1,333 73.3% Other race10,109 76.1% Two or more races62,177 86.8% White alone, not Hispanic / Latino4,252 60.9% Hispanic or LatinoMoved within same county 4,922 6.7% White / Caucasian507 12.5% Black or African American163 9.8% American Indian / Alaska Native462 14.9% Asian144 7.9% Other race1,682 12.7% Two or more races4,778 6.7% White alone, not Hispanic / Latino1,033 14.8% Hispanic or LatinoMoved within same state 2,427 3.3% White / Caucasian65 1.6% Black or African American96 5.8% American Indian / Alaska Native5 0.2% Asian4 0.2% Other race526 4.0% Two or more races2,427 3.4% White alone, not Hispanic / Latino39 0.6% Hispanic or LatinoMoved from different state 2,233 3.1% White / Caucasian199 4.9% Black or African American33 2.0% American Indian / Alaska Native153 4.9% Asian533 29.3% Other race660 5.0% Two or more races2,059 2.9% White alone, not Hispanic / Latino1,240 17.8% Hispanic or LatinoMoved from abroad 421 0.6% White10 0.6% American Indian / Alaska Native8 0.3% Asian130 1.0% Two or more races193 0.3% White alone, not Hispanic / Latino415 5.9% Hispanic or Latino
Children Nativity (place of birth) in Edmond
Children under 6 years - Living with two parents Both parents native 4,911 100.0% NativeBoth parents foreign-born 250 86.6% Native39 13.4% Foreign-bornOne native, one foreign-born parent 427 100.0% NativeChildren under 6 years - Living with one parent Native parent 1,423 100.0% NativeForeign-born parent 69 63.0% Native41 37.0% Foreign-bornChildren 6 to 17 years - Living with two parents Both parents native 10,586 99.3% Native75 0.7% Foreign-bornBoth parents foreign-born 388 84.4% Native72 15.6% Foreign-bornOne native, one foreign-born parent 351 100.0% NativeChildren 6 to 17 years - Living with one parent Native parent 3,610 98.2% Native65 1.8% Foreign-bornForeign-born parent 226 73.5% Native82 26.5% Foreign-born
Grandparents responsible for own grandchildren in Edmond
Grandparents (30 to 59 years) White / Caucasian 80 27.4% Responsible for grandchildren212 72.6% Not responsible for grandchildrenAsian 23 100.0% Not responsible for grandchildrenOther race 8 100.0% Responsible for grandchildrenTwo or more races 44 74.9% Responsible for grandchildren15 25.1% Not responsible for grandchildrenWhite alone, not Hispanic / Latino 107 34.2% Responsible for grandchildren205 65.8% Not responsible for grandchildrenHispanic or Latino 36 34.9% Responsible for grandchildren67 65.1% Not responsible for grandchildrenGrandparents (60 years and over) White / Caucasian 331 77.0% Responsible for grandchildren99 23.0% Not responsible for grandchildrenAsian 129 100.0% Not responsible for grandchildrenOther race 7 17.3% Responsible for grandchildren34 82.7% Not responsible for grandchildrenTwo or more races 25 38.7% Responsible for grandchildren39 61.3% Not responsible for grandchildrenWhite alone, not Hispanic / Latino 154 27.8% Responsible for grandchildren399 72.2% Not responsible for grandchildrenHispanic or Latino 41 53.6% Responsible for grandchildren36 46.4% Not responsible for grandchildren