Races in Edgewood, Washington (WA) Detailed Stats
Data:
Races - White alone (%)
Races - White alone (% change since 2000)
Races - Black alone (%)
Races - Black alone (% change since 2000)
Races - American Indian alone (%)
Races - American Indian alone (% change since 2000)
Races - Asian alone (%)
Races - Asian alone (% change since 2000)
Races - Hispanic (%)
Races - Hispanic (% change since 2000)
Races - Native Hawaiian and Other Pacific Islander alone (%)
Races - Native Hawaiian and Other Pacific Islander alone (% change since 2000)
Races - Two or more races(%)
Races - Two or more races(% change since 2000)
Races - Other race alone (%)
Races - Other race alone (% change since 2000)
Racial diversity
Place of birth - Born in state of residence (%)
Place of birth - Born in state of residence (%) - White
Place of birth - Born in state of residence (%) - Black or African American
Place of birth - Born in state of residence (%) - Asian
Place of birth - Born in state of residence (%) - Hispanic or Latino
Place of birth - Born in state of residence (%) - American Indian and Alaska Native
Place of birth - Born in state of residence (%) - Multirace
Place of birth - Born in state of residence (%) - Other Race
Place of birth - Born in other state (%)
Place of birth - Born in other state (%) - White
Place of birth - Born in other state (%) - Black or African American
Place of birth - Born in other state (%) - Asian
Place of birth - Born in other state (%) - Hispanic or Latino
Place of birth - Born in other state (%) - American Indian and Alaska Native
Place of birth - Born in other state (%) - Multirace
Place of birth - Born in other state (%) - Other Race
Place of birth - Native, outside of US (%)
Place of birth - Native, outside of US (%) - White
Place of birth - Native, outside of US (%) - Black or African American
Place of birth - Native, outside of US (%) - Asian
Place of birth - Native, outside of US (%) - Hispanic or Latino
Place of birth - Native, outside of US (%) - American Indian and Alaska Native
Place of birth - Native, outside of US (%) - Multirace
Place of birth - Native, outside of US (%) - Other Race
Place of birth - Foreign born (%)
Place of birth - Foreign born (%) - White
Place of birth - Foreign born (%) - Black or African American
Place of birth - Foreign born (%) - Asian
Place of birth - Foreign born (%) - Hispanic or Latino
Place of birth - Foreign born (%) - American Indian and Alaska Native
Place of birth - Foreign born (%) - Multirace
Place of birth - Foreign born (%) - Other Race
Residents speaking English at home (%)
Residents speaking English at home - Born in the United States (%)
Residents speaking English at home - Native, born elsewhere (%)
Residents speaking English at home - Foreign born (%)
Residents speaking Spanish at home (%)
Residents speaking Spanish at home - Born in the United States (%)
Residents speaking Spanish at home - Native, born elsewhere (%)
Residents speaking Spanish at home - Foreign born (%)
Residents speaking other language at home (%)
Residents speaking other language at home - Born in the United States (%)
Residents speaking other language at home - Native, born elsewhere (%)
Residents speaking other language at home - Foreign born (%)
Marital status - Never married (%)
Marital status - Now married (%)
Marital status - Separated (%)
Marital status - Widowed (%)
Marital status - Divorced (%)
Ancestries Reported - Arab (%)
Ancestries Reported - Czech (%)
Ancestries Reported - Danish (%)
Ancestries Reported - Dutch (%)
Ancestries Reported - English (%)
Ancestries Reported - French (%)
Ancestries Reported - French Canadian (%)
Ancestries Reported - German (%)
Ancestries Reported - Greek (%)
Ancestries Reported - Hungarian (%)
Ancestries Reported - Irish (%)
Ancestries Reported - Italian (%)
Ancestries Reported - Lithuanian (%)
Ancestries Reported - Norwegian (%)
Ancestries Reported - Polish (%)
Ancestries Reported - Portuguese (%)
Ancestries Reported - Russian (%)
Ancestries Reported - Scotch-Irish (%)
Ancestries Reported - Scottish (%)
Ancestries Reported - Slovak (%)
Ancestries Reported - Subsaharan African (%)
Ancestries Reported - Swedish (%)
Ancestries Reported - Swiss (%)
Ancestries Reported - Ukrainian (%)
Ancestries Reported - United States (%)
Ancestries Reported - Welsh (%)
Ancestries Reported - West Indian (%)
Ancestries Reported - Other (%)
Geographical mobility - Same house 1 year ago (%)
Geographical mobility - Same house 1 year ago (%) - White
Geographical mobility - Same house 1 year ago (%) - Black or African American
Geographical mobility - Same house 1 year ago (%) - Asian
Geographical mobility - Same house 1 year ago (%) - Hispanic or Latino
Geographical mobility - Same house 1 year ago (%) - American Indian and Alaska Native
Geographical mobility - Same house 1 year ago (%) - Multirace
Geographical mobility - Same house 1 year ago (%) - Other Race
Geographical mobility - Moved within same county (%)
Geographical mobility - Moved within same county (%) - White
Geographical mobility - Moved within same county (%) - Black or African American
Geographical mobility - Moved within same county (%) - Asian
Geographical mobility - Moved within same county (%) - Hispanic or Latino
Geographical mobility - Moved within same county (%) - American Indian and Alaska Native
Geographical mobility - Moved within same county (%) - Multirace
Geographical mobility - Moved within same county (%) - Other Race
Geographical mobility - Moved from different county within same state (%)
Geographical mobility - Moved from different county within same state (%) - White
Geographical mobility - Moved from different county within same state (%) - Black or African American
Geographical mobility - Moved from different county within same state (%) - Asian
Geographical mobility - Moved from different county within same state (%) - Hispanic or Latino
Geographical mobility - Moved from different county within same state (%) - American Indian and Alaska Native
Geographical mobility - Moved from different county within same state (%) - Multirace
Geographical mobility - Moved from different county within same state (%) - Other Race
Geographical mobility - Moved from different state (%)
Geographical mobility - Moved from different state (%) - White
Geographical mobility - Moved from different state (%) - Black or African American
Geographical mobility - Moved from different state (%) - Asian
Geographical mobility - Moved from different state (%) - Hispanic or Latino
Geographical mobility - Moved from different state (%) - American Indian and Alaska Native
Geographical mobility - Moved from different state (%) - Multirace
Geographical mobility - Moved from different state (%) - Other Race
Geographical mobility - Moved from abroad (%)
Geographical mobility - Moved from abroad (%) - White
Geographical mobility - Moved from abroad (%) - Black or African American
Geographical mobility - Moved from abroad (%) - Asian
Geographical mobility - Moved from abroad (%) - Hispanic or Latino
Geographical mobility - Moved from abroad (%) - American Indian and Alaska Native
Geographical mobility - Moved from abroad (%) - Multirace
Geographical mobility - Moved from abroad (%) - Other Race
Place of birth for the foreign-born population - Ireland (%)
Place of birth for the foreign-born population - Denmark (%)
Place of birth for the foreign-born population - Norway (%)
Place of birth for the foreign-born population - Sweden (%)
Place of birth for the foreign-born population - United Kingdom (%)
Place of birth for the foreign-born population - England (%)
Place of birth for the foreign-born population - Scotland (%)
Place of birth for the foreign-born population - Other Northern Europe (%)
Place of birth for the foreign-born population - Austria (%)
Place of birth for the foreign-born population - Belgium (%)
Place of birth for the foreign-born population - France (%)
Place of birth for the foreign-born population - Germany (%)
Place of birth for the foreign-born population - Netherlands (%)
Place of birth for the foreign-born population - Switzerland (%)
Place of birth for the foreign-born population - Other Western Europe (%)
Place of birth for the foreign-born population - Greece (%)
Place of birth for the foreign-born population - Italy (%)
Place of birth for the foreign-born population - Portugal (%)
Place of birth for the foreign-born population - Spain (%)
Place of birth for the foreign-born population - Other Southern Europe (%)
Place of birth for the foreign-born population - Albania (%)
Place of birth for the foreign-born population - Belarus (%)
Place of birth for the foreign-born population - Bosnia and Herzegovina (%)
Place of birth for the foreign-born population - Bulgaria (%)
Place of birth for the foreign-born population - Croatia (%)
Place of birth for the foreign-born population - Czechoslovakia (%)
Place of birth for the foreign-born population - Hungary (%)
Place of birth for the foreign-born population - Latvia (%)
Place of birth for the foreign-born population - Lithuania (%)
Place of birth for the foreign-born population - North Macedonia (Macedonia) (%)
Place of birth for the foreign-born population - Moldova (%)
Place of birth for the foreign-born population - Poland (%)
Place of birth for the foreign-born population - Romania (%)
Place of birth for the foreign-born population - Russia (%)
Place of birth for the foreign-born population - Serbia (%)
Place of birth for the foreign-born population - Ukraine (%)
Place of birth for the foreign-born population - Other Eastern Europe (%)
Place of birth for the foreign-born population - China (%)
Place of birth for the foreign-born population - Hong Kong (%)
Place of birth for the foreign-born population - Taiwan (%)
Place of birth for the foreign-born population - Japan (%)
Place of birth for the foreign-born population - Korea (%)
Place of birth for the foreign-born population - Other Eastern Asia (%)
Place of birth for the foreign-born population - Afghanistan (%)
Place of birth for the foreign-born population - Bangladesh (%)
Place of birth for the foreign-born population - India (%)
Place of birth for the foreign-born population - Iran (%)
Place of birth for the foreign-born population - Kazakhstan (%)
Place of birth for the foreign-born population - Nepal (%)
Place of birth for the foreign-born population - Pakistan (%)
Place of birth for the foreign-born population - Sri Lanka (%)
Place of birth for the foreign-born population - Uzbekistan (%)
Place of birth for the foreign-born population - Other South Central Asia (%)
Place of birth for the foreign-born population - Burma (%)
Place of birth for the foreign-born population - Cambodia (%)
Place of birth for the foreign-born population - Indonesia (%)
Place of birth for the foreign-born population - Laos (%)
Place of birth for the foreign-born population - Malaysia (%)
Place of birth for the foreign-born population - Philippines (%)
Place of birth for the foreign-born population - Singapore (%)
Place of birth for the foreign-born population - Thailand (%)
Place of birth for the foreign-born population - Vietnam (%)
Place of birth for the foreign-born population - Other South Eastern Asia (%)
Place of birth for the foreign-born population - Armenia (%)
Place of birth for the foreign-born population - Iraq (%)
Place of birth for the foreign-born population - Israel (%)
Place of birth for the foreign-born population - Jordan (%)
Place of birth for the foreign-born population - Kuwait (%)
Place of birth for the foreign-born population - Lebanon (%)
Place of birth for the foreign-born population - Saudi Arabia (%)
Place of birth for the foreign-born population - Syria (%)
Place of birth for the foreign-born population - Turkey (%)
Place of birth for the foreign-born population - Yemen (%)
Place of birth for the foreign-born population - Other Western Asia (%)
Place of birth for the foreign-born population - Eritrea (%)
Place of birth for the foreign-born population - Ethiopia (%)
Place of birth for the foreign-born population - Kenya (%)
Place of birth for the foreign-born population - Somalia (%)
Place of birth for the foreign-born population - Uganda (%)
Place of birth for the foreign-born population - Zimbabwe (%)
Place of birth for the foreign-born population - Other Eastern Africa (%)
Place of birth for the foreign-born population - Cameroon (%)
Place of birth for the foreign-born population - Congo (%)
Place of birth for the foreign-born population - Democratic Republic of Congo (Zaire) (%)
Place of birth for the foreign-born population - Other Middle Africa (%)
Place of birth for the foreign-born population - Egypt (%)
Place of birth for the foreign-born population - Morocco (%)
Place of birth for the foreign-born population - Sudan (%)
Place of birth for the foreign-born population - Other Northern Africa (%)
Place of birth for the foreign-born population - South Africa (%)
Place of birth for the foreign-born population - Other Southern Africa (%)
Place of birth for the foreign-born population - Cabo Verde (%)
Place of birth for the foreign-born population - Ghana (%)
Place of birth for the foreign-born population - Liberia (%)
Place of birth for the foreign-born population - Nigeria (%)
Place of birth for the foreign-born population - Senegal (%)
Place of birth for the foreign-born population - Sierra Leone (%)
Place of birth for the foreign-born population - Other Western Africa (%)
Place of birth for the foreign-born population - Australia (%)
Place of birth for the foreign-born population - New Zealand (%)
Place of birth for the foreign-born population - Fiji (%)
Place of birth for the foreign-born population - Micronesia (%)
Place of birth for the foreign-born population - Bahamas (%)
Place of birth for the foreign-born population - Barbados (%)
Place of birth for the foreign-born population - Cuba (%)
Place of birth for the foreign-born population - Dominica (%)
Place of birth for the foreign-born population - Dominican Republic (%)
Place of birth for the foreign-born population - Grenada (%)
Place of birth for the foreign-born population - Haiti (%)
Place of birth for the foreign-born population - Jamaica (%)
Place of birth for the foreign-born population - St. Vincent and the Grenadines (%)
Place of birth for the foreign-born population - Trinidad and Tobago (%)
Place of birth for the foreign-born population - West Indies (%)
Place of birth for the foreign-born population - Other Caribbean (%)
Place of birth for the foreign-born population - Belize (%)
Place of birth for the foreign-born population - Costa Rica (%)
Place of birth for the foreign-born population - El Salvador (%)
Place of birth for the foreign-born population - Guatemala (%)
Place of birth for the foreign-born population - Honduras (%)
Place of birth for the foreign-born population - Mexico (%)
Place of birth for the foreign-born population - Nicaragua (%)
Place of birth for the foreign-born population - Panama (%)
Place of birth for the foreign-born population - Other Central America (%)
Place of birth for the foreign-born population - Argentina (%)
Place of birth for the foreign-born population - Bolivia (%)
Place of birth for the foreign-born population - Brazil (%)
Place of birth for the foreign-born population - Chile (%)
Place of birth for the foreign-born population - Colombia (%)
Place of birth for the foreign-born population - Ecuador (%)
Place of birth for the foreign-born population - Guyana (%)
Place of birth for the foreign-born population - Peru (%)
Place of birth for the foreign-born population - Uruguay (%)
Place of birth for the foreign-born population - Venezuela (%)
Place of birth for the foreign-born population - Other South America (%)
Place of birth for the foreign-born population - Canada (%)
Place of birth for the foreign-born population - Other Northern America (%)
Place of birth for the foreign-born population - Other (%)
Latest news about races in Edgewood, WA collected exclusively by city-data.com from local newspapers, TV, and radio stations
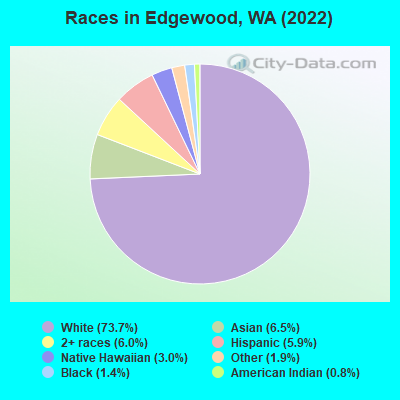
According to 2022 data, the most numerous races in Edgewood, WA are White alone (9,219 residents), Hispanic (733 residents), and Asian alone (818 residents). 79.9% of Edgewood residents speak English at home. 15.6% of Edgewood, WA residents are foreign-born (5.7% born in Asia, 4.6% born in Europe, 1.9% born in Latin America, 1.7% born in Oceania), which is 3.8% greater than the foreign-born rate of 15.0% across the entire state of Washington.
Race distribution in Edgewood
2000 2022
4,652,490 78.9% White alone 441,509 7.5% Hispanic 319,401 5.4% Asian alone 184,631 3.1% Black alone 175,926 3.0% Two or more races 85,396 1.4% American Indian alone 22,779 0.4% Native Hawaiian and Other 11,989 0.2% Other race alone
4,941,456 63.5% White alone 1,093,313 14.0% Hispanic 755,832 9.7% Asian alone 523,448 6.7% Two or more races 299,537 3.8% Black alone 69,024 0.9% American Indian alone 52,231 0.7% Native Hawaiian and Other 50,945 0.7% Other race alone
Income and house value in Edgewood Median household income in 2022 $117,422 White non-Hispanic householdersover $200,000 Black householdersover $200,000 Asian householders$74,969 Native Hawaiian and other Pacific Islander householders$121,019 Two or more races householders$107,661 Hispanic or Latino race householdersMedian 2022 house value $738,202 White Non-Hispanic householders$729,257 Black or African American householders$408,384 American Indian or Alaska Native householders $826,491 Asian householders$632,023 Native Hawaiian and other Pacific Islander householders$690,363 Some other race householders$875,108 Two or more races householders$571,348 Hispanic or Latino householders
Median age by race in Edgewood
44.8 Median age for White residents45.1 44.7 60.7 Median age for Black or African American residents63.8 61.0 37.2 Median age for American Indian / Alaska Native residents-622,057,000.6 35.9 41.2 Median age for Asian residents42.0 40.8 17.3 Median age for Native Hawaiian / Pacific Islander residents41.2 14.3 15.0 Median age for Other race residents13.1 36.5 24.5 Median age for Two or more races residents30.9 19.8 45.2 Median age for White alone residents46.5 44.5 36.3 Median age for Hispanic or Latino residents40.6 27.2
Owner/renter occupied households by race in Edgewood
House owners and renters - White residents 2,749 72.4% Owner occupied1,046 27.6% Renter occupiedHouse owners and renters - Black or African American residents 48 84.3% Owner occupied9 15.7% Renter occupiedHouse owners and renters - American Indian / Alaska Native residents 28 100.0% Renter occupiedHouse owners and renters - Asian residents 283 92.2% Owner occupied24 7.8% Renter occupiedHouse owners and renters - Native Hawaiian / Pacific Islander residents 119 100.0% Renter occupiedHouse owners and renters - Other race residents 48 100.0% Owner occupiedHouse owners and renters - Two or more races residents 90 44.6% Owner occupied112 55.4% Renter occupiedHouse owners and renters - White alone residents 2,764 73.0% Owner occupied1,024 27.0% Renter occupiedHouse owners and renters - Hispanic or Latino residents 37 24.9% Owner occupied112 75.1% Renter occupied
Language usage in Edgewood
English speakers - Total 79.9% of residents of Edgewood speak English at home.
3.5% of residents speak Spanish at home 376 90.2% Speak English very well41 9.8% Speak English less than very well17.1% of residents speak other language at home 1,293 63.4% Speak English very well745 36.6% Speak English less than very well
English speakers - Born in the United States 93.6% of residents of Edgewood speak English at home.
4.0% of residents speak Spanish at home 121 97.6% Speak English very well3 2.4% Speak English less than very well2.2% of residents speak other language at home 70 100.0% Speak English very well
English speakers - Native, born elsewhere 73.5% of residents of Edgewood speak English at home.
30.5% of residents speak other language at home 131 100.0% Speak English very well
English speakers - Foreign-born 16.7% of residents of Edgewood speak English at home.
10.0% of residents speak Spanish at home 177 87.6% Speak English very well25 12.4% Speak English less than very well74.7% of residents speak other language at home 761 50.7% Speak English very well741 49.3% Speak English less than very well
White (Caucasian) - Speak only English Native:
94.8% (7,631)Foreign-born:
21.1% (163)
White (Caucasian) - Speak another language Native:
4.4% (353)Foreign-born:
80.5% (623)
Black or African American - Speak only English Native:
99.6% (130)Foreign-born:
7.2% (4)
Asian - Speak only English Native:
60.5% (70)Foreign-born:
3.5% (25)
Asian - Speak another language Native:
38.9% (45)Foreign-born:
91.7% (661)
Native Hawaiian / Pacific Islander - Speak only English Native:
96.0% (136)Foreign-born:
76.7% (137)
Other race - Speak another language Native:
32.5% (73)Foreign-born:
99.0% (10)
Two or more races - Speak another language Native:
14.7% (150)Foreign-born:
100.0% (184)
White alone - Speak only English Native:
94.1% (7,559)Foreign-born:
19.9% (152)
White alone - Speak another language Native:
5.1% (412)Foreign-born:
84.6% (647)
Hispanic or Latino - Speak only English Native:
75.6% (323)Foreign-born:
10.4% (26)
Hispanic or Latino - Speak another language Native:
25.6% (109)Foreign-born:
89.0% (224)
Foreign-born residents in Edgewood 1,951 residents are foreign born (5.7% Asia , 4.6% Europe , 1.9% Latin America , 1.7% Oceania ).
This city:
15.6%Washington:
14.9%
Marital status for residents in Edgewood Marital status - White (Caucasian) population 15 years and over
Males 23.3% Never married63.0% Now married0.4% Separated1.7% Widowed11.5% DivorcedFemales 23.6% Never married55.9% Now married2.4% Separated8.7% Widowed9.4% DivorcedWomen who gave birth in the past 12 months Now married:
47.1% (38)Unmarried:
52.9% (42)
Women who did not give birth in the past 12 months Now married:
61.0% (1,226)Unmarried:
39.0% (784)
Marital status - Black or African American population 15 years and over
Males 22.9% Never married60.6% Now married4.6% Separated0.0% Widowed11.9% DivorcedFemales 12.5% Never married76.4% Now married0.0% Separated0.0% Widowed11.1% DivorcedWomen who gave birth in the past 12 months Now married:
100.0% (15)Unmarried:
0.0% (0)
Women who did not give birth in the past 12 months Now married:
0.0% (0)Unmarried:
100.0% (9)
Marital status - Asian population 15 years and over
Males 42.3% Never married56.5% Now married0.0% Separated0.5% Widowed0.8% DivorcedFemales 36.2% Never married50.4% Now married0.0% Separated3.8% Widowed9.6% DivorcedWomen who did not give birth in the past 12 months Now married:
32.4% (75)Unmarried:
67.6% (156)
Marital status - Native Hawaiian / Pacific Islander population 15 years and over
Males 19.4% Never married80.6% Now married0.0% Separated0.0% Widowed0.0% DivorcedFemales 48.7% Never married51.3% Now married0.0% Separated0.0% Widowed0.0% DivorcedWomen who did not give birth in the past 12 months Now married:
51.3% (68)Unmarried:
48.7% (64)
Marital status - Other race population 15 years and over
Males 0.0% Never married100.0% Now married0.0% Separated0.0% Widowed0.0% DivorcedFemales 35.2% Never married64.8% Now married0.0% Separated0.0% Widowed0.0% DivorcedWomen who did not give birth in the past 12 months Now married:
63.2% (47)Unmarried:
36.8% (27)
Marital status - Two or more races population 15 years and over
Males 20.5% Never married64.0% Now married0.0% Separated0.0% Widowed15.5% DivorcedFemales 40.6% Never married50.2% Now married0.0% Separated0.0% Widowed9.2% DivorcedWomen who gave birth in the past 12 months Now married:
100.0% (16)Unmarried:
0.0% (0)
Women who did not give birth in the past 12 months Now married:
46.2% (145)Unmarried:
53.8% (168)
Marital status - White alone, not Hispanic / Latino population 15 years and over
Males 24.2% Never married62.1% Now married0.4% Separated1.8% Widowed11.5% DivorcedFemales 23.0% Never married56.2% Now married2.5% Separated8.9% Widowed9.4% DivorcedWomen who gave birth in the past 12 months Now married:
47.1% (39)Unmarried:
52.9% (43)
Women who did not give birth in the past 12 months Now married:
62.2% (1,248)Unmarried:
37.8% (759)
Marital status - Hispanic or Latino population 15 years and over
Males 0.0% Never married87.9% Now married0.0% Separated0.0% Widowed12.1% DivorcedFemales 33.9% Never married62.7% Now married0.0% Separated0.8% Widowed2.5% DivorcedWomen who gave birth in the past 12 months Now married:
100.0% (13)Unmarried:
0.0% (0)
Women who did not give birth in the past 12 months Now married:
54.0% (103)Unmarried:
46.0% (88)
Ancestries in Edgewood
783 15.2% German533 10.3% Ukrainian365 7.1% English318 6.2% American248 4.8% European201 3.9% Irish154 3.0% Norwegian134 2.6% Armenian85 1.6% French65 1.3% Scandinavian56 1.1% Italian53 1.0% African49 1.0% Portuguese48 0.9% Swedish44 0.9% Scottish29 0.6% Welsh26 0.5% Austrian24 0.5% Russian23 0.4% Dutch22 0.4% Swiss18 0.3% Polish16 0.3% Finnish15 0.3% Czech12 0.2% Northern European10 0.2% French Canadian5 0.10% Canadian5 0.10% Greek
Children Nativity (place of birth) in Edgewood
Children under 6 years - Living with two parents Both parents native 338 100.0% NativeBoth parents foreign-born 111 100.0% NativeOne native, one foreign-born parent 78 100.0% NativeChildren under 6 years - Living with one parent Native parent 66 100.0% NativeForeign-born parent 42 100.0% NativeChildren 6 to 17 years - Living with two parents Both parents native 936 100.0% NativeBoth parents foreign-born 134 56.0% Native105 44.0% Foreign-bornOne native, one foreign-born parent 396 100.0% NativeChildren 6 to 17 years - Living with one parent Native parent 428 98.7% Native6 1.3% Foreign-bornForeign-born parent 158 65.8% Native82 34.2% Foreign-born
Grandparents responsible for own grandchildren in Edgewood
Grandparents (30 to 59 years) Two or more races 24 100.0% Not responsible for grandchildrenHispanic or Latino 17 100.0% Not responsible for grandchildren
Grandparents (60 years and over)