Races in Edgewater, Florida (FL) Detailed Stats
Data:
Races - White alone (%)
Races - White alone (% change since 2000)
Races - Black alone (%)
Races - Black alone (% change since 2000)
Races - American Indian alone (%)
Races - American Indian alone (% change since 2000)
Races - Asian alone (%)
Races - Asian alone (% change since 2000)
Races - Hispanic (%)
Races - Hispanic (% change since 2000)
Races - Native Hawaiian and Other Pacific Islander alone (%)
Races - Native Hawaiian and Other Pacific Islander alone (% change since 2000)
Races - Two or more races(%)
Races - Two or more races(% change since 2000)
Races - Other race alone (%)
Races - Other race alone (% change since 2000)
Racial diversity
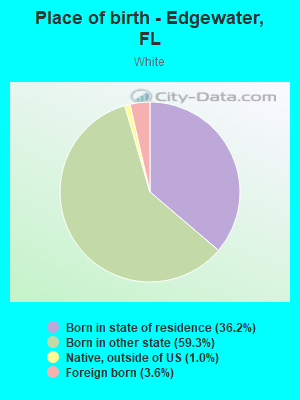
Place of birth - Born in state of residence (%)
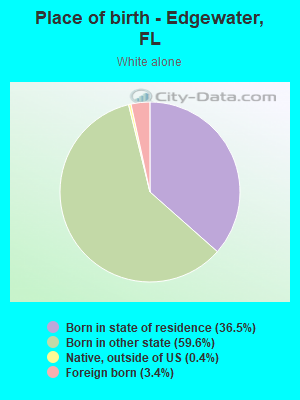
Place of birth - Born in state of residence (%) - White
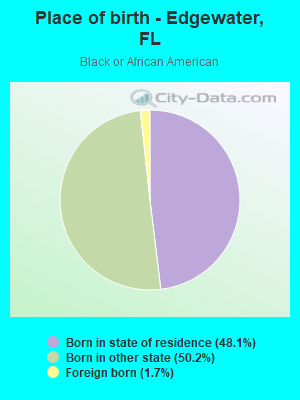
Place of birth - Born in state of residence (%) - Black or African American
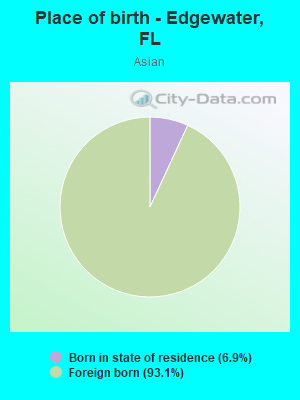
Place of birth - Born in state of residence (%) - Asian
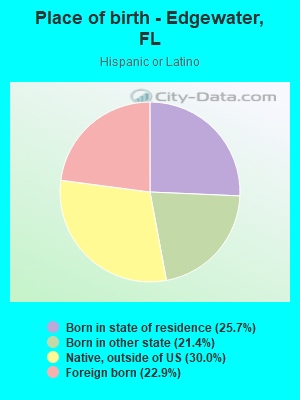
Place of birth - Born in state of residence (%) - Hispanic or Latino
Place of birth - Born in state of residence (%) - American Indian and Alaska Native
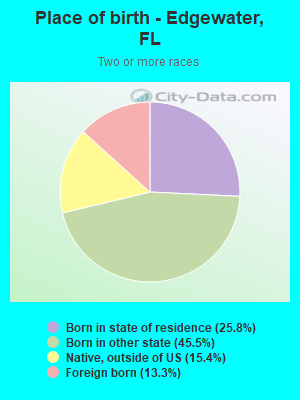
Place of birth - Born in state of residence (%) - Multirace
Place of birth - Born in state of residence (%) - Other Race
Place of birth - Born in other state (%)
Place of birth - Born in other state (%) - White
Place of birth - Born in other state (%) - Black or African American
Place of birth - Born in other state (%) - Asian
Place of birth - Born in other state (%) - Hispanic or Latino
Place of birth - Born in other state (%) - American Indian and Alaska Native
Place of birth - Born in other state (%) - Multirace
Place of birth - Born in other state (%) - Other Race
Place of birth - Native, outside of US (%)
Place of birth - Native, outside of US (%) - White
Place of birth - Native, outside of US (%) - Black or African American
Place of birth - Native, outside of US (%) - Asian
Place of birth - Native, outside of US (%) - Hispanic or Latino
Place of birth - Native, outside of US (%) - American Indian and Alaska Native
Place of birth - Native, outside of US (%) - Multirace
Place of birth - Native, outside of US (%) - Other Race
Place of birth - Foreign born (%)
Place of birth - Foreign born (%) - White
Place of birth - Foreign born (%) - Black or African American
Place of birth - Foreign born (%) - Asian
Place of birth - Foreign born (%) - Hispanic or Latino
Place of birth - Foreign born (%) - American Indian and Alaska Native
Place of birth - Foreign born (%) - Multirace
Place of birth - Foreign born (%) - Other Race
Residents speaking English at home (%)
Residents speaking English at home - Born in the United States (%)
Residents speaking English at home - Native, born elsewhere (%)
Residents speaking English at home - Foreign born (%)
Residents speaking Spanish at home (%)
Residents speaking Spanish at home - Born in the United States (%)
Residents speaking Spanish at home - Native, born elsewhere (%)
Residents speaking Spanish at home - Foreign born (%)
Residents speaking other language at home (%)
Residents speaking other language at home - Born in the United States (%)
Residents speaking other language at home - Native, born elsewhere (%)
Residents speaking other language at home - Foreign born (%)
Marital status - Never married (%)
Marital status - Now married (%)
Marital status - Separated (%)
Marital status - Widowed (%)
Marital status - Divorced (%)
Ancestries Reported - Arab (%)
Ancestries Reported - Czech (%)
Ancestries Reported - Danish (%)
Ancestries Reported - Dutch (%)
Ancestries Reported - English (%)
Ancestries Reported - French (%)
Ancestries Reported - French Canadian (%)
Ancestries Reported - German (%)
Ancestries Reported - Greek (%)
Ancestries Reported - Hungarian (%)
Ancestries Reported - Irish (%)
Ancestries Reported - Italian (%)
Ancestries Reported - Lithuanian (%)
Ancestries Reported - Norwegian (%)
Ancestries Reported - Polish (%)
Ancestries Reported - Portuguese (%)
Ancestries Reported - Russian (%)
Ancestries Reported - Scotch-Irish (%)
Ancestries Reported - Scottish (%)
Ancestries Reported - Slovak (%)
Ancestries Reported - Subsaharan African (%)
Ancestries Reported - Swedish (%)
Ancestries Reported - Swiss (%)
Ancestries Reported - Ukrainian (%)
Ancestries Reported - United States (%)
Ancestries Reported - Welsh (%)
Ancestries Reported - West Indian (%)
Ancestries Reported - Other (%)
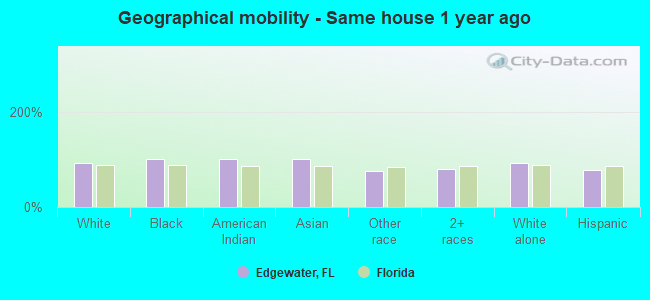
Geographical mobility - Same house 1 year ago (%)
Geographical mobility - Same house 1 year ago (%) - White
Geographical mobility - Same house 1 year ago (%) - Black or African American
Geographical mobility - Same house 1 year ago (%) - Asian
Geographical mobility - Same house 1 year ago (%) - Hispanic or Latino
Geographical mobility - Same house 1 year ago (%) - American Indian and Alaska Native
Geographical mobility - Same house 1 year ago (%) - Multirace
Geographical mobility - Same house 1 year ago (%) - Other Race
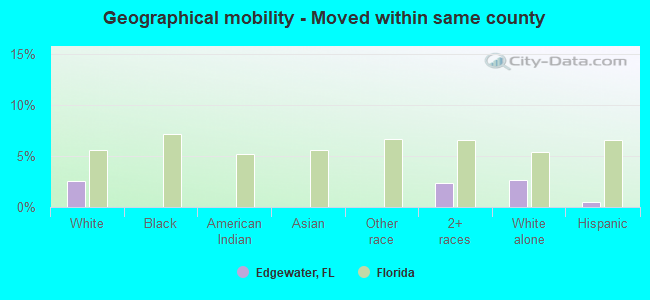
Geographical mobility - Moved within same county (%)
Geographical mobility - Moved within same county (%) - White
Geographical mobility - Moved within same county (%) - Black or African American
Geographical mobility - Moved within same county (%) - Asian
Geographical mobility - Moved within same county (%) - Hispanic or Latino
Geographical mobility - Moved within same county (%) - American Indian and Alaska Native
Geographical mobility - Moved within same county (%) - Multirace
Geographical mobility - Moved within same county (%) - Other Race
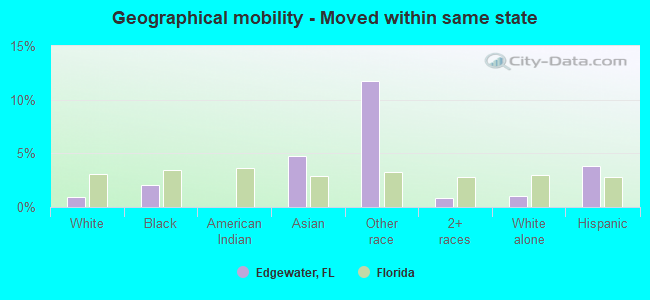
Geographical mobility - Moved from different county within same state (%)
Geographical mobility - Moved from different county within same state (%) - White
Geographical mobility - Moved from different county within same state (%) - Black or African American
Geographical mobility - Moved from different county within same state (%) - Asian
Geographical mobility - Moved from different county within same state (%) - Hispanic or Latino
Geographical mobility - Moved from different county within same state (%) - American Indian and Alaska Native
Geographical mobility - Moved from different county within same state (%) - Multirace
Geographical mobility - Moved from different county within same state (%) - Other Race
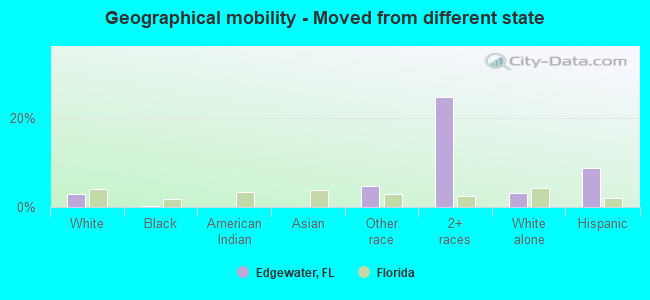
Geographical mobility - Moved from different state (%)
Geographical mobility - Moved from different state (%) - White
Geographical mobility - Moved from different state (%) - Black or African American
Geographical mobility - Moved from different state (%) - Asian
Geographical mobility - Moved from different state (%) - Hispanic or Latino
Geographical mobility - Moved from different state (%) - American Indian and Alaska Native
Geographical mobility - Moved from different state (%) - Multirace
Geographical mobility - Moved from different state (%) - Other Race
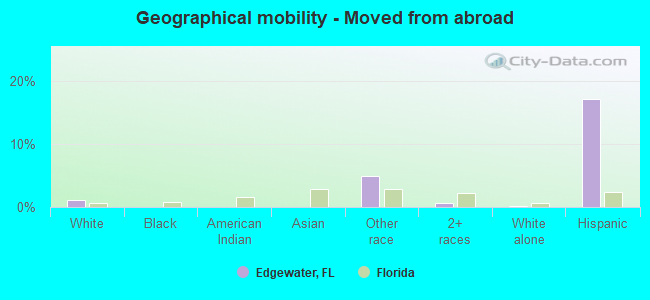
Geographical mobility - Moved from abroad (%)
Geographical mobility - Moved from abroad (%) - White
Geographical mobility - Moved from abroad (%) - Black or African American
Geographical mobility - Moved from abroad (%) - Asian
Geographical mobility - Moved from abroad (%) - Hispanic or Latino
Geographical mobility - Moved from abroad (%) - American Indian and Alaska Native
Geographical mobility - Moved from abroad (%) - Multirace
Geographical mobility - Moved from abroad (%) - Other Race
Place of birth for the foreign-born population - Ireland (%)
Place of birth for the foreign-born population - Denmark (%)
Place of birth for the foreign-born population - Norway (%)
Place of birth for the foreign-born population - Sweden (%)
Place of birth for the foreign-born population - United Kingdom (%)
Place of birth for the foreign-born population - England (%)
Place of birth for the foreign-born population - Scotland (%)
Place of birth for the foreign-born population - Other Northern Europe (%)
Place of birth for the foreign-born population - Austria (%)
Place of birth for the foreign-born population - Belgium (%)
Place of birth for the foreign-born population - France (%)
Place of birth for the foreign-born population - Germany (%)
Place of birth for the foreign-born population - Netherlands (%)
Place of birth for the foreign-born population - Switzerland (%)
Place of birth for the foreign-born population - Other Western Europe (%)
Place of birth for the foreign-born population - Greece (%)
Place of birth for the foreign-born population - Italy (%)
Place of birth for the foreign-born population - Portugal (%)
Place of birth for the foreign-born population - Spain (%)
Place of birth for the foreign-born population - Other Southern Europe (%)
Place of birth for the foreign-born population - Albania (%)
Place of birth for the foreign-born population - Belarus (%)
Place of birth for the foreign-born population - Bosnia and Herzegovina (%)
Place of birth for the foreign-born population - Bulgaria (%)
Place of birth for the foreign-born population - Croatia (%)
Place of birth for the foreign-born population - Czechoslovakia (%)
Place of birth for the foreign-born population - Hungary (%)
Place of birth for the foreign-born population - Latvia (%)
Place of birth for the foreign-born population - Lithuania (%)
Place of birth for the foreign-born population - North Macedonia (Macedonia) (%)
Place of birth for the foreign-born population - Moldova (%)
Place of birth for the foreign-born population - Poland (%)
Place of birth for the foreign-born population - Romania (%)
Place of birth for the foreign-born population - Russia (%)
Place of birth for the foreign-born population - Serbia (%)
Place of birth for the foreign-born population - Ukraine (%)
Place of birth for the foreign-born population - Other Eastern Europe (%)
Place of birth for the foreign-born population - China (%)
Place of birth for the foreign-born population - Hong Kong (%)
Place of birth for the foreign-born population - Taiwan (%)
Place of birth for the foreign-born population - Japan (%)
Place of birth for the foreign-born population - Korea (%)
Place of birth for the foreign-born population - Other Eastern Asia (%)
Place of birth for the foreign-born population - Afghanistan (%)
Place of birth for the foreign-born population - Bangladesh (%)
Place of birth for the foreign-born population - India (%)
Place of birth for the foreign-born population - Iran (%)
Place of birth for the foreign-born population - Kazakhstan (%)
Place of birth for the foreign-born population - Nepal (%)
Place of birth for the foreign-born population - Pakistan (%)
Place of birth for the foreign-born population - Sri Lanka (%)
Place of birth for the foreign-born population - Uzbekistan (%)
Place of birth for the foreign-born population - Other South Central Asia (%)
Place of birth for the foreign-born population - Burma (%)
Place of birth for the foreign-born population - Cambodia (%)
Place of birth for the foreign-born population - Indonesia (%)
Place of birth for the foreign-born population - Laos (%)
Place of birth for the foreign-born population - Malaysia (%)
Place of birth for the foreign-born population - Philippines (%)
Place of birth for the foreign-born population - Singapore (%)
Place of birth for the foreign-born population - Thailand (%)
Place of birth for the foreign-born population - Vietnam (%)
Place of birth for the foreign-born population - Other South Eastern Asia (%)
Place of birth for the foreign-born population - Armenia (%)
Place of birth for the foreign-born population - Iraq (%)
Place of birth for the foreign-born population - Israel (%)
Place of birth for the foreign-born population - Jordan (%)
Place of birth for the foreign-born population - Kuwait (%)
Place of birth for the foreign-born population - Lebanon (%)
Place of birth for the foreign-born population - Saudi Arabia (%)
Place of birth for the foreign-born population - Syria (%)
Place of birth for the foreign-born population - Turkey (%)
Place of birth for the foreign-born population - Yemen (%)
Place of birth for the foreign-born population - Other Western Asia (%)
Place of birth for the foreign-born population - Eritrea (%)
Place of birth for the foreign-born population - Ethiopia (%)
Place of birth for the foreign-born population - Kenya (%)
Place of birth for the foreign-born population - Somalia (%)
Place of birth for the foreign-born population - Uganda (%)
Place of birth for the foreign-born population - Zimbabwe (%)
Place of birth for the foreign-born population - Other Eastern Africa (%)
Place of birth for the foreign-born population - Cameroon (%)
Place of birth for the foreign-born population - Congo (%)
Place of birth for the foreign-born population - Democratic Republic of Congo (Zaire) (%)
Place of birth for the foreign-born population - Other Middle Africa (%)
Place of birth for the foreign-born population - Egypt (%)
Place of birth for the foreign-born population - Morocco (%)
Place of birth for the foreign-born population - Sudan (%)
Place of birth for the foreign-born population - Other Northern Africa (%)
Place of birth for the foreign-born population - South Africa (%)
Place of birth for the foreign-born population - Other Southern Africa (%)
Place of birth for the foreign-born population - Cabo Verde (%)
Place of birth for the foreign-born population - Ghana (%)
Place of birth for the foreign-born population - Liberia (%)
Place of birth for the foreign-born population - Nigeria (%)
Place of birth for the foreign-born population - Senegal (%)
Place of birth for the foreign-born population - Sierra Leone (%)
Place of birth for the foreign-born population - Other Western Africa (%)
Place of birth for the foreign-born population - Australia (%)
Place of birth for the foreign-born population - New Zealand (%)
Place of birth for the foreign-born population - Fiji (%)
Place of birth for the foreign-born population - Micronesia (%)
Place of birth for the foreign-born population - Bahamas (%)
Place of birth for the foreign-born population - Barbados (%)
Place of birth for the foreign-born population - Cuba (%)
Place of birth for the foreign-born population - Dominica (%)
Place of birth for the foreign-born population - Dominican Republic (%)
Place of birth for the foreign-born population - Grenada (%)
Place of birth for the foreign-born population - Haiti (%)
Place of birth for the foreign-born population - Jamaica (%)
Place of birth for the foreign-born population - St. Vincent and the Grenadines (%)
Place of birth for the foreign-born population - Trinidad and Tobago (%)
Place of birth for the foreign-born population - West Indies (%)
Place of birth for the foreign-born population - Other Caribbean (%)
Place of birth for the foreign-born population - Belize (%)
Place of birth for the foreign-born population - Costa Rica (%)
Place of birth for the foreign-born population - El Salvador (%)
Place of birth for the foreign-born population - Guatemala (%)
Place of birth for the foreign-born population - Honduras (%)
Place of birth for the foreign-born population - Mexico (%)
Place of birth for the foreign-born population - Nicaragua (%)
Place of birth for the foreign-born population - Panama (%)
Place of birth for the foreign-born population - Other Central America (%)
Place of birth for the foreign-born population - Argentina (%)
Place of birth for the foreign-born population - Bolivia (%)
Place of birth for the foreign-born population - Brazil (%)
Place of birth for the foreign-born population - Chile (%)
Place of birth for the foreign-born population - Colombia (%)
Place of birth for the foreign-born population - Ecuador (%)
Place of birth for the foreign-born population - Guyana (%)
Place of birth for the foreign-born population - Peru (%)
Place of birth for the foreign-born population - Uruguay (%)
Place of birth for the foreign-born population - Venezuela (%)
Place of birth for the foreign-born population - Other South America (%)
Place of birth for the foreign-born population - Canada (%)
Place of birth for the foreign-born population - Other Northern America (%)
Place of birth for the foreign-born population - Other (%)
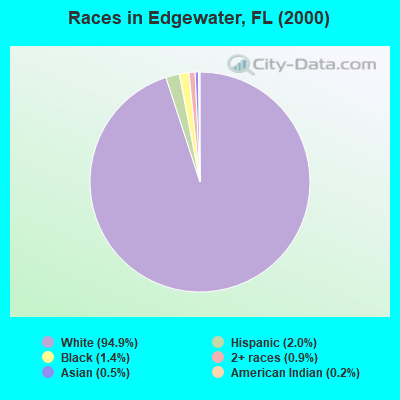
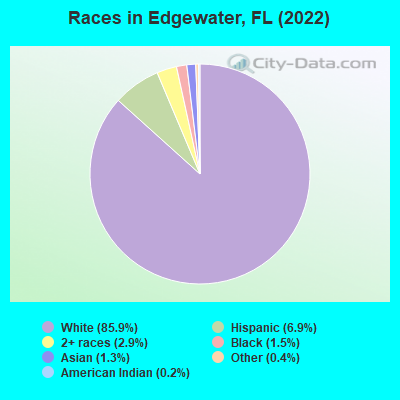
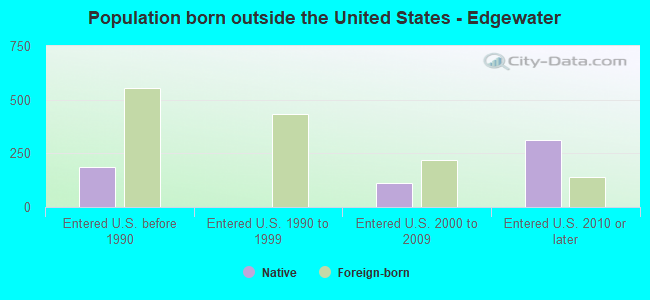
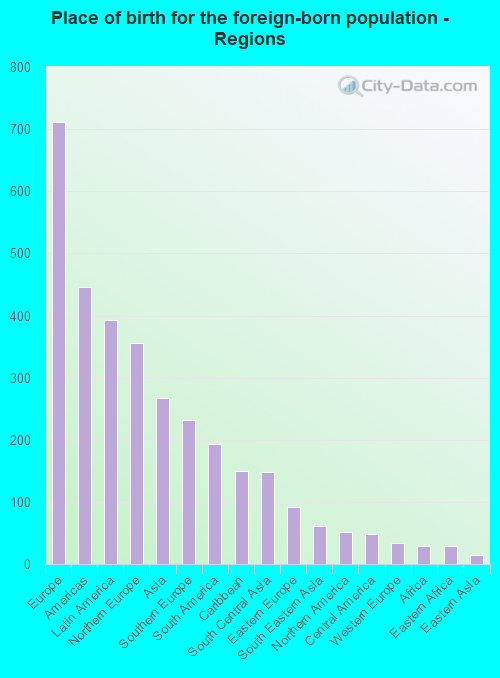
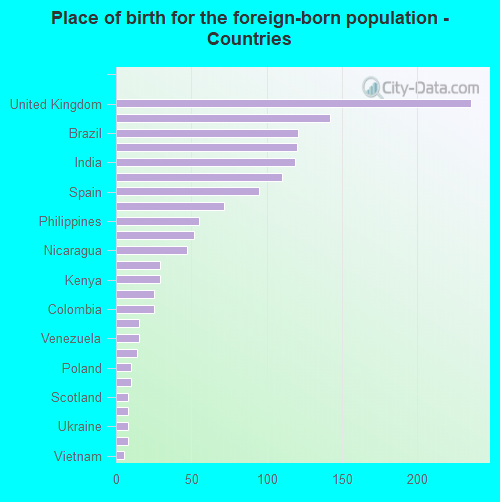
According to 2022 data, the most numerous races in Edgewater, FL are White alone (20,603 residents), Hispanic (1,651 residents), and Black alone (366 residents). 93.0% of Edgewater residents speak English at home. 6.1% of Edgewater, FL residents are foreign-born (2.9% born in Europe, 1.6% born in Latin America, 1.1% born in Asia), which is 246.1% less than the foreign-born rate of 21.0% across the entire state of Florida.
Race distribution in Edgewater
2000 2022
10,458,509 65.4% White alone 2,682,715 16.8% Hispanic 2,264,268 14.2% Black alone 261,693 1.6% Asian alone 236,954 1.5% Two or more races 42,358 0.3% American Indian alone 28,994 0.2% Other race alone 6,887 0.04% Native Hawaiian and Other
11,309,403 50.8% White alone 6,025,039 27.1% Hispanic 3,241,015 14.6% Black alone 861,630 3.9% Two or more races 623,692 2.8% Asian alone 152,054 0.7% Other race alone 22,504 0.1% American Indian alone 9,486 0.04% Native Hawaiian and Other
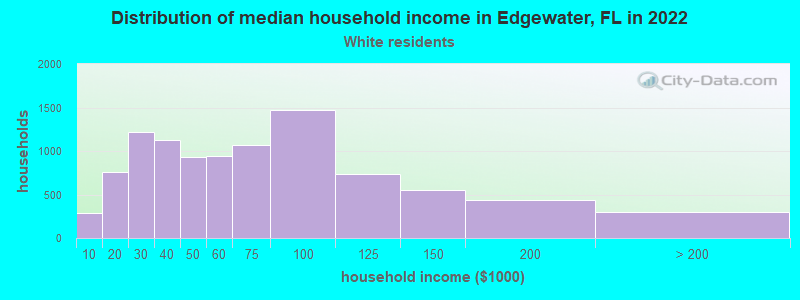
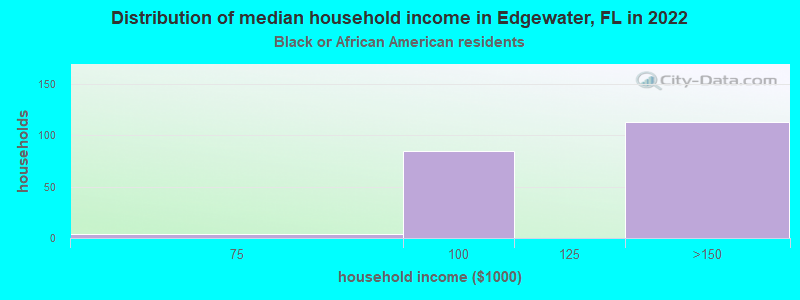
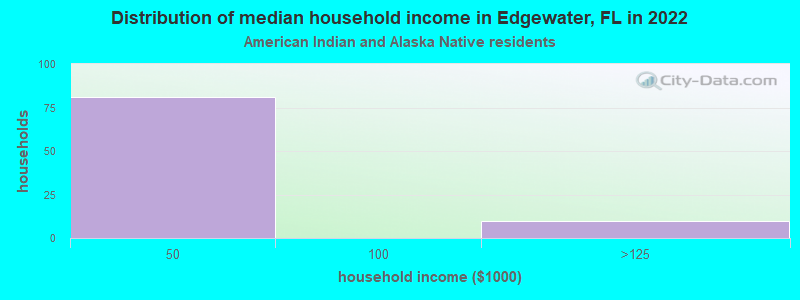
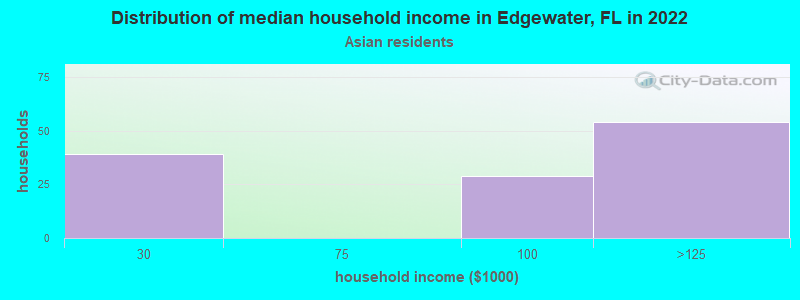
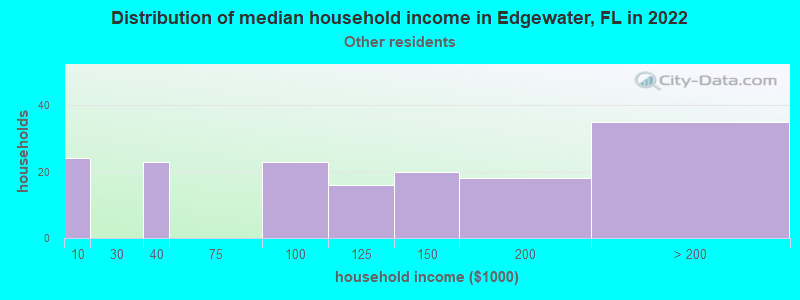
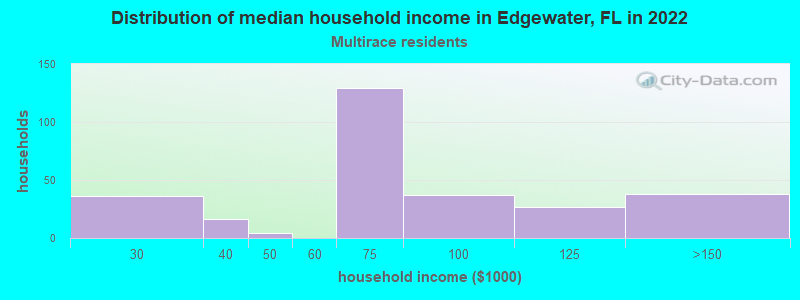
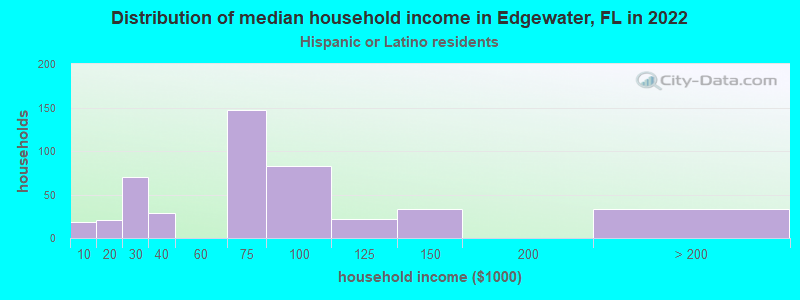
Income and house value in Edgewater Median household income in 2022 $56,614 White non-Hispanic householders$95,052 Black householders$44,280 American Indian and Alaska Native householders$148,478 Some other race householders$73,332 Two or more races householders$68,894 Hispanic or Latino race householdersMedian 2022 house value $267,145 White Non-Hispanic householders$293,756 Black or African American householders$283,388 Two or more races householders$259,196 Hispanic or Latino householders
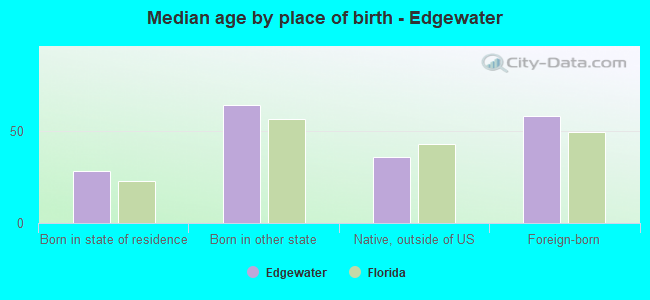
Median age by race in Edgewater
56.8 Median age for White residents54.2 59.2 55.0 Median age for Black or African American residents50.7 60.6 23.0 Median age for American Indian / Alaska Native residents-455,981,940.9 -459,143,968.4 59.5 Median age for Asian residents48.9 64.3 -668,922,729.2 Median age for Native Hawaiian / Pacific Islander residents-668,922,729.2 -443,298,968.6 35.8 Median age for Other race residents25.5 35.5 32.1 Median age for Two or more races residents51.1 29.0 56.6 Median age for White alone residents54.4 59.1 36.9 Median age for Hispanic or Latino residents37.4 25.1
Owner/renter occupied households by race in Edgewater
House owners and renters - White residents 8,926 88.5% Owner occupied1,159 11.5% Renter occupiedHouse owners and renters - Black or African American residents 159 99.4% Owner occupied1 0.6% Renter occupiedHouse owners and renters - American Indian / Alaska Native residents 6 11.0% Owner occupied47 89.0% Renter occupiedHouse owners and renters - Asian residents 157 100.0% Owner occupiedHouse owners and renters - Other race residents 181 100.0% Owner occupiedHouse owners and renters - Two or more races residents 252 88.2% Owner occupied34 11.8% Renter occupiedHouse owners and renters - White alone residents 8,930 88.5% Owner occupied1,157 11.5% Renter occupiedHouse owners and renters - Hispanic or Latino residents 428 88.2% Owner occupied57 11.8% Renter occupied
Language usage in Edgewater
English speakers - Total 93.0% of residents of Edgewater speak English at home.
3.6% of residents speak Spanish at home 600 72.4% Speak English very well229 27.6% Speak English less than very well3.6% of residents speak other language at home 663 78.9% Speak English very well177 21.1% Speak English less than very well
English speakers - Born in the United States 96.8% of residents of Edgewater speak English at home.
0.5% of residents speak Spanish at home 72 100.0% Speak English very well2.8% of residents speak other language at home 373 98.4% Speak English very well6 1.6% Speak English less than very well
English speakers - Native, born elsewhere 54.7% of residents of Edgewater speak English at home.
41.7% of residents speak Spanish at home 179 83.3% Speak English very well36 16.7% Speak English less than very well
English speakers - Foreign-born 47.9% of residents of Edgewater speak English at home.
19.0% of residents speak Spanish at home 143 55.9% Speak English very well113 44.1% Speak English less than very well35.6% of residents speak other language at home 301 62.7% Speak English very well179 37.3% Speak English less than very well
White (Caucasian) - Speak only English Native:
98.1% (18,884)Foreign-born:
73.0% (537)
White (Caucasian) - Speak another language Native:
2.4% (459)Foreign-born:
37.0% (272)
Black or African American - Speak only English Native:
98.9% (333)Foreign-born:
100.0% (7)
Asian - Speak only English Native:
94.9% (23)Foreign-born:
19.2% (55)
Other race - Speak only English Native:
100.0% (507)Foreign-born:
38.4% (54)
Other race - Speak another language Native:
4.6% (23)Foreign-born:
65.4% (91)
Two or more races - Speak only English Native:
80.5% (701)Foreign-born:
25.2% (41)
Two or more races - Speak another language Native:
16.8% (146)Foreign-born:
74.3% (122)
White alone - Speak only English Native:
96.7% (18,620)Foreign-born:
80.3% (561)
White alone - Speak another language Native:
3.2% (616)Foreign-born:
27.2% (190)
Hispanic or Latino - Speak only English Native:
85.8% (972)Foreign-born:
14.7% (54)
Hispanic or Latino - Speak another language Native:
22.8% (258)Foreign-born:
85.7% (316)
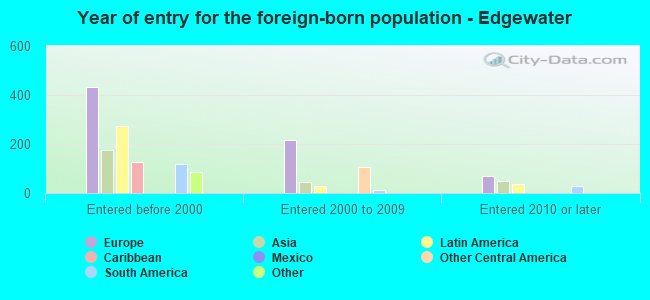
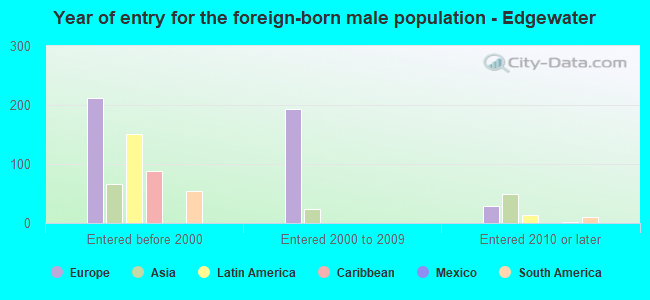
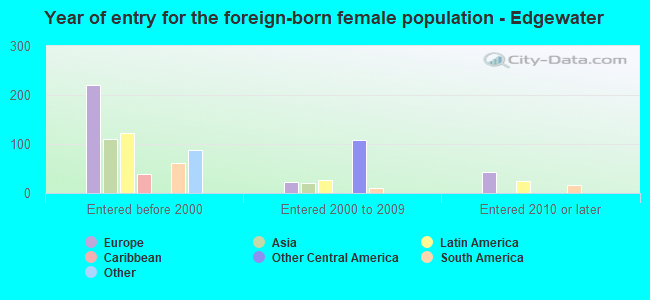
Foreign-born residents in Edgewater 1,456 residents are foreign born (2.9% Europe , 1.6% Latin America , 1.1% Asia ).
This city:
6.1%Florida:
21.1%
Marital status for residents in Edgewater Marital status - White (Caucasian) population 15 years and over
Males 24.1% Never married49.7% Now married1.5% Separated6.2% Widowed18.5% DivorcedFemales 17.5% Never married42.9% Now married0.9% Separated14.8% Widowed23.8% DivorcedWomen who gave birth in the past 12 months Now married:
38.3% (60)Unmarried:
61.7% (97)
Women who did not give birth in the past 12 months Now married:
41.1% (1,369)Unmarried:
58.9% (1,962)
Marital status - Black or African American population 15 years and over
Males 26.1% Never married73.9% Now married0.0% Separated0.0% Widowed0.0% DivorcedFemales 4.8% Never married57.0% Now married0.0% Separated0.0% Widowed38.2% DivorcedWomen who did not give birth in the past 12 months Now married:
97.7% (43)Unmarried:
2.3% (1)
Marital status - American Indian / Alaska Native population 15 years and over
Males 0.0% Never married81.6% Now married0.0% Separated0.0% Widowed18.4% DivorcedFemales 0.0% Never married100.0% Now married0.0% Separated0.0% Widowed0.0% DivorcedWomen who did not give birth in the past 12 months Now married:
100.0% (25)Unmarried:
0.0% (0)
Marital status - Asian population 15 years and over
Males 18.8% Never married81.2% Now married0.0% Separated0.0% Widowed0.0% DivorcedFemales 25.8% Never married40.9% Now married0.0% Separated15.7% Widowed17.6% DivorcedWomen who did not give birth in the past 12 months Now married:
0.0% (0)Unmarried:
100.0% (42)
Marital status - Other race population 15 years and over
Males 39.8% Never married44.4% Now married0.0% Separated7.9% Widowed7.9% DivorcedFemales 23.6% Never married67.6% Now married0.0% Separated0.0% Widowed8.8% DivorcedWomen who did not give birth in the past 12 months Now married:
59.8% (96)Unmarried:
40.2% (65)
Marital status - Two or more races population 15 years and over
Males 45.4% Never married36.6% Now married0.0% Separated0.0% Widowed18.0% DivorcedFemales 52.9% Never married38.8% Now married0.0% Separated5.5% Widowed2.7% DivorcedWomen who gave birth in the past 12 months Now married:
0.0% (0)Unmarried:
100.0% (40)
Women who did not give birth in the past 12 months Now married:
22.0% (36)Unmarried:
78.0% (129)
Marital status - White alone, not Hispanic / Latino population 15 years and over
Males 24.2% Never married49.4% Now married1.1% Separated6.4% Widowed18.8% DivorcedFemales 17.3% Never married42.6% Now married1.0% Separated15.1% Widowed24.0% DivorcedWomen who gave birth in the past 12 months Now married:
38.3% (63)Unmarried:
61.7% (102)
Women who did not give birth in the past 12 months Now married:
41.3% (1,396)Unmarried:
58.7% (1,981)
Marital status - Hispanic or Latino population 15 years and over
Males 28.2% Never married50.1% Now married7.2% Separated3.2% Widowed11.3% DivorcedFemales 32.7% Never married57.4% Now married0.0% Separated4.0% Widowed5.9% DivorcedWomen who did not give birth in the past 12 months Now married:
35.2% (119)Unmarried:
64.8% (220)
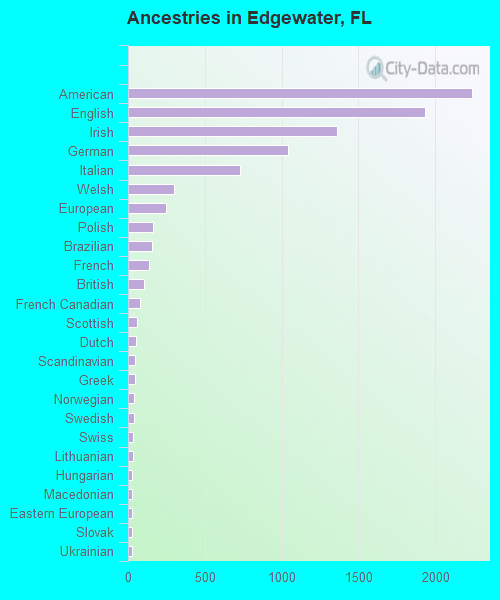
Ancestries in Edgewater
2,238 18.1% American1,931 15.6% English1,359 11.0% Irish1,043 8.4% German731 5.9% Italian302 2.4% Welsh245 2.0% European163 1.3% Polish158 1.3% Brazilian138 1.1% French101 0.8% British79 0.6% French Canadian61 0.5% Scottish51 0.4% Dutch46 0.4% Scandinavian43 0.3% Greek42 0.3% Norwegian40 0.3% Swedish32 0.3% Swiss31 0.3% Lithuanian28 0.2% Hungarian27 0.2% Macedonian27 0.2% Eastern European26 0.2% Slovak25 0.2% Ukrainian23 0.2% Serbian22 0.2% Scotch-Irish15 0.1% Syrian14 0.1% Albanian13 0.1% Canadian9 0.07% Finnish9 0.07% Croatian8 0.06% Yugoslavian7 0.06% Russian7 0.06% Jamaican
Children Nativity (place of birth) in Edgewater
Children under 6 years - Living with two parents Both parents native 546 100.0% NativeOne native, one foreign-born parent 25 100.0% NativeChildren under 6 years - Living with one parent Native parent 476 100.0% NativeChildren 6 to 17 years - Living with two parents Both parents native 776 100.0% NativeBoth parents foreign-born 17 100.0% NativeOne native, one foreign-born parent 112 91.1% Native11 8.9% Foreign-bornChildren 6 to 17 years - Living with one parent Native parent 1,104 100.0% NativeForeign-born parent 91 50.6% Native89 49.4% Foreign-born
Grandparents responsible for own grandchildren in Edgewater
Grandparents (30 to 59 years) White / Caucasian 88 51.3% Responsible for grandchildren83 48.7% Not responsible for grandchildrenOther race 56 47.5% Responsible for grandchildren62 52.5% Not responsible for grandchildrenWhite alone, not Hispanic / Latino 90 49.8% Responsible for grandchildren91 50.2% Not responsible for grandchildrenHispanic or Latino 19 28.1% Responsible for grandchildren50 71.9% Not responsible for grandchildrenGrandparents (60 years and over) White / Caucasian 62 19.9% Responsible for grandchildren249 80.1% Not responsible for grandchildrenWhite alone, not Hispanic / Latino 61 20.2% Responsible for grandchildren242 79.8% Not responsible for grandchildren