Races in East Whatcom, Washington (WA) Detailed Stats
Ancestries, Foreign-born residents, place of birth
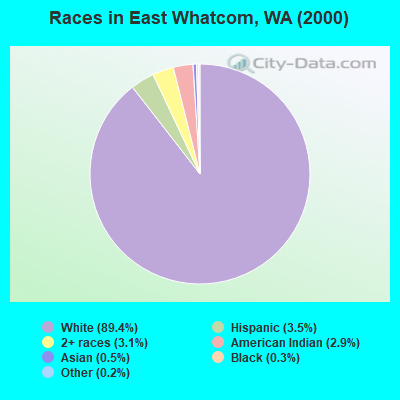
Race distribution in East Whatcom

- 5,73289.4%White alone
- 2273.5%Hispanic
- 1983.1%Two or more races
- 1842.9%American Indian alone
- 350.5%Asian alone
- 200.3%Black alone
- 100.2%Other race alone
- 40.06%Native Hawaiian and Other
Pacific Islander alone
2000
2022
-
- 4,652,49078.9%White alone
- 441,5097.5%Hispanic
- 319,4015.4%Asian alone
- 184,6313.1%Black alone
- 175,9263.0%Two or more races
- 85,3961.4%American Indian alone
- 22,7790.4%Native Hawaiian and Other
Pacific Islander alone - 11,9890.2%Other race alone

-
- 4,941,45663.5%White alone
- 1,093,31314.0%Hispanic
- 755,8329.7%Asian alone
- 523,4486.7%Two or more races
- 299,5373.8%Black alone
- 69,0240.9%American Indian alone
- 52,2310.7%Native Hawaiian and Other
Pacific Islander alone - 50,9450.7%Other race alone

Income and house value in East Whatcom
- Median household income in 2022
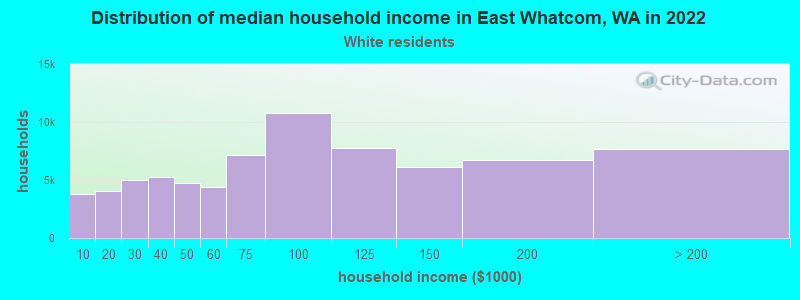
- $75,051White non-Hispanic householders
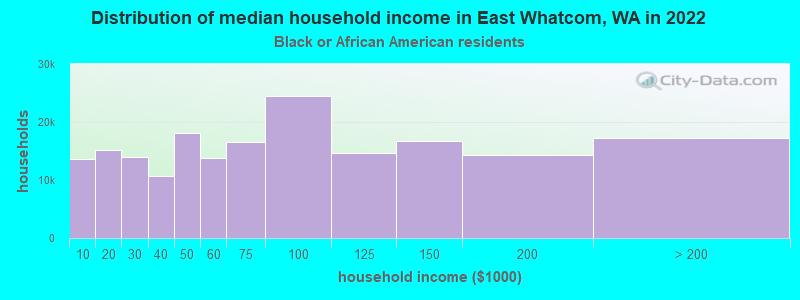
- $73,631Black householders
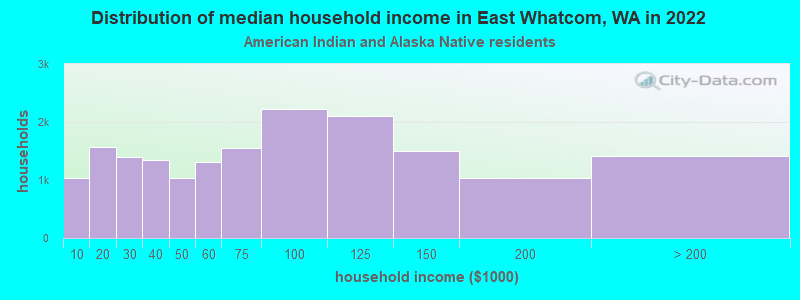
- $72,195American Indian and Alaska Native householders
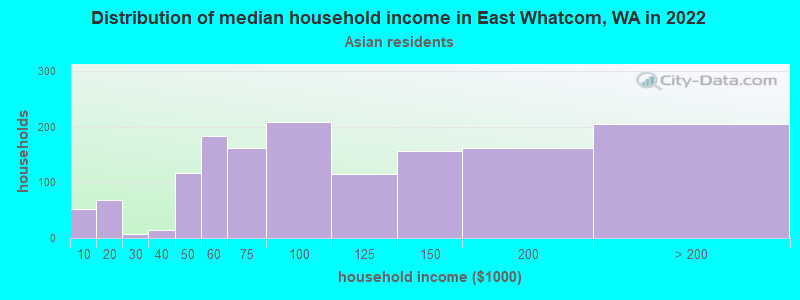
- $33,463Asian householders
- over $200,000Some other race householders
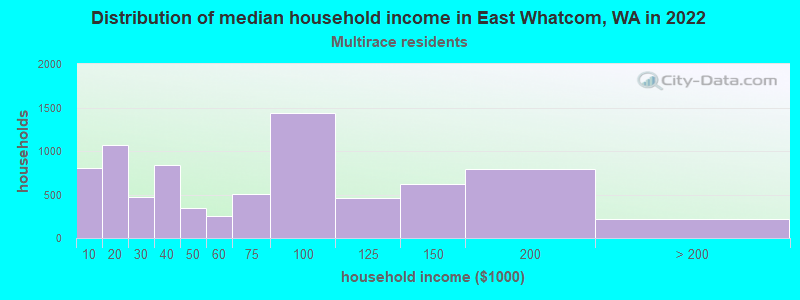
- $74,357Two or more races householders
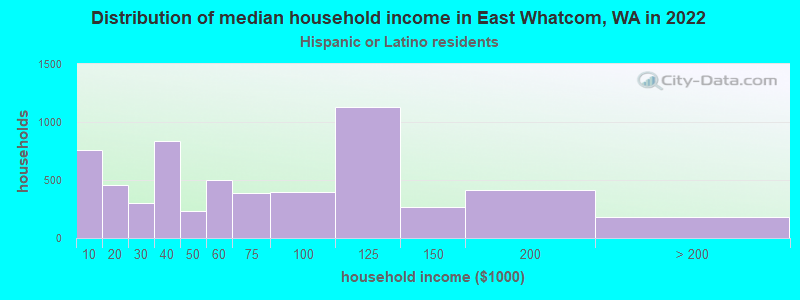
- $50,612Hispanic or Latino race householders
- Median 2022 house value
- $507,501White Non-Hispanic householders
- $904,816Black or African American householders
- $398,521American Indian or Alaska Native householders
- $341,819Asian householders
- $452,408Some other race householders
- $380,424Two or more races householders
- $854,548Hispanic or Latino householders
Household income for White non-Hispanic householders
Household income for Black householders
Household income for American Indian and Alaska Native householders
Household income for Asian householders
Household income for Two or more races householders
Household income for Hispanic or Latino race householders
Zip code: 98244