Races in East Riverdale, Maryland (MD) Detailed Stats
Data:
Races - White alone (%)
Races - White alone (% change since 2000)
Races - Black alone (%)
Races - Black alone (% change since 2000)
Races - American Indian alone (%)
Races - American Indian alone (% change since 2000)
Races - Asian alone (%)
Races - Asian alone (% change since 2000)
Races - Hispanic (%)
Races - Hispanic (% change since 2000)
Races - Native Hawaiian and Other Pacific Islander alone (%)
Races - Native Hawaiian and Other Pacific Islander alone (% change since 2000)
Races - Two or more races(%)
Races - Two or more races(% change since 2000)
Races - Other race alone (%)
Races - Other race alone (% change since 2000)
Racial diversity
Place of birth - Born in state of residence (%)
Place of birth - Born in state of residence (%) - White
Place of birth - Born in state of residence (%) - Black or African American
Place of birth - Born in state of residence (%) - Asian
Place of birth - Born in state of residence (%) - Hispanic or Latino
Place of birth - Born in state of residence (%) - American Indian and Alaska Native
Place of birth - Born in state of residence (%) - Multirace
Place of birth - Born in state of residence (%) - Other Race
Place of birth - Born in other state (%)
Place of birth - Born in other state (%) - White
Place of birth - Born in other state (%) - Black or African American
Place of birth - Born in other state (%) - Asian
Place of birth - Born in other state (%) - Hispanic or Latino
Place of birth - Born in other state (%) - American Indian and Alaska Native
Place of birth - Born in other state (%) - Multirace
Place of birth - Born in other state (%) - Other Race
Place of birth - Native, outside of US (%)
Place of birth - Native, outside of US (%) - White
Place of birth - Native, outside of US (%) - Black or African American
Place of birth - Native, outside of US (%) - Asian
Place of birth - Native, outside of US (%) - Hispanic or Latino
Place of birth - Native, outside of US (%) - American Indian and Alaska Native
Place of birth - Native, outside of US (%) - Multirace
Place of birth - Native, outside of US (%) - Other Race
Place of birth - Foreign born (%)
Place of birth - Foreign born (%) - White
Place of birth - Foreign born (%) - Black or African American
Place of birth - Foreign born (%) - Asian
Place of birth - Foreign born (%) - Hispanic or Latino
Place of birth - Foreign born (%) - American Indian and Alaska Native
Place of birth - Foreign born (%) - Multirace
Place of birth - Foreign born (%) - Other Race
Residents speaking English at home (%)
Residents speaking English at home - Born in the United States (%)
Residents speaking English at home - Native, born elsewhere (%)
Residents speaking English at home - Foreign born (%)
Residents speaking Spanish at home (%)
Residents speaking Spanish at home - Born in the United States (%)
Residents speaking Spanish at home - Native, born elsewhere (%)
Residents speaking Spanish at home - Foreign born (%)
Residents speaking other language at home (%)
Residents speaking other language at home - Born in the United States (%)
Residents speaking other language at home - Native, born elsewhere (%)
Residents speaking other language at home - Foreign born (%)
Marital status - Never married (%)
Marital status - Now married (%)
Marital status - Separated (%)
Marital status - Widowed (%)
Marital status - Divorced (%)
Ancestries Reported - Arab (%)
Ancestries Reported - Czech (%)
Ancestries Reported - Danish (%)
Ancestries Reported - Dutch (%)
Ancestries Reported - English (%)
Ancestries Reported - French (%)
Ancestries Reported - French Canadian (%)
Ancestries Reported - German (%)
Ancestries Reported - Greek (%)
Ancestries Reported - Hungarian (%)
Ancestries Reported - Irish (%)
Ancestries Reported - Italian (%)
Ancestries Reported - Lithuanian (%)
Ancestries Reported - Norwegian (%)
Ancestries Reported - Polish (%)
Ancestries Reported - Portuguese (%)
Ancestries Reported - Russian (%)
Ancestries Reported - Scotch-Irish (%)
Ancestries Reported - Scottish (%)
Ancestries Reported - Slovak (%)
Ancestries Reported - Subsaharan African (%)
Ancestries Reported - Swedish (%)
Ancestries Reported - Swiss (%)
Ancestries Reported - Ukrainian (%)
Ancestries Reported - United States (%)
Ancestries Reported - Welsh (%)
Ancestries Reported - West Indian (%)
Ancestries Reported - Other (%)
Geographical mobility - Same house 1 year ago (%)
Geographical mobility - Same house 1 year ago (%) - White
Geographical mobility - Same house 1 year ago (%) - Black or African American
Geographical mobility - Same house 1 year ago (%) - Asian
Geographical mobility - Same house 1 year ago (%) - Hispanic or Latino
Geographical mobility - Same house 1 year ago (%) - American Indian and Alaska Native
Geographical mobility - Same house 1 year ago (%) - Multirace
Geographical mobility - Same house 1 year ago (%) - Other Race
Geographical mobility - Moved within same county (%)
Geographical mobility - Moved within same county (%) - White
Geographical mobility - Moved within same county (%) - Black or African American
Geographical mobility - Moved within same county (%) - Asian
Geographical mobility - Moved within same county (%) - Hispanic or Latino
Geographical mobility - Moved within same county (%) - American Indian and Alaska Native
Geographical mobility - Moved within same county (%) - Multirace
Geographical mobility - Moved within same county (%) - Other Race
Geographical mobility - Moved from different county within same state (%)
Geographical mobility - Moved from different county within same state (%) - White
Geographical mobility - Moved from different county within same state (%) - Black or African American
Geographical mobility - Moved from different county within same state (%) - Asian
Geographical mobility - Moved from different county within same state (%) - Hispanic or Latino
Geographical mobility - Moved from different county within same state (%) - American Indian and Alaska Native
Geographical mobility - Moved from different county within same state (%) - Multirace
Geographical mobility - Moved from different county within same state (%) - Other Race
Geographical mobility - Moved from different state (%)
Geographical mobility - Moved from different state (%) - White
Geographical mobility - Moved from different state (%) - Black or African American
Geographical mobility - Moved from different state (%) - Asian
Geographical mobility - Moved from different state (%) - Hispanic or Latino
Geographical mobility - Moved from different state (%) - American Indian and Alaska Native
Geographical mobility - Moved from different state (%) - Multirace
Geographical mobility - Moved from different state (%) - Other Race
Geographical mobility - Moved from abroad (%)
Geographical mobility - Moved from abroad (%) - White
Geographical mobility - Moved from abroad (%) - Black or African American
Geographical mobility - Moved from abroad (%) - Asian
Geographical mobility - Moved from abroad (%) - Hispanic or Latino
Geographical mobility - Moved from abroad (%) - American Indian and Alaska Native
Geographical mobility - Moved from abroad (%) - Multirace
Geographical mobility - Moved from abroad (%) - Other Race
Place of birth for the foreign-born population - Ireland (%)
Place of birth for the foreign-born population - Denmark (%)
Place of birth for the foreign-born population - Norway (%)
Place of birth for the foreign-born population - Sweden (%)
Place of birth for the foreign-born population - United Kingdom (%)
Place of birth for the foreign-born population - England (%)
Place of birth for the foreign-born population - Scotland (%)
Place of birth for the foreign-born population - Other Northern Europe (%)
Place of birth for the foreign-born population - Austria (%)
Place of birth for the foreign-born population - Belgium (%)
Place of birth for the foreign-born population - France (%)
Place of birth for the foreign-born population - Germany (%)
Place of birth for the foreign-born population - Netherlands (%)
Place of birth for the foreign-born population - Switzerland (%)
Place of birth for the foreign-born population - Other Western Europe (%)
Place of birth for the foreign-born population - Greece (%)
Place of birth for the foreign-born population - Italy (%)
Place of birth for the foreign-born population - Portugal (%)
Place of birth for the foreign-born population - Spain (%)
Place of birth for the foreign-born population - Other Southern Europe (%)
Place of birth for the foreign-born population - Albania (%)
Place of birth for the foreign-born population - Belarus (%)
Place of birth for the foreign-born population - Bosnia and Herzegovina (%)
Place of birth for the foreign-born population - Bulgaria (%)
Place of birth for the foreign-born population - Croatia (%)
Place of birth for the foreign-born population - Czechoslovakia (%)
Place of birth for the foreign-born population - Hungary (%)
Place of birth for the foreign-born population - Latvia (%)
Place of birth for the foreign-born population - Lithuania (%)
Place of birth for the foreign-born population - North Macedonia (Macedonia) (%)
Place of birth for the foreign-born population - Moldova (%)
Place of birth for the foreign-born population - Poland (%)
Place of birth for the foreign-born population - Romania (%)
Place of birth for the foreign-born population - Russia (%)
Place of birth for the foreign-born population - Serbia (%)
Place of birth for the foreign-born population - Ukraine (%)
Place of birth for the foreign-born population - Other Eastern Europe (%)
Place of birth for the foreign-born population - China (%)
Place of birth for the foreign-born population - Hong Kong (%)
Place of birth for the foreign-born population - Taiwan (%)
Place of birth for the foreign-born population - Japan (%)
Place of birth for the foreign-born population - Korea (%)
Place of birth for the foreign-born population - Other Eastern Asia (%)
Place of birth for the foreign-born population - Afghanistan (%)
Place of birth for the foreign-born population - Bangladesh (%)
Place of birth for the foreign-born population - India (%)
Place of birth for the foreign-born population - Iran (%)
Place of birth for the foreign-born population - Kazakhstan (%)
Place of birth for the foreign-born population - Nepal (%)
Place of birth for the foreign-born population - Pakistan (%)
Place of birth for the foreign-born population - Sri Lanka (%)
Place of birth for the foreign-born population - Uzbekistan (%)
Place of birth for the foreign-born population - Other South Central Asia (%)
Place of birth for the foreign-born population - Burma (%)
Place of birth for the foreign-born population - Cambodia (%)
Place of birth for the foreign-born population - Indonesia (%)
Place of birth for the foreign-born population - Laos (%)
Place of birth for the foreign-born population - Malaysia (%)
Place of birth for the foreign-born population - Philippines (%)
Place of birth for the foreign-born population - Singapore (%)
Place of birth for the foreign-born population - Thailand (%)
Place of birth for the foreign-born population - Vietnam (%)
Place of birth for the foreign-born population - Other South Eastern Asia (%)
Place of birth for the foreign-born population - Armenia (%)
Place of birth for the foreign-born population - Iraq (%)
Place of birth for the foreign-born population - Israel (%)
Place of birth for the foreign-born population - Jordan (%)
Place of birth for the foreign-born population - Kuwait (%)
Place of birth for the foreign-born population - Lebanon (%)
Place of birth for the foreign-born population - Saudi Arabia (%)
Place of birth for the foreign-born population - Syria (%)
Place of birth for the foreign-born population - Turkey (%)
Place of birth for the foreign-born population - Yemen (%)
Place of birth for the foreign-born population - Other Western Asia (%)
Place of birth for the foreign-born population - Eritrea (%)
Place of birth for the foreign-born population - Ethiopia (%)
Place of birth for the foreign-born population - Kenya (%)
Place of birth for the foreign-born population - Somalia (%)
Place of birth for the foreign-born population - Uganda (%)
Place of birth for the foreign-born population - Zimbabwe (%)
Place of birth for the foreign-born population - Other Eastern Africa (%)
Place of birth for the foreign-born population - Cameroon (%)
Place of birth for the foreign-born population - Congo (%)
Place of birth for the foreign-born population - Democratic Republic of Congo (Zaire) (%)
Place of birth for the foreign-born population - Other Middle Africa (%)
Place of birth for the foreign-born population - Egypt (%)
Place of birth for the foreign-born population - Morocco (%)
Place of birth for the foreign-born population - Sudan (%)
Place of birth for the foreign-born population - Other Northern Africa (%)
Place of birth for the foreign-born population - South Africa (%)
Place of birth for the foreign-born population - Other Southern Africa (%)
Place of birth for the foreign-born population - Cabo Verde (%)
Place of birth for the foreign-born population - Ghana (%)
Place of birth for the foreign-born population - Liberia (%)
Place of birth for the foreign-born population - Nigeria (%)
Place of birth for the foreign-born population - Senegal (%)
Place of birth for the foreign-born population - Sierra Leone (%)
Place of birth for the foreign-born population - Other Western Africa (%)
Place of birth for the foreign-born population - Australia (%)
Place of birth for the foreign-born population - New Zealand (%)
Place of birth for the foreign-born population - Fiji (%)
Place of birth for the foreign-born population - Micronesia (%)
Place of birth for the foreign-born population - Bahamas (%)
Place of birth for the foreign-born population - Barbados (%)
Place of birth for the foreign-born population - Cuba (%)
Place of birth for the foreign-born population - Dominica (%)
Place of birth for the foreign-born population - Dominican Republic (%)
Place of birth for the foreign-born population - Grenada (%)
Place of birth for the foreign-born population - Haiti (%)
Place of birth for the foreign-born population - Jamaica (%)
Place of birth for the foreign-born population - St. Vincent and the Grenadines (%)
Place of birth for the foreign-born population - Trinidad and Tobago (%)
Place of birth for the foreign-born population - West Indies (%)
Place of birth for the foreign-born population - Other Caribbean (%)
Place of birth for the foreign-born population - Belize (%)
Place of birth for the foreign-born population - Costa Rica (%)
Place of birth for the foreign-born population - El Salvador (%)
Place of birth for the foreign-born population - Guatemala (%)
Place of birth for the foreign-born population - Honduras (%)
Place of birth for the foreign-born population - Mexico (%)
Place of birth for the foreign-born population - Nicaragua (%)
Place of birth for the foreign-born population - Panama (%)
Place of birth for the foreign-born population - Other Central America (%)
Place of birth for the foreign-born population - Argentina (%)
Place of birth for the foreign-born population - Bolivia (%)
Place of birth for the foreign-born population - Brazil (%)
Place of birth for the foreign-born population - Chile (%)
Place of birth for the foreign-born population - Colombia (%)
Place of birth for the foreign-born population - Ecuador (%)
Place of birth for the foreign-born population - Guyana (%)
Place of birth for the foreign-born population - Peru (%)
Place of birth for the foreign-born population - Uruguay (%)
Place of birth for the foreign-born population - Venezuela (%)
Place of birth for the foreign-born population - Other South America (%)
Place of birth for the foreign-born population - Canada (%)
Place of birth for the foreign-born population - Other Northern America (%)
Place of birth for the foreign-born population - Other (%)
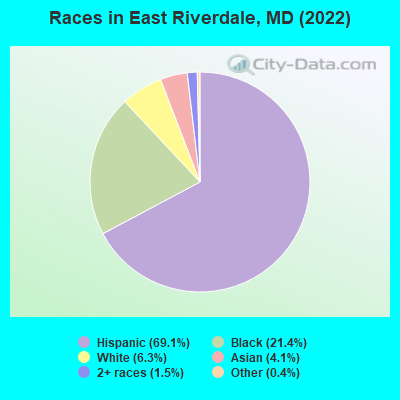
According to 2022 data, the most numerous races in East Riverdale, MD are White alone (1,132 residents), Black alone (3,828 residents), and Hispanic (12,355 residents). 31.7% of East Riverdale residents speak English at home. 56.8% of East Riverdale, MD residents are foreign-born (42.9% born in Latin America), which is 71.8% greater than the foreign-born rate of 16.0% across the entire state of Maryland.
Race distribution in East Riverdale
2000 2022
3,286,547 62.1% White alone 1,464,735 27.7% Black alone 227,916 4.3% Hispanic 209,738 4.0% Asian alone 82,946 1.6% Two or more races 13,312 0.3% American Indian alone 9,379 0.2% Other race alone 1,913 0.04% Native Hawaiian and Other
2,906,492 47.1% White alone 1,800,914 29.2% Black alone 705,842 11.4% Hispanic 401,818 6.5% Asian alone 291,317 4.7% Two or more races 46,930 0.8% Other race alone 8,930 0.1% American Indian alone 2,417 0.04% Native Hawaiian and Other
Income and house value in East Riverdale Median household income in 2022 $93,904 White non-Hispanic householders$85,339 Black householders$80,480 Some other race householders$29,689 Two or more races householders$70,236 Hispanic or Latino race householdersMedian 2022 house value $345,431 White Non-Hispanic householders$359,126 Black or African American householders$384,691 American Indian or Alaska Native householders $395,952 Asian householders$570,646 Native Hawaiian and other Pacific Islander householders$342,996 Some other race householders$342,387 Two or more races householders$353,344 Hispanic or Latino householders
Median age by race in East Riverdale
34.4 Median age for White residents34.9 34.4 37.4 Median age for Black or African American residents33.7 45.4 59.6 Median age for American Indian / Alaska Native residents67.7 57.1 19.8 Median age for Asian residents13.8 32.8 -571,600,480.8 Median age for Native Hawaiian / Pacific Islander residents-720,061,021.4 -760,942,760.2 25.8 Median age for Other race residents25.0 26.6 22.3 Median age for Two or more races residents18.4 27.5 42.4 Median age for White alone residents47.6 38.1 25.8 Median age for Hispanic or Latino residents25.4 27.3
Owner/renter occupied households by race in East Riverdale
House owners and renters - White residents 601 67.6% Owner occupied288 32.4% Renter occupiedHouse owners and renters - Black or African American residents 870 56.0% Owner occupied683 44.0% Renter occupiedHouse owners and renters - American Indian / Alaska Native residents 30 100.0% Owner occupiedHouse owners and renters - Asian residents 67 43.3% Owner occupied87 56.7% Renter occupiedHouse owners and renters - Other race residents 798 39.4% Owner occupied1,228 60.6% Renter occupiedHouse owners and renters - Two or more races residents 161 64.1% Owner occupied90 35.9% Renter occupiedHouse owners and renters - White alone residents 396 75.5% Owner occupied128 24.5% Renter occupiedHouse owners and renters - Hispanic or Latino residents 1,195 44.0% Owner occupied1,519 56.0% Renter occupied
Language usage in East Riverdale
English speakers - Total 31.7% of residents of East Riverdale speak English at home.
62.4% of residents speak Spanish at home 3,727 36.5% Speak English very well6,479 63.5% Speak English less than very well7.7% of residents speak other language at home 539 42.9% Speak English very well716 57.1% Speak English less than very well
English speakers - Born in the United States 56.8% of residents of East Riverdale speak English at home.
42.4% of residents speak Spanish at home 1,292 82.9% Speak English very well267 17.1% Speak English less than very well3.5% of residents speak other language at home 129 100.0% Speak English very well
English speakers - Native, born elsewhere 14.0% of residents of East Riverdale speak English at home.
83.3% of residents speak Spanish at home 114 60.0% Speak English very well76 40.0% Speak English less than very well
English speakers - Foreign-born 16.0% of residents of East Riverdale speak English at home.
69.9% of residents speak Spanish at home 1,042 15.1% Speak English very well5,872 84.9% Speak English less than very well10.9% of residents speak other language at home 368 34.1% Speak English very well711 65.9% Speak English less than very well
White (Caucasian) - Speak only English Native:
53.7% (732)Foreign-born:
31.6% (290)
White (Caucasian) - Speak another language Native:
43.0% (587)Foreign-born:
71.1% (654)
Black or African American - Speak only English Native:
93.3% (2,568)Foreign-born:
47.8% (622)
Black or African American - Speak another language Native:
7.1% (196)Foreign-born:
50.8% (661)
American Indian / Alaska Native - Speak another language Native:
100.0% (35)Foreign-born:
99.9% (468)
Asian - Speak only English Native:
9.8% (3)Foreign-born:
18.1% (114)
Asian - Speak another language Native:
100.0% (33)Foreign-born:
82.7% (522)
Other race - Speak only English Native:
6.4% (155)Foreign-born:
7.5% (414)
Other race - Speak another language Native:
92.1% (2,241)Foreign-born:
91.7% (5,067)
Two or more races - Speak only English Native:
46.3% (313)Foreign-born:
5.5% (39)
Two or more races - Speak another language Native:
56.7% (384)Foreign-born:
98.3% (690)
White alone - Speak only English Native:
80.8% (692)Foreign-born:
48.0% (101)
White alone - Speak another language Native:
22.3% (191)Foreign-born:
52.9% (112)
Hispanic or Latino - Speak only English Native:
8.5% (296)Foreign-born:
7.8% (595)
Hispanic or Latino - Speak another language Native:
90.3% (3,161)Foreign-born:
91.3% (6,939)
Foreign-born residents in East Riverdale 10,154 residents are foreign born (42.9% Latin America ).
This city:
56.8%Maryland:
15.7%
Marital status for residents in East Riverdale Marital status - White (Caucasian) population 15 years and over
Males 41.6% Never married47.9% Now married0.7% Separated1.5% Widowed8.3% DivorcedFemales 33.9% Never married44.4% Now married12.0% Separated3.0% Widowed6.8% DivorcedWomen who gave birth in the past 12 months Now married:
100.0% (8)Unmarried:
0.0% (0)
Women who did not give birth in the past 12 months Now married:
48.1% (319)Unmarried:
51.9% (344)
Marital status - Black or African American population 15 years and over
Males 59.3% Never married30.9% Now married0.5% Separated4.9% Widowed4.4% DivorcedFemales 40.6% Never married29.8% Now married6.2% Separated10.9% Widowed12.5% DivorcedWomen who gave birth in the past 12 months Now married:
100.0% (26)Unmarried:
0.0% (0)
Women who did not give birth in the past 12 months Now married:
29.4% (222)Unmarried:
70.6% (533)
Marital status - American Indian / Alaska Native population 15 years and over
Males 0.0% Never married32.8% Now married0.0% Separated0.0% Widowed67.2% DivorcedFemales 30.1% Never married42.5% Now married0.0% Separated0.0% Widowed27.4% DivorcedWomen who did not give birth in the past 12 months Now married:
0.0% (0)Unmarried:
100.0% (33)
Marital status - Asian population 15 years and over
Males 26.8% Never married70.0% Now married0.0% Separated0.0% Widowed3.3% DivorcedFemales 30.5% Never married64.0% Now married0.0% Separated5.5% Widowed0.0% DivorcedWomen who gave birth in the past 12 months Now married:
100.0% (10)Unmarried:
0.0% (0)
Women who did not give birth in the past 12 months Now married:
75.0% (77)Unmarried:
25.0% (26)
Marital status - Other race population 15 years and over
Males 60.0% Never married30.3% Now married6.0% Separated0.0% Widowed3.8% DivorcedFemales 59.4% Never married33.4% Now married0.8% Separated4.1% Widowed2.3% DivorcedWomen who gave birth in the past 12 months Now married:
64.8% (66)Unmarried:
35.2% (36)
Women who did not give birth in the past 12 months Now married:
30.4% (698)Unmarried:
69.6% (1,601)
Marital status - Two or more races population 15 years and over
Males 71.2% Never married28.8% Now married0.0% Separated0.0% Widowed0.0% DivorcedFemales 53.0% Never married39.8% Now married0.6% Separated6.6% Widowed0.0% DivorcedWomen who gave birth in the past 12 months Now married:
44.3% (84)Unmarried:
55.7% (105)
Women who did not give birth in the past 12 months Now married:
33.8% (54)Unmarried:
66.2% (106)
Marital status - White alone, not Hispanic / Latino population 15 years and over
Males 32.3% Never married60.8% Now married0.0% Separated3.6% Widowed3.4% DivorcedFemales 17.2% Never married56.8% Now married3.4% Separated6.9% Widowed15.7% DivorcedWomen who did not give birth in the past 12 months Now married:
67.5% (158)Unmarried:
32.5% (76)
Marital status - Hispanic or Latino population 15 years and over
Males 57.3% Never married31.9% Now married4.4% Separated0.0% Widowed6.3% DivorcedFemales 54.3% Never married35.5% Now married4.2% Separated3.1% Widowed2.9% DivorcedWomen who gave birth in the past 12 months Now married:
53.9% (149)Unmarried:
46.1% (128)
Women who did not give birth in the past 12 months Now married:
32.9% (932)Unmarried:
67.1% (1,898)
Ancestries in East Riverdale
662 4.7% Afghan445 3.2% Nigerian304 2.2% African192 1.4% Guyanese140 1.0% Jamaican123 0.9% American113 0.8% West Indian78 0.6% English61 0.4% Irish61 0.4% Slavic60 0.4% Australian56 0.4% German33 0.2% Italian28 0.2% Swedish16 0.1% Ethiopian13 0.09% Iraqi13 0.09% Scottish12 0.09% Polish11 0.08% Greek11 0.08% Haitian7 0.05% Norwegian4 0.03% British
Children Nativity (place of birth) in East Riverdale
Children under 6 years - Living with two parents Both parents native 11 100.0% NativeBoth parents foreign-born 571 72.6% Native216 27.4% Foreign-bornOne native, one foreign-born parent 160 100.0% NativeChildren under 6 years - Living with one parent Native parent 203 99.4% Native1 0.6% Foreign-bornForeign-born parent 457 58.2% Native329 41.8% Foreign-bornChildren 6 to 17 years - Living with two parents Both parents native 2 100.0% Foreign-bornBoth parents foreign-born 1,106 68.1% Native518 31.9% Foreign-bornOne native, one foreign-born parent 212 100.0% NativeChildren 6 to 17 years - Living with one parent Foreign-born parent 1,558 62.6% Native929 37.4% Foreign-born
Grandparents responsible for own grandchildren in East Riverdale
Grandparents (30 to 59 years) Black or African American 56 100.0% Not responsible for grandchildrenAmerican Indian / Alaska Native 22 100.0% Not responsible for grandchildrenOther race 68 54.4% Responsible for grandchildren57 45.6% Not responsible for grandchildrenTwo or more races 18 100.0% Not responsible for grandchildrenHispanic or Latino 63 44.0% Responsible for grandchildren81 56.0% Not responsible for grandchildrenGrandparents (60 years and over) Black or African American 55 45.3% Responsible for grandchildren66 54.7% Not responsible for grandchildrenOther race 40 28.5% Responsible for grandchildren100 71.5% Not responsible for grandchildrenHispanic or Latino 35 23.1% Responsible for grandchildren115 76.9% Not responsible for grandchildren