Races in East Greenwich, Rhode Island (RI) Detailed Stats
Ancestries, Foreign-born residents, place of birth

Recent posts about races in East Greenwich, Rhode Island on our local forum with over 2,400,000 registered users:
 | Relocate to East Greenwich? (86 replies) |
| House buyers flooding in from MA & NYC (90 replies) |
| Top Democrats Flock to One of Whitest and Most Affluent RI Communities (138 replies) |
| Demographic trends in New England (100 replies) |
| Crazy Rhode Island real estate market (525 replies) |
| 33 Essential Providence Restaurants, per Eater (110 replies) |
4.8% of East Greenwich, RI residents are foreign-born (2.5% born in Europe, 1.4% born in Asia), which is 192.8% less than the foreign-born rate of 14.0% across the entire state of Rhode Island.
Race distribution in East Greenwich

- 12,30895.1%White alone
- 3202.5%Asian alone
- 1170.9%Hispanic
- 930.7%Two or more races
- 840.6%Black alone
- 170.1%Other race alone
- 80.06%American Indian alone
- 10.01%Native Hawaiian and Other
Pacific Islander alone

2000
2022
-
- 858,43381.9%White alone
- 90,8208.7%Hispanic
- 41,9224.0%Black alone
- 23,4162.2%Asian alone
- 20,8162.0%Two or more races
- 8,4110.8%Other race alone
- 4,1810.4%American Indian alone
- 3200.03%Native Hawaiian and Other
Pacific Islander alone

-
- 745,82568.2%White alone
- 191,97917.6%Hispanic
- 56,7385.2%Two or more races
- 51,3264.7%Black alone
- 37,2343.4%Asian alone
- 9,5140.9%Other race alone
- 9780.09%American Indian alone
- 1400.01%Native Hawaiian and Other
Pacific Islander alone

Income and house value in East Greenwich
- Median household income in 2022
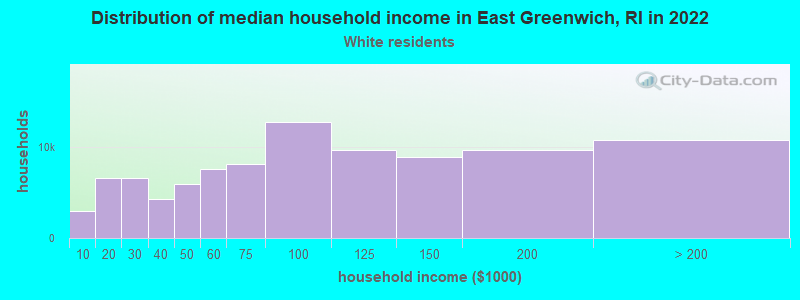
- $116,130White non-Hispanic householders
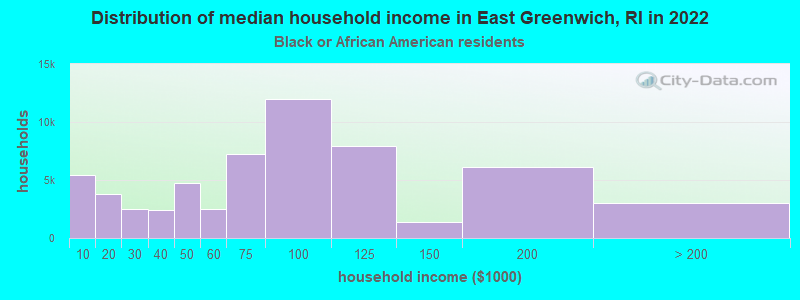
- $163,901Black householders
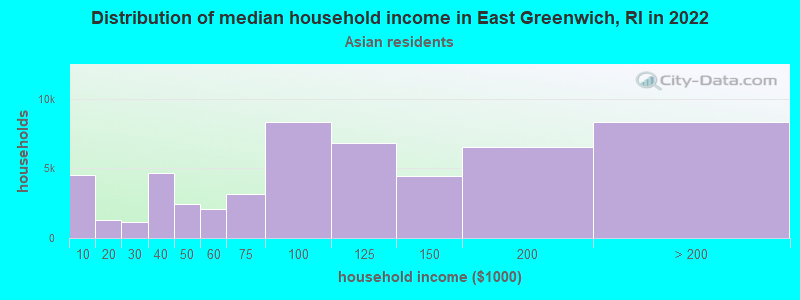
- over $200,000Asian householders
- over $200,000Some other race householders
- $137,499Two or more races householders
- $177,250Hispanic or Latino race householders
- Median 2022 house value
- $704,286White Non-Hispanic householders
- $777,963Black or African American householders
- $902,403Asian householders
- $398,844Some other race householders
- $326,327Two or more races householders
- $957,226Hispanic or Latino householders
Household income for White non-Hispanic householders
Household income for Black householders
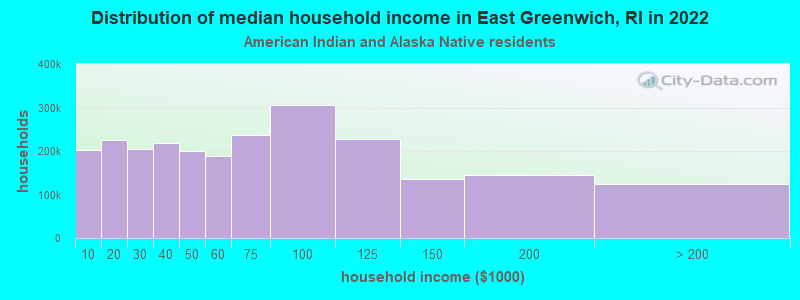
Household income for American Indian and Alaska Native householders
Household income for Asian householders
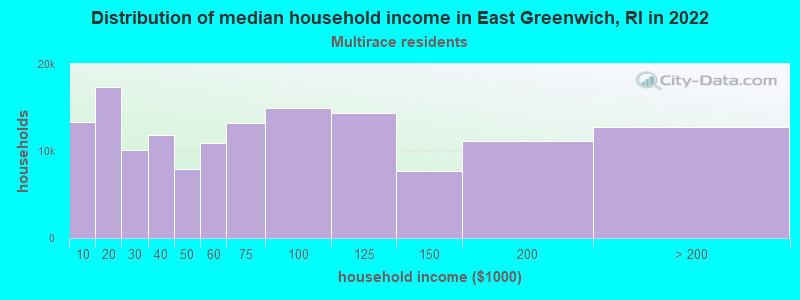
Household income for Two or more races householders
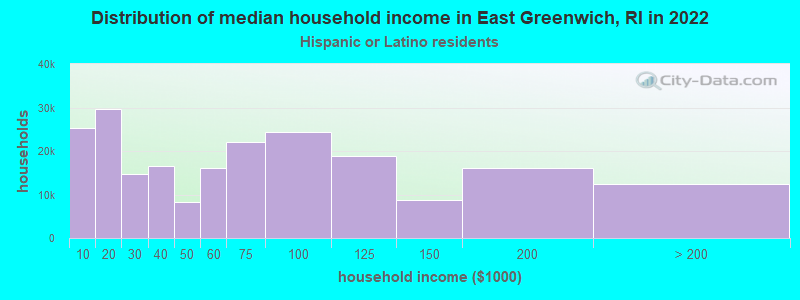
Household income for Hispanic or Latino race householders
Foreign-born residents in East Greenwich
619 residents are foreign born (2.5% Europe, 1.4% Asia).
| This city: | 4.8% |
| Rhode Island: | 11.4% |
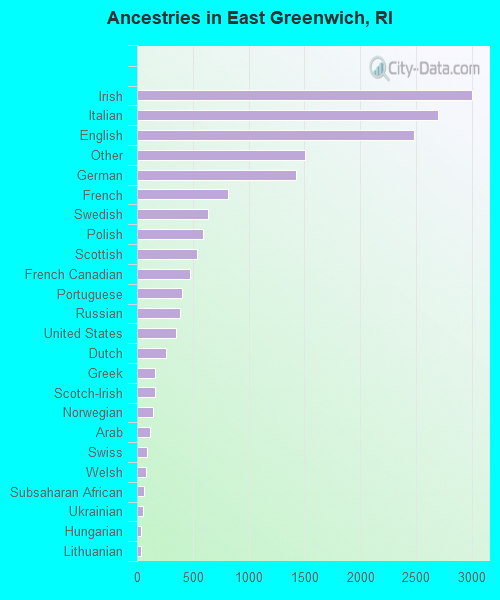
Ancestries in East Greenwich

- 3,00418.1%Irish
- 2,69616.3%Italian
- 2,48415.0%English
- 1,5099.1%Other
- 1,4248.6%German
- 8124.9%French
- 6353.8%Swedish
- 5903.6%Polish
- 5383.2%Scottish
- 4712.8%French Canadian
- 4062.5%Portuguese
- 3872.3%Russian
- 3522.1%United States
- 2621.6%Dutch
- 1651.0%Greek
- 1570.9%Scotch-Irish
- 1470.9%Norwegian
- 1140.7%Arab
- 940.6%Swiss
- 840.5%Welsh
- 600.4%Subsaharan African
- 550.3%Ukrainian
- 390.2%Hungarian
- 370.2%Lithuanian
- 250.2%Danish
- 150.09%West Indian
- 90.05%Czech
Zip codes: 02818.