Races in Dumont, New Jersey (NJ) Detailed Stats
Data:
Races - White alone (%)
Races - White alone (% change since 2000)
Races - Black alone (%)
Races - Black alone (% change since 2000)
Races - American Indian alone (%)
Races - American Indian alone (% change since 2000)
Races - Asian alone (%)
Races - Asian alone (% change since 2000)
Races - Hispanic (%)
Races - Hispanic (% change since 2000)
Races - Native Hawaiian and Other Pacific Islander alone (%)
Races - Native Hawaiian and Other Pacific Islander alone (% change since 2000)
Races - Two or more races(%)
Races - Two or more races(% change since 2000)
Races - Other race alone (%)
Races - Other race alone (% change since 2000)
Racial diversity
Place of birth - Born in state of residence (%)
Place of birth - Born in state of residence (%) - White
Place of birth - Born in state of residence (%) - Black or African American
Place of birth - Born in state of residence (%) - Asian
Place of birth - Born in state of residence (%) - Hispanic or Latino
Place of birth - Born in state of residence (%) - American Indian and Alaska Native
Place of birth - Born in state of residence (%) - Multirace
Place of birth - Born in state of residence (%) - Other Race
Place of birth - Born in other state (%)
Place of birth - Born in other state (%) - White
Place of birth - Born in other state (%) - Black or African American
Place of birth - Born in other state (%) - Asian
Place of birth - Born in other state (%) - Hispanic or Latino
Place of birth - Born in other state (%) - American Indian and Alaska Native
Place of birth - Born in other state (%) - Multirace
Place of birth - Born in other state (%) - Other Race
Place of birth - Native, outside of US (%)
Place of birth - Native, outside of US (%) - White
Place of birth - Native, outside of US (%) - Black or African American
Place of birth - Native, outside of US (%) - Asian
Place of birth - Native, outside of US (%) - Hispanic or Latino
Place of birth - Native, outside of US (%) - American Indian and Alaska Native
Place of birth - Native, outside of US (%) - Multirace
Place of birth - Native, outside of US (%) - Other Race
Place of birth - Foreign born (%)
Place of birth - Foreign born (%) - White
Place of birth - Foreign born (%) - Black or African American
Place of birth - Foreign born (%) - Asian
Place of birth - Foreign born (%) - Hispanic or Latino
Place of birth - Foreign born (%) - American Indian and Alaska Native
Place of birth - Foreign born (%) - Multirace
Place of birth - Foreign born (%) - Other Race
Residents speaking English at home (%)
Residents speaking English at home - Born in the United States (%)
Residents speaking English at home - Native, born elsewhere (%)
Residents speaking English at home - Foreign born (%)
Residents speaking Spanish at home (%)
Residents speaking Spanish at home - Born in the United States (%)
Residents speaking Spanish at home - Native, born elsewhere (%)
Residents speaking Spanish at home - Foreign born (%)
Residents speaking other language at home (%)
Residents speaking other language at home - Born in the United States (%)
Residents speaking other language at home - Native, born elsewhere (%)
Residents speaking other language at home - Foreign born (%)
Marital status - Never married (%)
Marital status - Now married (%)
Marital status - Separated (%)
Marital status - Widowed (%)
Marital status - Divorced (%)
Ancestries Reported - Arab (%)
Ancestries Reported - Czech (%)
Ancestries Reported - Danish (%)
Ancestries Reported - Dutch (%)
Ancestries Reported - English (%)
Ancestries Reported - French (%)
Ancestries Reported - French Canadian (%)
Ancestries Reported - German (%)
Ancestries Reported - Greek (%)
Ancestries Reported - Hungarian (%)
Ancestries Reported - Irish (%)
Ancestries Reported - Italian (%)
Ancestries Reported - Lithuanian (%)
Ancestries Reported - Norwegian (%)
Ancestries Reported - Polish (%)
Ancestries Reported - Portuguese (%)
Ancestries Reported - Russian (%)
Ancestries Reported - Scotch-Irish (%)
Ancestries Reported - Scottish (%)
Ancestries Reported - Slovak (%)
Ancestries Reported - Subsaharan African (%)
Ancestries Reported - Swedish (%)
Ancestries Reported - Swiss (%)
Ancestries Reported - Ukrainian (%)
Ancestries Reported - United States (%)
Ancestries Reported - Welsh (%)
Ancestries Reported - West Indian (%)
Ancestries Reported - Other (%)
Geographical mobility - Same house 1 year ago (%)
Geographical mobility - Same house 1 year ago (%) - White
Geographical mobility - Same house 1 year ago (%) - Black or African American
Geographical mobility - Same house 1 year ago (%) - Asian
Geographical mobility - Same house 1 year ago (%) - Hispanic or Latino
Geographical mobility - Same house 1 year ago (%) - American Indian and Alaska Native
Geographical mobility - Same house 1 year ago (%) - Multirace
Geographical mobility - Same house 1 year ago (%) - Other Race
Geographical mobility - Moved within same county (%)
Geographical mobility - Moved within same county (%) - White
Geographical mobility - Moved within same county (%) - Black or African American
Geographical mobility - Moved within same county (%) - Asian
Geographical mobility - Moved within same county (%) - Hispanic or Latino
Geographical mobility - Moved within same county (%) - American Indian and Alaska Native
Geographical mobility - Moved within same county (%) - Multirace
Geographical mobility - Moved within same county (%) - Other Race
Geographical mobility - Moved from different county within same state (%)
Geographical mobility - Moved from different county within same state (%) - White
Geographical mobility - Moved from different county within same state (%) - Black or African American
Geographical mobility - Moved from different county within same state (%) - Asian
Geographical mobility - Moved from different county within same state (%) - Hispanic or Latino
Geographical mobility - Moved from different county within same state (%) - American Indian and Alaska Native
Geographical mobility - Moved from different county within same state (%) - Multirace
Geographical mobility - Moved from different county within same state (%) - Other Race
Geographical mobility - Moved from different state (%)
Geographical mobility - Moved from different state (%) - White
Geographical mobility - Moved from different state (%) - Black or African American
Geographical mobility - Moved from different state (%) - Asian
Geographical mobility - Moved from different state (%) - Hispanic or Latino
Geographical mobility - Moved from different state (%) - American Indian and Alaska Native
Geographical mobility - Moved from different state (%) - Multirace
Geographical mobility - Moved from different state (%) - Other Race
Geographical mobility - Moved from abroad (%)
Geographical mobility - Moved from abroad (%) - White
Geographical mobility - Moved from abroad (%) - Black or African American
Geographical mobility - Moved from abroad (%) - Asian
Geographical mobility - Moved from abroad (%) - Hispanic or Latino
Geographical mobility - Moved from abroad (%) - American Indian and Alaska Native
Geographical mobility - Moved from abroad (%) - Multirace
Geographical mobility - Moved from abroad (%) - Other Race
Place of birth for the foreign-born population - Ireland (%)
Place of birth for the foreign-born population - Denmark (%)
Place of birth for the foreign-born population - Norway (%)
Place of birth for the foreign-born population - Sweden (%)
Place of birth for the foreign-born population - United Kingdom (%)
Place of birth for the foreign-born population - England (%)
Place of birth for the foreign-born population - Scotland (%)
Place of birth for the foreign-born population - Other Northern Europe (%)
Place of birth for the foreign-born population - Austria (%)
Place of birth for the foreign-born population - Belgium (%)
Place of birth for the foreign-born population - France (%)
Place of birth for the foreign-born population - Germany (%)
Place of birth for the foreign-born population - Netherlands (%)
Place of birth for the foreign-born population - Switzerland (%)
Place of birth for the foreign-born population - Other Western Europe (%)
Place of birth for the foreign-born population - Greece (%)
Place of birth for the foreign-born population - Italy (%)
Place of birth for the foreign-born population - Portugal (%)
Place of birth for the foreign-born population - Spain (%)
Place of birth for the foreign-born population - Other Southern Europe (%)
Place of birth for the foreign-born population - Albania (%)
Place of birth for the foreign-born population - Belarus (%)
Place of birth for the foreign-born population - Bosnia and Herzegovina (%)
Place of birth for the foreign-born population - Bulgaria (%)
Place of birth for the foreign-born population - Croatia (%)
Place of birth for the foreign-born population - Czechoslovakia (%)
Place of birth for the foreign-born population - Hungary (%)
Place of birth for the foreign-born population - Latvia (%)
Place of birth for the foreign-born population - Lithuania (%)
Place of birth for the foreign-born population - North Macedonia (Macedonia) (%)
Place of birth for the foreign-born population - Moldova (%)
Place of birth for the foreign-born population - Poland (%)
Place of birth for the foreign-born population - Romania (%)
Place of birth for the foreign-born population - Russia (%)
Place of birth for the foreign-born population - Serbia (%)
Place of birth for the foreign-born population - Ukraine (%)
Place of birth for the foreign-born population - Other Eastern Europe (%)
Place of birth for the foreign-born population - China (%)
Place of birth for the foreign-born population - Hong Kong (%)
Place of birth for the foreign-born population - Taiwan (%)
Place of birth for the foreign-born population - Japan (%)
Place of birth for the foreign-born population - Korea (%)
Place of birth for the foreign-born population - Other Eastern Asia (%)
Place of birth for the foreign-born population - Afghanistan (%)
Place of birth for the foreign-born population - Bangladesh (%)
Place of birth for the foreign-born population - India (%)
Place of birth for the foreign-born population - Iran (%)
Place of birth for the foreign-born population - Kazakhstan (%)
Place of birth for the foreign-born population - Nepal (%)
Place of birth for the foreign-born population - Pakistan (%)
Place of birth for the foreign-born population - Sri Lanka (%)
Place of birth for the foreign-born population - Uzbekistan (%)
Place of birth for the foreign-born population - Other South Central Asia (%)
Place of birth for the foreign-born population - Burma (%)
Place of birth for the foreign-born population - Cambodia (%)
Place of birth for the foreign-born population - Indonesia (%)
Place of birth for the foreign-born population - Laos (%)
Place of birth for the foreign-born population - Malaysia (%)
Place of birth for the foreign-born population - Philippines (%)
Place of birth for the foreign-born population - Singapore (%)
Place of birth for the foreign-born population - Thailand (%)
Place of birth for the foreign-born population - Vietnam (%)
Place of birth for the foreign-born population - Other South Eastern Asia (%)
Place of birth for the foreign-born population - Armenia (%)
Place of birth for the foreign-born population - Iraq (%)
Place of birth for the foreign-born population - Israel (%)
Place of birth for the foreign-born population - Jordan (%)
Place of birth for the foreign-born population - Kuwait (%)
Place of birth for the foreign-born population - Lebanon (%)
Place of birth for the foreign-born population - Saudi Arabia (%)
Place of birth for the foreign-born population - Syria (%)
Place of birth for the foreign-born population - Turkey (%)
Place of birth for the foreign-born population - Yemen (%)
Place of birth for the foreign-born population - Other Western Asia (%)
Place of birth for the foreign-born population - Eritrea (%)
Place of birth for the foreign-born population - Ethiopia (%)
Place of birth for the foreign-born population - Kenya (%)
Place of birth for the foreign-born population - Somalia (%)
Place of birth for the foreign-born population - Uganda (%)
Place of birth for the foreign-born population - Zimbabwe (%)
Place of birth for the foreign-born population - Other Eastern Africa (%)
Place of birth for the foreign-born population - Cameroon (%)
Place of birth for the foreign-born population - Congo (%)
Place of birth for the foreign-born population - Democratic Republic of Congo (Zaire) (%)
Place of birth for the foreign-born population - Other Middle Africa (%)
Place of birth for the foreign-born population - Egypt (%)
Place of birth for the foreign-born population - Morocco (%)
Place of birth for the foreign-born population - Sudan (%)
Place of birth for the foreign-born population - Other Northern Africa (%)
Place of birth for the foreign-born population - South Africa (%)
Place of birth for the foreign-born population - Other Southern Africa (%)
Place of birth for the foreign-born population - Cabo Verde (%)
Place of birth for the foreign-born population - Ghana (%)
Place of birth for the foreign-born population - Liberia (%)
Place of birth for the foreign-born population - Nigeria (%)
Place of birth for the foreign-born population - Senegal (%)
Place of birth for the foreign-born population - Sierra Leone (%)
Place of birth for the foreign-born population - Other Western Africa (%)
Place of birth for the foreign-born population - Australia (%)
Place of birth for the foreign-born population - New Zealand (%)
Place of birth for the foreign-born population - Fiji (%)
Place of birth for the foreign-born population - Micronesia (%)
Place of birth for the foreign-born population - Bahamas (%)
Place of birth for the foreign-born population - Barbados (%)
Place of birth for the foreign-born population - Cuba (%)
Place of birth for the foreign-born population - Dominica (%)
Place of birth for the foreign-born population - Dominican Republic (%)
Place of birth for the foreign-born population - Grenada (%)
Place of birth for the foreign-born population - Haiti (%)
Place of birth for the foreign-born population - Jamaica (%)
Place of birth for the foreign-born population - St. Vincent and the Grenadines (%)
Place of birth for the foreign-born population - Trinidad and Tobago (%)
Place of birth for the foreign-born population - West Indies (%)
Place of birth for the foreign-born population - Other Caribbean (%)
Place of birth for the foreign-born population - Belize (%)
Place of birth for the foreign-born population - Costa Rica (%)
Place of birth for the foreign-born population - El Salvador (%)
Place of birth for the foreign-born population - Guatemala (%)
Place of birth for the foreign-born population - Honduras (%)
Place of birth for the foreign-born population - Mexico (%)
Place of birth for the foreign-born population - Nicaragua (%)
Place of birth for the foreign-born population - Panama (%)
Place of birth for the foreign-born population - Other Central America (%)
Place of birth for the foreign-born population - Argentina (%)
Place of birth for the foreign-born population - Bolivia (%)
Place of birth for the foreign-born population - Brazil (%)
Place of birth for the foreign-born population - Chile (%)
Place of birth for the foreign-born population - Colombia (%)
Place of birth for the foreign-born population - Ecuador (%)
Place of birth for the foreign-born population - Guyana (%)
Place of birth for the foreign-born population - Peru (%)
Place of birth for the foreign-born population - Uruguay (%)
Place of birth for the foreign-born population - Venezuela (%)
Place of birth for the foreign-born population - Other South America (%)
Place of birth for the foreign-born population - Canada (%)
Place of birth for the foreign-born population - Other Northern America (%)
Place of birth for the foreign-born population - Other (%)
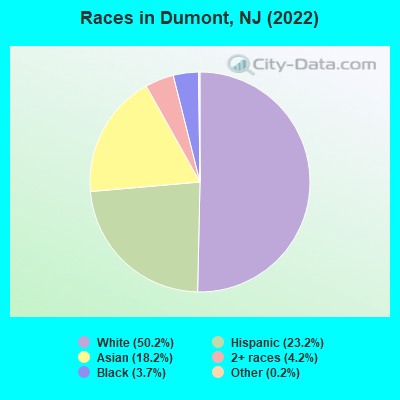
According to 2022 data, the most numerous races in Dumont, NJ are White alone (9,049 residents), Hispanic (4,174 residents), and Black alone (666 residents). 64.3% of Dumont residents speak English at home. 29.0% of Dumont, NJ residents are foreign-born (14.9% born in Asia, 9.7% born in Latin America, 3.3% born in Europe), which is 20.8% greater than the foreign-born rate of 23.0% across the entire state of New Jersey.
Race distribution in Dumont
2000 2022
5,557,209 66.0% White alone 1,117,191 13.3% Hispanic 1,096,171 13.0% Black alone 477,012 5.7% Asian alone 133,689 1.6% Two or more races 19,565 0.2% Other race alone 11,338 0.1% American Indian alone 2,175 0.03% Native Hawaiian and Other
4,766,476 51.5% White alone 2,028,470 21.9% Hispanic 1,111,632 12.0% Black alone 923,546 10.0% Asian alone 332,237 3.6% Two or more races 89,847 1.0% Other race alone 8,557 0.09% American Indian alone 934 0.01% Native Hawaiian and Other
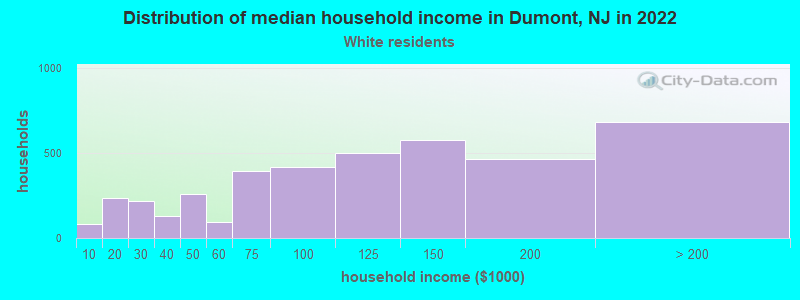
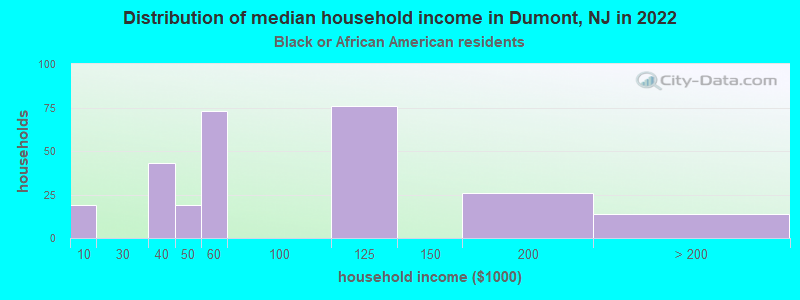
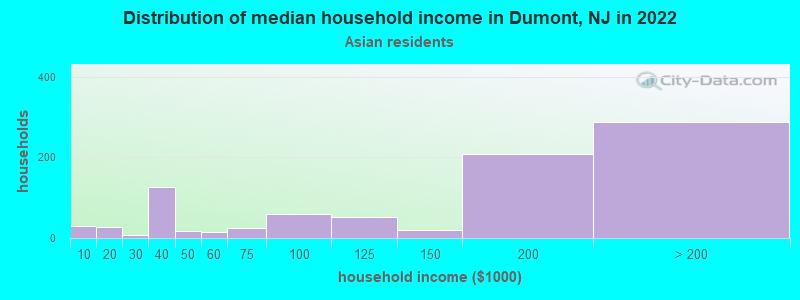
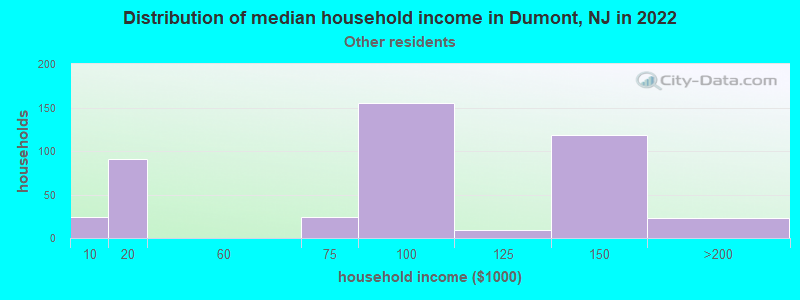
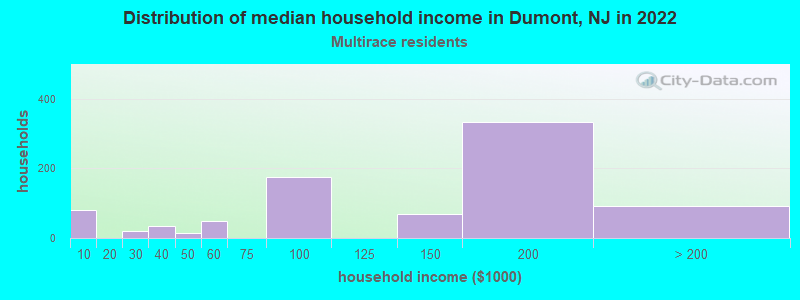
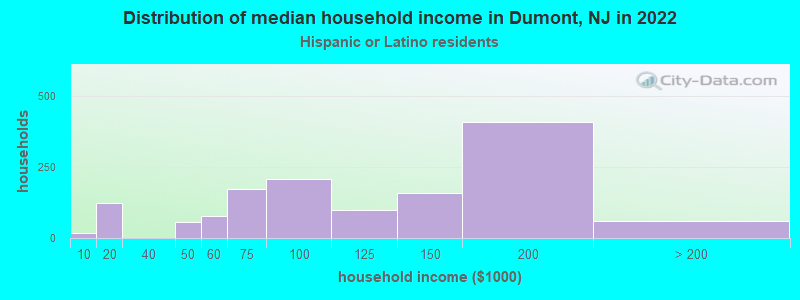
Income and house value in Dumont Median household income in 2022 $113,643 White non-Hispanic householders$158,881 Asian householders$87,914 Some other race householders$148,028 Two or more races householders$119,574 Hispanic or Latino race householdersMedian 2022 house value $443,071 White Non-Hispanic householders$565,456 Black or African American householders $512,776 Asian householders$431,339 Some other race householders$623,889 Two or more races householders$451,583 Hispanic or Latino householders
Median age by race in Dumont
48.8 Median age for White residents46.6 50.6 38.5 Median age for Black or African American residents40.6 37.5 -766,197,182.3 Median age for American Indian / Alaska Native residents-686,322,685.6 -753,722,794.2 55.5 Median age for Asian residents51.8 57.3 -510,460,250.5 Median age for Native Hawaiian / Pacific Islander residents-514,767,932.0 -713,070,378.3 31.0 Median age for Other race residents31.8 20.0 34.9 Median age for Two or more races residents29.0 38.5 49.5 Median age for White alone residents49.0 51.7 33.9 Median age for Hispanic or Latino residents34.5 32.2
Owner/renter occupied households by race in Dumont
House owners and renters - White residents 2,868 70.4% Owner occupied1,208 29.6% Renter occupiedHouse owners and renters - Black or African American residents 184 72.2% Owner occupied71 27.8% Renter occupiedHouse owners and renters - American Indian / Alaska Native residents 9 100.0% Owner occupiedHouse owners and renters - Asian residents 817 90.5% Owner occupied86 9.5% Renter occupiedHouse owners and renters - Other race residents 233 54.3% Owner occupied196 45.7% Renter occupiedHouse owners and renters - Two or more races residents 907 86.4% Owner occupied142 13.6% Renter occupiedHouse owners and renters - White alone residents 2,657 68.0% Owner occupied1,252 32.0% Renter occupiedHouse owners and renters - Hispanic or Latino residents 1,032 75.3% Owner occupied339 24.7% Renter occupied
Language usage in Dumont
English speakers - Total 64.3% of residents of Dumont speak English at home.
15.5% of residents speak Spanish at home 1,867 69.6% Speak English very well815 30.4% Speak English less than very well19.8% of residents speak other language at home 2,073 60.6% Speak English very well1,345 39.4% Speak English less than very well
English speakers - Born in the United States 86.4% of residents of Dumont speak English at home.
9.0% of residents speak Spanish at home 395 88.6% Speak English very well51 11.4% Speak English less than very well3.6% of residents speak other language at home 162 92.0% Speak English very well14 8.0% Speak English less than very well
English speakers - Native, born elsewhere 31.2% of residents of Dumont speak English at home.
76.7% of residents speak Spanish at home 79 54.5% Speak English very well66 45.5% Speak English less than very well
English speakers - Foreign-born 14.1% of residents of Dumont speak English at home.
28.4% of residents speak Spanish at home 784 53.0% Speak English very well696 47.0% Speak English less than very well57.0% of residents speak other language at home 1,652 55.6% Speak English very well1,320 44.4% Speak English less than very well
White (Caucasian) - Speak only English Native:
96.9% (7,912)Foreign-born:
33.5% (385)
White (Caucasian) - Speak another language Native:
4.8% (391)Foreign-born:
69.3% (798)
Black or African American - Speak only English Native:
88.2% (479)Foreign-born:
67.0% (76)
Black or African American - Speak another language Native:
11.8% (64)Foreign-born:
33.5% (38)
Asian - Speak only English Native:
74.9% (602)Foreign-born:
7.0% (170)
Asian - Speak another language Native:
26.4% (212)Foreign-born:
93.2% (2,266)
Other race - Speak another language Native:
73.3% (642)Foreign-born:
100.0% (782)
Two or more races - Speak only English Native:
68.9% (1,238)Foreign-born:
12.3% (108)
Two or more races - Speak another language Native:
29.7% (533)Foreign-born:
87.6% (769)
White alone - Speak only English Native:
97.2% (7,826)Foreign-born:
33.3% (302)
White alone - Speak another language Native:
3.1% (253)Foreign-born:
66.3% (602)
Hispanic or Latino - Speak only English Native:
42.8% (840)Foreign-born:
10.6% (181)
Hispanic or Latino - Speak another language Native:
56.3% (1,104)Foreign-born:
89.7% (1,528)
Foreign-born residents in Dumont 5,228 residents are foreign born (14.9% Asia , 9.7% Latin America , 3.3% Europe ).
This city:
29.0%New Jersey:
23.2%
Marital status for residents in Dumont Marital status - White (Caucasian) population 15 years and over
Males 31.3% Never married55.6% Now married1.6% Separated2.7% Widowed8.7% DivorcedFemales 22.6% Never married49.1% Now married0.0% Separated9.8% Widowed18.4% DivorcedWomen who gave birth in the past 12 months Now married:
87.3% (85)Unmarried:
12.7% (12)
Women who did not give birth in the past 12 months Now married:
40.7% (694)Unmarried:
59.3% (1,013)
Marital status - Black or African American population 15 years and over
Males 44.1% Never married55.9% Now married0.0% Separated0.0% Widowed0.0% DivorcedFemales 39.2% Never married38.6% Now married0.0% Separated5.8% Widowed16.4% DivorcedWomen who did not give birth in the past 12 months Now married:
25.0% (50)Unmarried:
75.0% (151)
Marital status - Asian population 15 years and over
Males 21.4% Never married75.7% Now married0.0% Separated2.8% Widowed0.0% DivorcedFemales 25.4% Never married62.6% Now married0.0% Separated10.1% Widowed1.9% DivorcedWomen who gave birth in the past 12 months Now married:
100.0% (45)Unmarried:
0.0% (0)
Women who did not give birth in the past 12 months Now married:
34.0% (190)Unmarried:
66.0% (368)
Marital status - Other race population 15 years and over
Males 20.1% Never married79.9% Now married0.0% Separated0.0% Widowed0.0% DivorcedFemales 32.2% Never married53.4% Now married0.0% Separated11.8% Widowed2.6% DivorcedWomen who did not give birth in the past 12 months Now married:
62.4% (392)Unmarried:
37.6% (237)
Marital status - Two or more races population 15 years and over
Males 42.0% Never married51.7% Now married0.0% Separated0.0% Widowed6.3% DivorcedFemales 18.7% Never married62.0% Now married0.0% Separated11.4% Widowed7.9% DivorcedWomen who did not give birth in the past 12 months Now married:
56.2% (407)Unmarried:
43.8% (317)
Marital status - White alone, not Hispanic / Latino population 15 years and over
Males 34.2% Never married51.9% Now married1.0% Separated3.1% Widowed9.9% DivorcedFemales 24.0% Never married47.6% Now married0.0% Separated9.5% Widowed18.9% DivorcedWomen who gave birth in the past 12 months Now married:
68.1% (30)Unmarried:
31.9% (14)
Women who did not give birth in the past 12 months Now married:
36.9% (659)Unmarried:
63.1% (1,124)
Marital status - Hispanic or Latino population 15 years and over
Males 19.6% Never married74.4% Now married2.6% Separated0.0% Widowed3.4% DivorcedFemales 14.9% Never married65.7% Now married0.0% Separated12.5% Widowed6.9% DivorcedWomen who gave birth in the past 12 months Now married:
100.0% (74)Unmarried:
0.0% (0)
Women who did not give birth in the past 12 months Now married:
71.2% (666)Unmarried:
28.8% (270)
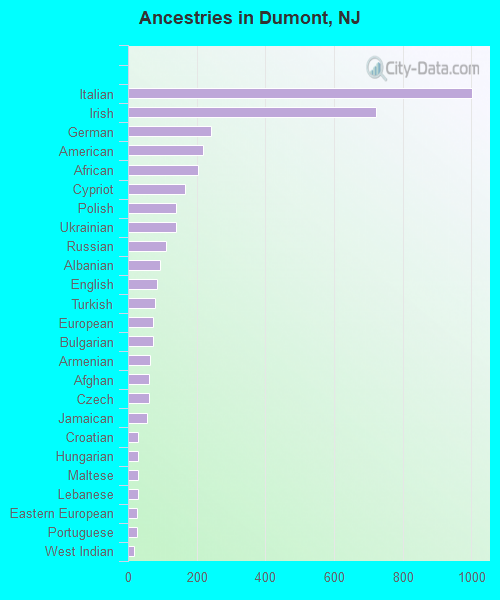
Ancestries in Dumont
1,001 11.1% Italian722 8.0% Irish241 2.7% German219 2.4% American205 2.3% African167 1.9% Cypriot139 1.5% Polish139 1.5% Ukrainian112 1.2% Russian94 1.0% Albanian83 0.9% English80 0.9% Turkish74 0.8% European73 0.8% Bulgarian65 0.7% Armenian60 0.7% Afghan60 0.7% Czech56 0.6% Jamaican30 0.3% Croatian30 0.3% Hungarian30 0.3% Maltese28 0.3% Lebanese25 0.3% Eastern European25 0.3% Portuguese18 0.2% West Indian14 0.2% Scottish11 0.1% Palestinian11 0.1% Slovak10 0.1% British6 0.07% Danish6 0.07% Ethiopian4 0.04% Austrian
Geographical mobility in Dumont Same house 1 year ago 9,013 95.4% White (Caucasian)676 100.0% Black or African American10 96.6% American Indian / Alaska Native2,943 90.3% Asian1,609 95.1% Other race2,681 85.1% Two or more races8,717 96.4% White alone, not Hispanic / Latino3,541 85.2% Hispanic or LatinoMoved within same county 348 3.7% White / Caucasian0 0.1% Black or African American102 3.1% Asian65 3.9% Other race231 7.3% Two or more races216 2.4% White alone, not Hispanic / Latino440 10.6% Hispanic or LatinoMoved within same state 39 0.4% White / Caucasian16 0.9% Other race46 0.5% White alone, not Hispanic / Latino18 0.4% Hispanic or LatinoMoved from different state 48 0.5% White / Caucasian10 1.4% Black or African American22 0.7% Asian5 0.3% Other race129 4.1% Two or more races34 0.4% White alone, not Hispanic / Latino104 2.5% Hispanic or LatinoMoved from abroad 8 0.1% White204 6.3% Asian90 2.8% Two or more races11 0.1% White alone, not Hispanic / Latino51 1.2% Hispanic or Latino
Children Nativity (place of birth) in Dumont
Children under 6 years - Living with two parents Both parents native 257 100.0% NativeBoth parents foreign-born 257 100.0% NativeOne native, one foreign-born parent 228 100.0% NativeChildren under 6 years - Living with one parent Native parent 32 100.0% NativeForeign-born parent 32 100.0% Foreign-bornChildren 6 to 17 years - Living with two parents Both parents native 719 97.9% Native16 2.1% Foreign-bornBoth parents foreign-born 641 85.0% Native113 15.0% Foreign-bornOne native, one foreign-born parent 374 97.8% Native8 2.2% Foreign-bornChildren 6 to 17 years - Living with one parent Native parent 260 100.0% NativeForeign-born parent 239 52.2% Native219 47.8% Foreign-born
Grandparents responsible for own grandchildren in Dumont
Grandparents (30 to 59 years) Asian 20 100.0% Not responsible for grandchildren
Grandparents (60 years and over) Asian 286 100.0% Not responsible for grandchildren