Races in DuPont, Washington (WA) Detailed Stats
Data:
Races - White alone (%)
Races - White alone (% change since 2000)
Races - Black alone (%)
Races - Black alone (% change since 2000)
Races - American Indian alone (%)
Races - American Indian alone (% change since 2000)
Races - Asian alone (%)
Races - Asian alone (% change since 2000)
Races - Hispanic (%)
Races - Hispanic (% change since 2000)
Races - Native Hawaiian and Other Pacific Islander alone (%)
Races - Native Hawaiian and Other Pacific Islander alone (% change since 2000)
Races - Two or more races(%)
Races - Two or more races(% change since 2000)
Races - Other race alone (%)
Races - Other race alone (% change since 2000)
Racial diversity
Place of birth - Born in state of residence (%)
Place of birth - Born in state of residence (%) - White
Place of birth - Born in state of residence (%) - Black or African American
Place of birth - Born in state of residence (%) - Asian
Place of birth - Born in state of residence (%) - Hispanic or Latino
Place of birth - Born in state of residence (%) - American Indian and Alaska Native
Place of birth - Born in state of residence (%) - Multirace
Place of birth - Born in state of residence (%) - Other Race
Place of birth - Born in other state (%)
Place of birth - Born in other state (%) - White
Place of birth - Born in other state (%) - Black or African American
Place of birth - Born in other state (%) - Asian
Place of birth - Born in other state (%) - Hispanic or Latino
Place of birth - Born in other state (%) - American Indian and Alaska Native
Place of birth - Born in other state (%) - Multirace
Place of birth - Born in other state (%) - Other Race
Place of birth - Native, outside of US (%)
Place of birth - Native, outside of US (%) - White
Place of birth - Native, outside of US (%) - Black or African American
Place of birth - Native, outside of US (%) - Asian
Place of birth - Native, outside of US (%) - Hispanic or Latino
Place of birth - Native, outside of US (%) - American Indian and Alaska Native
Place of birth - Native, outside of US (%) - Multirace
Place of birth - Native, outside of US (%) - Other Race
Place of birth - Foreign born (%)
Place of birth - Foreign born (%) - White
Place of birth - Foreign born (%) - Black or African American
Place of birth - Foreign born (%) - Asian
Place of birth - Foreign born (%) - Hispanic or Latino
Place of birth - Foreign born (%) - American Indian and Alaska Native
Place of birth - Foreign born (%) - Multirace
Place of birth - Foreign born (%) - Other Race
Residents speaking English at home (%)
Residents speaking English at home - Born in the United States (%)
Residents speaking English at home - Native, born elsewhere (%)
Residents speaking English at home - Foreign born (%)
Residents speaking Spanish at home (%)
Residents speaking Spanish at home - Born in the United States (%)
Residents speaking Spanish at home - Native, born elsewhere (%)
Residents speaking Spanish at home - Foreign born (%)
Residents speaking other language at home (%)
Residents speaking other language at home - Born in the United States (%)
Residents speaking other language at home - Native, born elsewhere (%)
Residents speaking other language at home - Foreign born (%)
Marital status - Never married (%)
Marital status - Now married (%)
Marital status - Separated (%)
Marital status - Widowed (%)
Marital status - Divorced (%)
Ancestries Reported - Arab (%)
Ancestries Reported - Czech (%)
Ancestries Reported - Danish (%)
Ancestries Reported - Dutch (%)
Ancestries Reported - English (%)
Ancestries Reported - French (%)
Ancestries Reported - French Canadian (%)
Ancestries Reported - German (%)
Ancestries Reported - Greek (%)
Ancestries Reported - Hungarian (%)
Ancestries Reported - Irish (%)
Ancestries Reported - Italian (%)
Ancestries Reported - Lithuanian (%)
Ancestries Reported - Norwegian (%)
Ancestries Reported - Polish (%)
Ancestries Reported - Portuguese (%)
Ancestries Reported - Russian (%)
Ancestries Reported - Scotch-Irish (%)
Ancestries Reported - Scottish (%)
Ancestries Reported - Slovak (%)
Ancestries Reported - Subsaharan African (%)
Ancestries Reported - Swedish (%)
Ancestries Reported - Swiss (%)
Ancestries Reported - Ukrainian (%)
Ancestries Reported - United States (%)
Ancestries Reported - Welsh (%)
Ancestries Reported - West Indian (%)
Ancestries Reported - Other (%)
Geographical mobility - Same house 1 year ago (%)
Geographical mobility - Same house 1 year ago (%) - White
Geographical mobility - Same house 1 year ago (%) - Black or African American
Geographical mobility - Same house 1 year ago (%) - Asian
Geographical mobility - Same house 1 year ago (%) - Hispanic or Latino
Geographical mobility - Same house 1 year ago (%) - American Indian and Alaska Native
Geographical mobility - Same house 1 year ago (%) - Multirace
Geographical mobility - Same house 1 year ago (%) - Other Race
Geographical mobility - Moved within same county (%)
Geographical mobility - Moved within same county (%) - White
Geographical mobility - Moved within same county (%) - Black or African American
Geographical mobility - Moved within same county (%) - Asian
Geographical mobility - Moved within same county (%) - Hispanic or Latino
Geographical mobility - Moved within same county (%) - American Indian and Alaska Native
Geographical mobility - Moved within same county (%) - Multirace
Geographical mobility - Moved within same county (%) - Other Race
Geographical mobility - Moved from different county within same state (%)
Geographical mobility - Moved from different county within same state (%) - White
Geographical mobility - Moved from different county within same state (%) - Black or African American
Geographical mobility - Moved from different county within same state (%) - Asian
Geographical mobility - Moved from different county within same state (%) - Hispanic or Latino
Geographical mobility - Moved from different county within same state (%) - American Indian and Alaska Native
Geographical mobility - Moved from different county within same state (%) - Multirace
Geographical mobility - Moved from different county within same state (%) - Other Race
Geographical mobility - Moved from different state (%)
Geographical mobility - Moved from different state (%) - White
Geographical mobility - Moved from different state (%) - Black or African American
Geographical mobility - Moved from different state (%) - Asian
Geographical mobility - Moved from different state (%) - Hispanic or Latino
Geographical mobility - Moved from different state (%) - American Indian and Alaska Native
Geographical mobility - Moved from different state (%) - Multirace
Geographical mobility - Moved from different state (%) - Other Race
Geographical mobility - Moved from abroad (%)
Geographical mobility - Moved from abroad (%) - White
Geographical mobility - Moved from abroad (%) - Black or African American
Geographical mobility - Moved from abroad (%) - Asian
Geographical mobility - Moved from abroad (%) - Hispanic or Latino
Geographical mobility - Moved from abroad (%) - American Indian and Alaska Native
Geographical mobility - Moved from abroad (%) - Multirace
Geographical mobility - Moved from abroad (%) - Other Race
Place of birth for the foreign-born population - Ireland (%)
Place of birth for the foreign-born population - Denmark (%)
Place of birth for the foreign-born population - Norway (%)
Place of birth for the foreign-born population - Sweden (%)
Place of birth for the foreign-born population - United Kingdom (%)
Place of birth for the foreign-born population - England (%)
Place of birth for the foreign-born population - Scotland (%)
Place of birth for the foreign-born population - Other Northern Europe (%)
Place of birth for the foreign-born population - Austria (%)
Place of birth for the foreign-born population - Belgium (%)
Place of birth for the foreign-born population - France (%)
Place of birth for the foreign-born population - Germany (%)
Place of birth for the foreign-born population - Netherlands (%)
Place of birth for the foreign-born population - Switzerland (%)
Place of birth for the foreign-born population - Other Western Europe (%)
Place of birth for the foreign-born population - Greece (%)
Place of birth for the foreign-born population - Italy (%)
Place of birth for the foreign-born population - Portugal (%)
Place of birth for the foreign-born population - Spain (%)
Place of birth for the foreign-born population - Other Southern Europe (%)
Place of birth for the foreign-born population - Albania (%)
Place of birth for the foreign-born population - Belarus (%)
Place of birth for the foreign-born population - Bosnia and Herzegovina (%)
Place of birth for the foreign-born population - Bulgaria (%)
Place of birth for the foreign-born population - Croatia (%)
Place of birth for the foreign-born population - Czechoslovakia (%)
Place of birth for the foreign-born population - Hungary (%)
Place of birth for the foreign-born population - Latvia (%)
Place of birth for the foreign-born population - Lithuania (%)
Place of birth for the foreign-born population - North Macedonia (Macedonia) (%)
Place of birth for the foreign-born population - Moldova (%)
Place of birth for the foreign-born population - Poland (%)
Place of birth for the foreign-born population - Romania (%)
Place of birth for the foreign-born population - Russia (%)
Place of birth for the foreign-born population - Serbia (%)
Place of birth for the foreign-born population - Ukraine (%)
Place of birth for the foreign-born population - Other Eastern Europe (%)
Place of birth for the foreign-born population - China (%)
Place of birth for the foreign-born population - Hong Kong (%)
Place of birth for the foreign-born population - Taiwan (%)
Place of birth for the foreign-born population - Japan (%)
Place of birth for the foreign-born population - Korea (%)
Place of birth for the foreign-born population - Other Eastern Asia (%)
Place of birth for the foreign-born population - Afghanistan (%)
Place of birth for the foreign-born population - Bangladesh (%)
Place of birth for the foreign-born population - India (%)
Place of birth for the foreign-born population - Iran (%)
Place of birth for the foreign-born population - Kazakhstan (%)
Place of birth for the foreign-born population - Nepal (%)
Place of birth for the foreign-born population - Pakistan (%)
Place of birth for the foreign-born population - Sri Lanka (%)
Place of birth for the foreign-born population - Uzbekistan (%)
Place of birth for the foreign-born population - Other South Central Asia (%)
Place of birth for the foreign-born population - Burma (%)
Place of birth for the foreign-born population - Cambodia (%)
Place of birth for the foreign-born population - Indonesia (%)
Place of birth for the foreign-born population - Laos (%)
Place of birth for the foreign-born population - Malaysia (%)
Place of birth for the foreign-born population - Philippines (%)
Place of birth for the foreign-born population - Singapore (%)
Place of birth for the foreign-born population - Thailand (%)
Place of birth for the foreign-born population - Vietnam (%)
Place of birth for the foreign-born population - Other South Eastern Asia (%)
Place of birth for the foreign-born population - Armenia (%)
Place of birth for the foreign-born population - Iraq (%)
Place of birth for the foreign-born population - Israel (%)
Place of birth for the foreign-born population - Jordan (%)
Place of birth for the foreign-born population - Kuwait (%)
Place of birth for the foreign-born population - Lebanon (%)
Place of birth for the foreign-born population - Saudi Arabia (%)
Place of birth for the foreign-born population - Syria (%)
Place of birth for the foreign-born population - Turkey (%)
Place of birth for the foreign-born population - Yemen (%)
Place of birth for the foreign-born population - Other Western Asia (%)
Place of birth for the foreign-born population - Eritrea (%)
Place of birth for the foreign-born population - Ethiopia (%)
Place of birth for the foreign-born population - Kenya (%)
Place of birth for the foreign-born population - Somalia (%)
Place of birth for the foreign-born population - Uganda (%)
Place of birth for the foreign-born population - Zimbabwe (%)
Place of birth for the foreign-born population - Other Eastern Africa (%)
Place of birth for the foreign-born population - Cameroon (%)
Place of birth for the foreign-born population - Congo (%)
Place of birth for the foreign-born population - Democratic Republic of Congo (Zaire) (%)
Place of birth for the foreign-born population - Other Middle Africa (%)
Place of birth for the foreign-born population - Egypt (%)
Place of birth for the foreign-born population - Morocco (%)
Place of birth for the foreign-born population - Sudan (%)
Place of birth for the foreign-born population - Other Northern Africa (%)
Place of birth for the foreign-born population - South Africa (%)
Place of birth for the foreign-born population - Other Southern Africa (%)
Place of birth for the foreign-born population - Cabo Verde (%)
Place of birth for the foreign-born population - Ghana (%)
Place of birth for the foreign-born population - Liberia (%)
Place of birth for the foreign-born population - Nigeria (%)
Place of birth for the foreign-born population - Senegal (%)
Place of birth for the foreign-born population - Sierra Leone (%)
Place of birth for the foreign-born population - Other Western Africa (%)
Place of birth for the foreign-born population - Australia (%)
Place of birth for the foreign-born population - New Zealand (%)
Place of birth for the foreign-born population - Fiji (%)
Place of birth for the foreign-born population - Micronesia (%)
Place of birth for the foreign-born population - Bahamas (%)
Place of birth for the foreign-born population - Barbados (%)
Place of birth for the foreign-born population - Cuba (%)
Place of birth for the foreign-born population - Dominica (%)
Place of birth for the foreign-born population - Dominican Republic (%)
Place of birth for the foreign-born population - Grenada (%)
Place of birth for the foreign-born population - Haiti (%)
Place of birth for the foreign-born population - Jamaica (%)
Place of birth for the foreign-born population - St. Vincent and the Grenadines (%)
Place of birth for the foreign-born population - Trinidad and Tobago (%)
Place of birth for the foreign-born population - West Indies (%)
Place of birth for the foreign-born population - Other Caribbean (%)
Place of birth for the foreign-born population - Belize (%)
Place of birth for the foreign-born population - Costa Rica (%)
Place of birth for the foreign-born population - El Salvador (%)
Place of birth for the foreign-born population - Guatemala (%)
Place of birth for the foreign-born population - Honduras (%)
Place of birth for the foreign-born population - Mexico (%)
Place of birth for the foreign-born population - Nicaragua (%)
Place of birth for the foreign-born population - Panama (%)
Place of birth for the foreign-born population - Other Central America (%)
Place of birth for the foreign-born population - Argentina (%)
Place of birth for the foreign-born population - Bolivia (%)
Place of birth for the foreign-born population - Brazil (%)
Place of birth for the foreign-born population - Chile (%)
Place of birth for the foreign-born population - Colombia (%)
Place of birth for the foreign-born population - Ecuador (%)
Place of birth for the foreign-born population - Guyana (%)
Place of birth for the foreign-born population - Peru (%)
Place of birth for the foreign-born population - Uruguay (%)
Place of birth for the foreign-born population - Venezuela (%)
Place of birth for the foreign-born population - Other South America (%)
Place of birth for the foreign-born population - Canada (%)
Place of birth for the foreign-born population - Other Northern America (%)
Place of birth for the foreign-born population - Other (%)
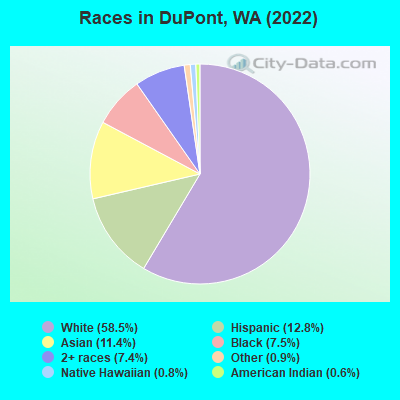
According to 2022 data, the most numerous races in DuPont, WA are White alone (5,875 residents), Hispanic (1,284 residents), and Asian alone (1,148 residents). 81.6% of DuPont residents speak English at home. 11.3% of DuPont, WA residents are foreign-born (9.3% born in Asia), which is 32.5% less than the foreign-born rate of 15.0% across the entire state of Washington.
Race distribution in DuPont
2000 2022
4,652,490 78.9% White alone 441,509 7.5% Hispanic 319,401 5.4% Asian alone 184,631 3.1% Black alone 175,926 3.0% Two or more races 85,396 1.4% American Indian alone 22,779 0.4% Native Hawaiian and Other 11,989 0.2% Other race alone
4,941,456 63.5% White alone 1,093,313 14.0% Hispanic 755,832 9.7% Asian alone 523,448 6.7% Two or more races 299,537 3.8% Black alone 69,024 0.9% American Indian alone 52,231 0.7% Native Hawaiian and Other 50,945 0.7% Other race alone
Income and house value in DuPont Median household income in 2022 $112,593 White non-Hispanic householders$102,027 Asian householders$103,189 Some other race householders$129,870 Two or more races householders$119,023 Hispanic or Latino race householdersMedian 2022 house value $582,866 White Non-Hispanic householders$561,987 Black or African American householders $593,305 Asian householders$343,804 Two or more races householders$630,887 Hispanic or Latino householders
Median age by race in DuPont
37.0 Median age for White residents36.7 37.8 31.7 Median age for Black or African American residents30.3 33.5 26.0 Median age for American Indian / Alaska Native residents30.2 -519,527,701.6 45.1 Median age for Asian residents43.0 46.4 8.8 Median age for Native Hawaiian / Pacific Islander residents-736,612,021.1 -634,538,152.0 32.7 Median age for Other race residents38.7 34.5 22.1 Median age for Two or more races residents15.9 40.0 37.7 Median age for White alone residents36.9 38.2 31.6 Median age for Hispanic or Latino residents31.2 32.2
Owner/renter occupied households by race in DuPont
House owners and renters - White residents 1,497 55.3% Owner occupied1,212 44.7% Renter occupiedHouse owners and renters - Black or African American residents 119 45.8% Owner occupied141 54.2% Renter occupiedHouse owners and renters - American Indian / Alaska Native residents 10 100.0% Renter occupiedHouse owners and renters - Asian residents 455 89.5% Owner occupied53 10.5% Renter occupiedHouse owners and renters - Native Hawaiian / Pacific Islander residents 87 100.0% Renter occupiedHouse owners and renters - Other race residents 118 82.6% Owner occupied25 17.4% Renter occupiedHouse owners and renters - Two or more races residents 225 46.3% Owner occupied261 53.7% Renter occupiedHouse owners and renters - White alone residents 1,493 56.0% Owner occupied1,171 44.0% Renter occupiedHouse owners and renters - Hispanic or Latino residents 192 44.0% Owner occupied244 56.0% Renter occupied
Language usage in DuPont
English speakers - Total 81.6% of residents of DuPont speak English at home.
6.2% of residents speak Spanish at home 561 95.2% Speak English very well28 4.8% Speak English less than very well12.4% of residents speak other language at home 644 54.7% Speak English very well534 45.3% Speak English less than very well
English speakers - Born in the United States 95.7% of residents of DuPont speak English at home.
2.3% of residents speak Spanish at home 113 89.0% Speak English very well14 11.0% Speak English less than very well1.9% of residents speak other language at home 88 81.5% Speak English very well20 18.5% Speak English less than very well
English speakers - Native, born elsewhere 52.9% of residents of DuPont speak English at home.
32.9% of residents speak Spanish at home 270 96.8% Speak English very well9 3.2% Speak English less than very well8.6% of residents speak other language at home 54 74.0% Speak English very well19 26.0% Speak English less than very well
English speakers - Foreign-born 19.5% of residents of DuPont speak English at home.
5.3% of residents speak Spanish at home 62 100.0% Speak English very well76.9% of residents speak other language at home 461 51.2% Speak English very well440 48.8% Speak English less than very well
White (Caucasian) - Speak only English Native:
95.5% (5,406)Foreign-born:
17.5% (38)
White (Caucasian) - Speak another language Native:
3.9% (221)Foreign-born:
84.8% (187)
Black or African American - Speak only English Native:
99.6% (707)Foreign-born:
52.8% (9)
Asian - Speak only English Native:
68.0% (203)Foreign-born:
22.7% (180)
Asian - Speak another language Native:
32.5% (97)Foreign-born:
77.8% (616)
Two or more races - Speak only English Native:
61.1% (663)Foreign-born:
34.6% (44)
Two or more races - Speak another language Native:
42.3% (459)Foreign-born:
45.8% (58)
White alone - Speak only English Native:
96.1% (5,171)Foreign-born:
17.2% (41)
White alone - Speak another language Native:
3.5% (190)Foreign-born:
88.4% (209)
Hispanic or Latino - Speak another language Native:
37.0% (421)Foreign-born:
100.0% (69)
Foreign-born residents in DuPont 1,137 residents are foreign born (9.3% Asia ).
This city:
11.3%Washington:
14.9%
Marital status for residents in DuPont Marital status - White (Caucasian) population 15 years and over
Males 28.8% Never married62.1% Now married0.0% Separated2.0% Widowed7.0% DivorcedFemales 21.1% Never married65.7% Now married0.0% Separated4.1% Widowed9.1% DivorcedWomen who gave birth in the past 12 months Now married:
100.0% (145)Unmarried:
0.0% (0)
Women who did not give birth in the past 12 months Now married:
58.6% (832)Unmarried:
41.4% (588)
Marital status - Black or African American population 15 years and over
Males 27.7% Never married72.3% Now married0.0% Separated0.0% Widowed0.0% DivorcedFemales 31.8% Never married67.4% Now married0.0% Separated0.0% Widowed0.8% DivorcedWomen who did not give birth in the past 12 months Now married:
83.3% (118)Unmarried:
16.7% (24)
Marital status - American Indian / Alaska Native population 15 years and over
Males 32.9% Never married67.1% Now married0.0% Separated0.0% Widowed0.0% DivorcedFemales 67.6% Never married32.4% Now married0.0% Separated0.0% Widowed0.0% DivorcedWomen who did not give birth in the past 12 months Now married:
0.0% (0)Unmarried:
100.0% (23)
Marital status - Asian population 15 years and over
Males 9.0% Never married91.0% Now married0.0% Separated0.0% Widowed0.0% DivorcedFemales 25.5% Never married69.4% Now married0.0% Separated0.0% Widowed5.1% DivorcedWomen who gave birth in the past 12 months Now married:
100.0% (21)Unmarried:
0.0% (0)
Women who did not give birth in the past 12 months Now married:
51.7% (186)Unmarried:
48.3% (174)
Marital status - Other race population 15 years and over
Males 18.4% Never married80.3% Now married1.3% Separated0.0% Widowed0.0% DivorcedFemales 23.7% Never married42.1% Now married0.0% Separated0.0% Widowed34.2% DivorcedWomen who did not give birth in the past 12 months Now married:
42.1% (70)Unmarried:
57.9% (96)
Marital status - Two or more races population 15 years and over
Males 31.7% Never married62.1% Now married0.0% Separated0.0% Widowed6.2% DivorcedFemales 39.4% Never married56.6% Now married0.0% Separated0.0% Widowed4.0% DivorcedWomen who did not give birth in the past 12 months Now married:
83.7% (264)Unmarried:
16.2% (51)
Marital status - White alone, not Hispanic / Latino population 15 years and over
Males 29.6% Never married61.1% Now married0.0% Separated2.1% Widowed7.2% DivorcedFemales 22.5% Never married63.5% Now married0.0% Separated4.4% Widowed9.7% DivorcedWomen who gave birth in the past 12 months Now married:
100.0% (149)Unmarried:
0.0% (0)
Women who did not give birth in the past 12 months Now married:
54.0% (710)Unmarried:
46.0% (604)
Marital status - Hispanic or Latino population 15 years and over
Males 16.9% Never married77.3% Now married0.0% Separated0.0% Widowed5.9% DivorcedFemales 27.3% Never married63.2% Now married0.0% Separated0.0% Widowed9.5% DivorcedWomen who did not give birth in the past 12 months Now married:
80.9% (348)Unmarried:
19.1% (82)
Ancestries in DuPont
446 8.6% German253 4.9% English248 4.8% American223 4.3% Turkish214 4.1% Scottish184 3.5% European160 3.1% Irish141 2.7% Norwegian81 1.6% Italian81 1.6% Northern European61 1.2% Welsh37 0.7% Dutch34 0.7% Slovak30 0.6% Finnish17 0.3% Scandinavian15 0.3% Greek15 0.3% Ethiopian13 0.2% Portuguese12 0.2% Eastern European10 0.2% Canadian10 0.2% Scotch-Irish6 0.1% French
Children Nativity (place of birth) in DuPont
Children under 6 years - Living with two parents Both parents native 467 100.0% NativeBoth parents foreign-born 106 100.0% NativeOne native, one foreign-born parent 73 100.0% NativeChildren under 6 years - Living with one parent Native parent 51 100.0% NativeChildren 6 to 17 years - Living with two parents Both parents native 1,213 100.0% NativeBoth parents foreign-born 39 100.0% NativeOne native, one foreign-born parent 129 100.0% NativeChildren 6 to 17 years - Living with one parent Native parent 289 90.0% Native32 10.0% Foreign-bornForeign-born parent 49 72.0% Native19 28.0% Foreign-born
Grandparents responsible for own grandchildren in DuPont
Grandparents (30 to 59 years) White / Caucasian 13 100.0% Not responsible for grandchildrenBlack or African American 21 100.0% Not responsible for grandchildrenAsian 12 100.0% Not responsible for grandchildrenWhite alone, not Hispanic / Latino 13 100.0% Not responsible for grandchildren
Grandparents (60 years and over) White / Caucasian 6 100.0% Responsible for grandchildrenAsian 29 100.0% Responsible for grandchildrenWhite alone, not Hispanic / Latino 7 100.0% Responsible for grandchildren