Races in Downingtown, Pennsylvania (PA) Detailed Stats
Data:
Races - White alone (%)
Races - White alone (% change since 2000)
Races - Black alone (%)
Races - Black alone (% change since 2000)
Races - American Indian alone (%)
Races - American Indian alone (% change since 2000)
Races - Asian alone (%)
Races - Asian alone (% change since 2000)
Races - Hispanic (%)
Races - Hispanic (% change since 2000)
Races - Native Hawaiian and Other Pacific Islander alone (%)
Races - Native Hawaiian and Other Pacific Islander alone (% change since 2000)
Races - Two or more races(%)
Races - Two or more races(% change since 2000)
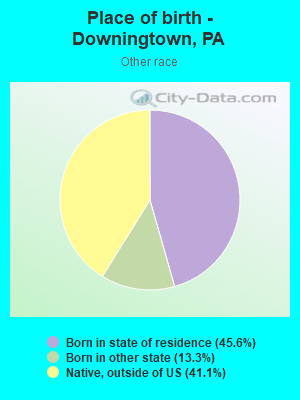
Races - Other race alone (%)
Races - Other race alone (% change since 2000)
Racial diversity
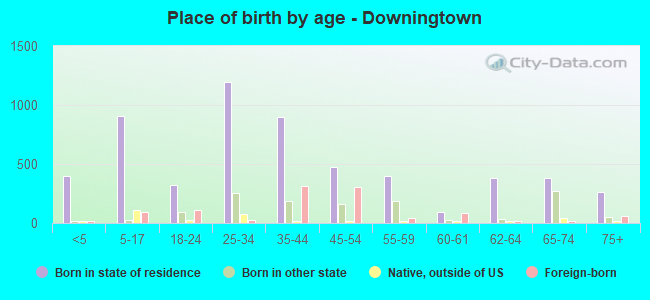
Place of birth - Born in state of residence (%)
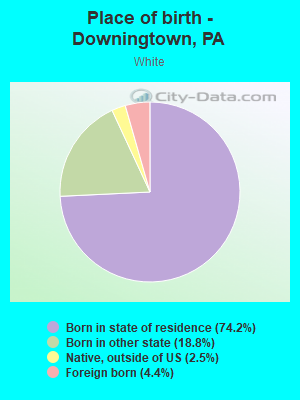
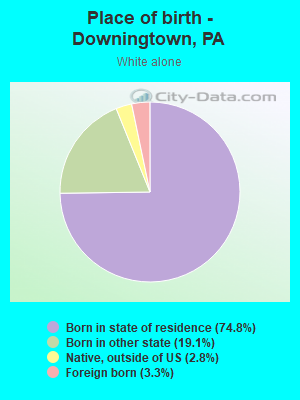
Place of birth - Born in state of residence (%) - White
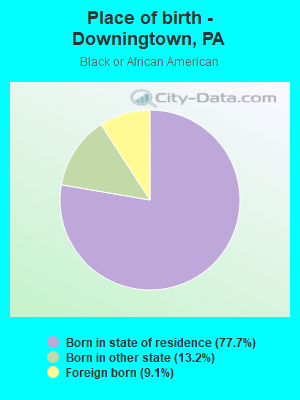
Place of birth - Born in state of residence (%) - Black or African American
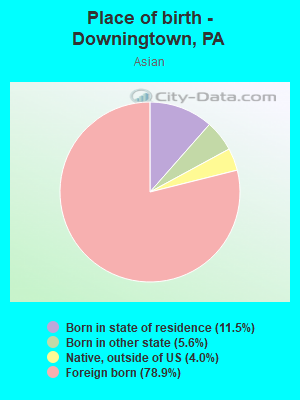
Place of birth - Born in state of residence (%) - Asian
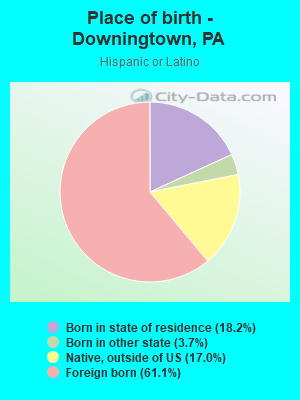
Place of birth - Born in state of residence (%) - Hispanic or Latino
Place of birth - Born in state of residence (%) - American Indian and Alaska Native
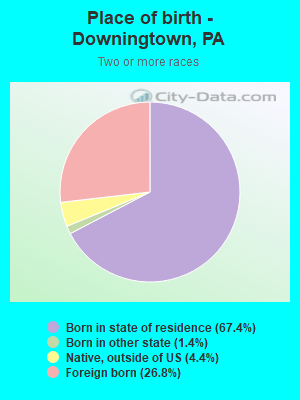
Place of birth - Born in state of residence (%) - Multirace
Place of birth - Born in state of residence (%) - Other Race
Place of birth - Born in other state (%)
Place of birth - Born in other state (%) - White
Place of birth - Born in other state (%) - Black or African American
Place of birth - Born in other state (%) - Asian
Place of birth - Born in other state (%) - Hispanic or Latino
Place of birth - Born in other state (%) - American Indian and Alaska Native
Place of birth - Born in other state (%) - Multirace
Place of birth - Born in other state (%) - Other Race
Place of birth - Native, outside of US (%)
Place of birth - Native, outside of US (%) - White
Place of birth - Native, outside of US (%) - Black or African American
Place of birth - Native, outside of US (%) - Asian
Place of birth - Native, outside of US (%) - Hispanic or Latino
Place of birth - Native, outside of US (%) - American Indian and Alaska Native
Place of birth - Native, outside of US (%) - Multirace
Place of birth - Native, outside of US (%) - Other Race
Place of birth - Foreign born (%)
Place of birth - Foreign born (%) - White
Place of birth - Foreign born (%) - Black or African American
Place of birth - Foreign born (%) - Asian
Place of birth - Foreign born (%) - Hispanic or Latino
Place of birth - Foreign born (%) - American Indian and Alaska Native
Place of birth - Foreign born (%) - Multirace
Place of birth - Foreign born (%) - Other Race
Residents speaking English at home (%)
Residents speaking English at home - Born in the United States (%)
Residents speaking English at home - Native, born elsewhere (%)
Residents speaking English at home - Foreign born (%)
Residents speaking Spanish at home (%)
Residents speaking Spanish at home - Born in the United States (%)
Residents speaking Spanish at home - Native, born elsewhere (%)
Residents speaking Spanish at home - Foreign born (%)
Residents speaking other language at home (%)
Residents speaking other language at home - Born in the United States (%)
Residents speaking other language at home - Native, born elsewhere (%)
Residents speaking other language at home - Foreign born (%)
Marital status - Never married (%)
Marital status - Now married (%)
Marital status - Separated (%)
Marital status - Widowed (%)
Marital status - Divorced (%)
Ancestries Reported - Arab (%)
Ancestries Reported - Czech (%)
Ancestries Reported - Danish (%)
Ancestries Reported - Dutch (%)
Ancestries Reported - English (%)
Ancestries Reported - French (%)
Ancestries Reported - French Canadian (%)
Ancestries Reported - German (%)
Ancestries Reported - Greek (%)
Ancestries Reported - Hungarian (%)
Ancestries Reported - Irish (%)
Ancestries Reported - Italian (%)
Ancestries Reported - Lithuanian (%)
Ancestries Reported - Norwegian (%)
Ancestries Reported - Polish (%)
Ancestries Reported - Portuguese (%)
Ancestries Reported - Russian (%)
Ancestries Reported - Scotch-Irish (%)
Ancestries Reported - Scottish (%)
Ancestries Reported - Slovak (%)
Ancestries Reported - Subsaharan African (%)
Ancestries Reported - Swedish (%)
Ancestries Reported - Swiss (%)
Ancestries Reported - Ukrainian (%)
Ancestries Reported - United States (%)
Ancestries Reported - Welsh (%)
Ancestries Reported - West Indian (%)
Ancestries Reported - Other (%)
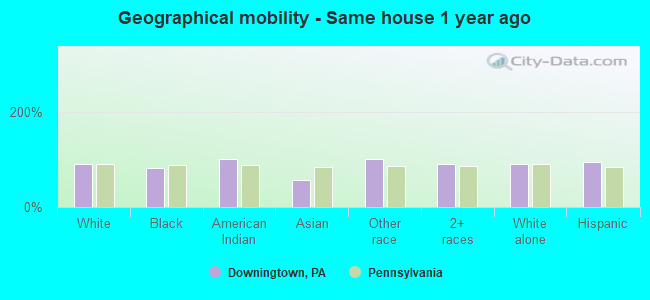
Geographical mobility - Same house 1 year ago (%)
Geographical mobility - Same house 1 year ago (%) - White
Geographical mobility - Same house 1 year ago (%) - Black or African American
Geographical mobility - Same house 1 year ago (%) - Asian
Geographical mobility - Same house 1 year ago (%) - Hispanic or Latino
Geographical mobility - Same house 1 year ago (%) - American Indian and Alaska Native
Geographical mobility - Same house 1 year ago (%) - Multirace
Geographical mobility - Same house 1 year ago (%) - Other Race
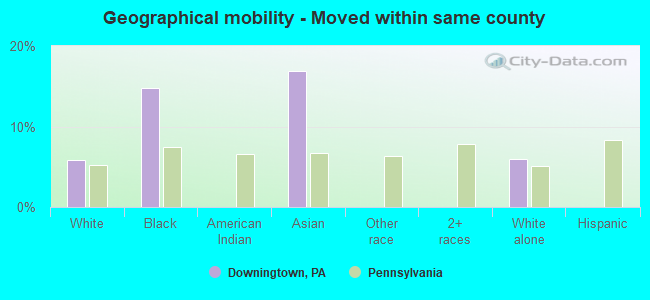
Geographical mobility - Moved within same county (%)
Geographical mobility - Moved within same county (%) - White
Geographical mobility - Moved within same county (%) - Black or African American
Geographical mobility - Moved within same county (%) - Asian
Geographical mobility - Moved within same county (%) - Hispanic or Latino
Geographical mobility - Moved within same county (%) - American Indian and Alaska Native
Geographical mobility - Moved within same county (%) - Multirace
Geographical mobility - Moved within same county (%) - Other Race
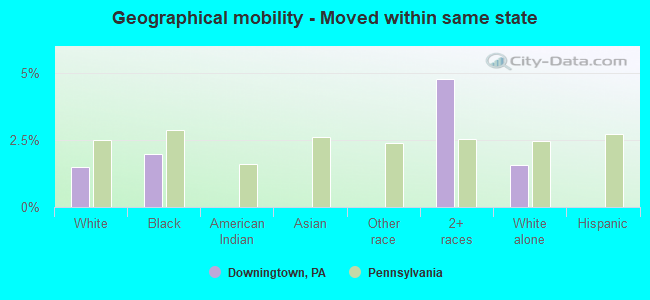
Geographical mobility - Moved from different county within same state (%)
Geographical mobility - Moved from different county within same state (%) - White
Geographical mobility - Moved from different county within same state (%) - Black or African American
Geographical mobility - Moved from different county within same state (%) - Asian
Geographical mobility - Moved from different county within same state (%) - Hispanic or Latino
Geographical mobility - Moved from different county within same state (%) - American Indian and Alaska Native
Geographical mobility - Moved from different county within same state (%) - Multirace
Geographical mobility - Moved from different county within same state (%) - Other Race
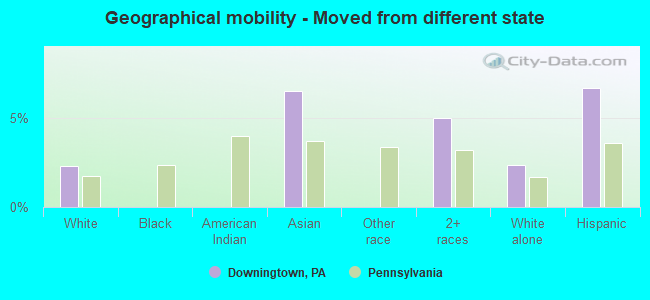
Geographical mobility - Moved from different state (%)
Geographical mobility - Moved from different state (%) - White
Geographical mobility - Moved from different state (%) - Black or African American
Geographical mobility - Moved from different state (%) - Asian
Geographical mobility - Moved from different state (%) - Hispanic or Latino
Geographical mobility - Moved from different state (%) - American Indian and Alaska Native
Geographical mobility - Moved from different state (%) - Multirace
Geographical mobility - Moved from different state (%) - Other Race
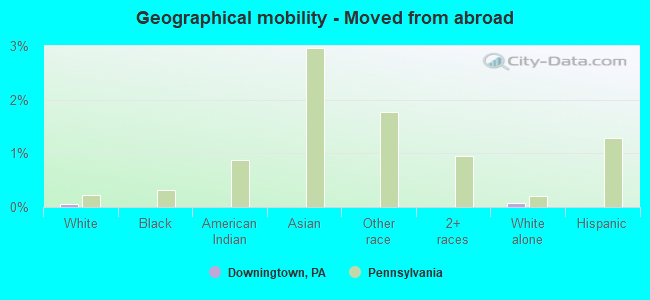
Geographical mobility - Moved from abroad (%)
Geographical mobility - Moved from abroad (%) - White
Geographical mobility - Moved from abroad (%) - Black or African American
Geographical mobility - Moved from abroad (%) - Asian
Geographical mobility - Moved from abroad (%) - Hispanic or Latino
Geographical mobility - Moved from abroad (%) - American Indian and Alaska Native
Geographical mobility - Moved from abroad (%) - Multirace
Geographical mobility - Moved from abroad (%) - Other Race
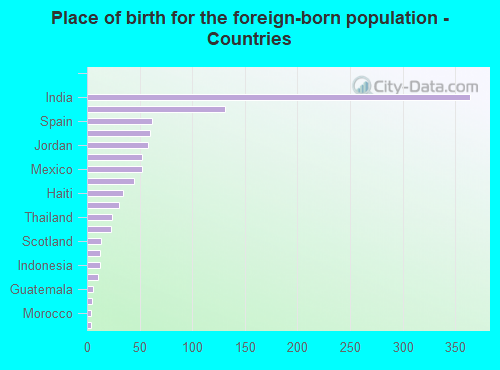
Place of birth for the foreign-born population - Ireland (%)
Place of birth for the foreign-born population - Denmark (%)
Place of birth for the foreign-born population - Norway (%)
Place of birth for the foreign-born population - Sweden (%)
Place of birth for the foreign-born population - United Kingdom (%)
Place of birth for the foreign-born population - England (%)
Place of birth for the foreign-born population - Scotland (%)
Place of birth for the foreign-born population - Other Northern Europe (%)
Place of birth for the foreign-born population - Austria (%)
Place of birth for the foreign-born population - Belgium (%)
Place of birth for the foreign-born population - France (%)
Place of birth for the foreign-born population - Germany (%)
Place of birth for the foreign-born population - Netherlands (%)
Place of birth for the foreign-born population - Switzerland (%)
Place of birth for the foreign-born population - Other Western Europe (%)
Place of birth for the foreign-born population - Greece (%)
Place of birth for the foreign-born population - Italy (%)
Place of birth for the foreign-born population - Portugal (%)
Place of birth for the foreign-born population - Spain (%)
Place of birth for the foreign-born population - Other Southern Europe (%)
Place of birth for the foreign-born population - Albania (%)
Place of birth for the foreign-born population - Belarus (%)
Place of birth for the foreign-born population - Bosnia and Herzegovina (%)
Place of birth for the foreign-born population - Bulgaria (%)
Place of birth for the foreign-born population - Croatia (%)
Place of birth for the foreign-born population - Czechoslovakia (%)
Place of birth for the foreign-born population - Hungary (%)
Place of birth for the foreign-born population - Latvia (%)
Place of birth for the foreign-born population - Lithuania (%)
Place of birth for the foreign-born population - North Macedonia (Macedonia) (%)
Place of birth for the foreign-born population - Moldova (%)
Place of birth for the foreign-born population - Poland (%)
Place of birth for the foreign-born population - Romania (%)
Place of birth for the foreign-born population - Russia (%)
Place of birth for the foreign-born population - Serbia (%)
Place of birth for the foreign-born population - Ukraine (%)
Place of birth for the foreign-born population - Other Eastern Europe (%)
Place of birth for the foreign-born population - China (%)
Place of birth for the foreign-born population - Hong Kong (%)
Place of birth for the foreign-born population - Taiwan (%)
Place of birth for the foreign-born population - Japan (%)
Place of birth for the foreign-born population - Korea (%)
Place of birth for the foreign-born population - Other Eastern Asia (%)
Place of birth for the foreign-born population - Afghanistan (%)
Place of birth for the foreign-born population - Bangladesh (%)
Place of birth for the foreign-born population - India (%)
Place of birth for the foreign-born population - Iran (%)
Place of birth for the foreign-born population - Kazakhstan (%)
Place of birth for the foreign-born population - Nepal (%)
Place of birth for the foreign-born population - Pakistan (%)
Place of birth for the foreign-born population - Sri Lanka (%)
Place of birth for the foreign-born population - Uzbekistan (%)
Place of birth for the foreign-born population - Other South Central Asia (%)
Place of birth for the foreign-born population - Burma (%)
Place of birth for the foreign-born population - Cambodia (%)
Place of birth for the foreign-born population - Indonesia (%)
Place of birth for the foreign-born population - Laos (%)
Place of birth for the foreign-born population - Malaysia (%)
Place of birth for the foreign-born population - Philippines (%)
Place of birth for the foreign-born population - Singapore (%)
Place of birth for the foreign-born population - Thailand (%)
Place of birth for the foreign-born population - Vietnam (%)
Place of birth for the foreign-born population - Other South Eastern Asia (%)
Place of birth for the foreign-born population - Armenia (%)
Place of birth for the foreign-born population - Iraq (%)
Place of birth for the foreign-born population - Israel (%)
Place of birth for the foreign-born population - Jordan (%)
Place of birth for the foreign-born population - Kuwait (%)
Place of birth for the foreign-born population - Lebanon (%)
Place of birth for the foreign-born population - Saudi Arabia (%)
Place of birth for the foreign-born population - Syria (%)
Place of birth for the foreign-born population - Turkey (%)
Place of birth for the foreign-born population - Yemen (%)
Place of birth for the foreign-born population - Other Western Asia (%)
Place of birth for the foreign-born population - Eritrea (%)
Place of birth for the foreign-born population - Ethiopia (%)
Place of birth for the foreign-born population - Kenya (%)
Place of birth for the foreign-born population - Somalia (%)
Place of birth for the foreign-born population - Uganda (%)
Place of birth for the foreign-born population - Zimbabwe (%)
Place of birth for the foreign-born population - Other Eastern Africa (%)
Place of birth for the foreign-born population - Cameroon (%)
Place of birth for the foreign-born population - Congo (%)
Place of birth for the foreign-born population - Democratic Republic of Congo (Zaire) (%)
Place of birth for the foreign-born population - Other Middle Africa (%)
Place of birth for the foreign-born population - Egypt (%)
Place of birth for the foreign-born population - Morocco (%)
Place of birth for the foreign-born population - Sudan (%)
Place of birth for the foreign-born population - Other Northern Africa (%)
Place of birth for the foreign-born population - South Africa (%)
Place of birth for the foreign-born population - Other Southern Africa (%)
Place of birth for the foreign-born population - Cabo Verde (%)
Place of birth for the foreign-born population - Ghana (%)
Place of birth for the foreign-born population - Liberia (%)
Place of birth for the foreign-born population - Nigeria (%)
Place of birth for the foreign-born population - Senegal (%)
Place of birth for the foreign-born population - Sierra Leone (%)
Place of birth for the foreign-born population - Other Western Africa (%)
Place of birth for the foreign-born population - Australia (%)
Place of birth for the foreign-born population - New Zealand (%)
Place of birth for the foreign-born population - Fiji (%)
Place of birth for the foreign-born population - Micronesia (%)
Place of birth for the foreign-born population - Bahamas (%)
Place of birth for the foreign-born population - Barbados (%)
Place of birth for the foreign-born population - Cuba (%)
Place of birth for the foreign-born population - Dominica (%)
Place of birth for the foreign-born population - Dominican Republic (%)
Place of birth for the foreign-born population - Grenada (%)
Place of birth for the foreign-born population - Haiti (%)
Place of birth for the foreign-born population - Jamaica (%)
Place of birth for the foreign-born population - St. Vincent and the Grenadines (%)
Place of birth for the foreign-born population - Trinidad and Tobago (%)
Place of birth for the foreign-born population - West Indies (%)
Place of birth for the foreign-born population - Other Caribbean (%)
Place of birth for the foreign-born population - Belize (%)
Place of birth for the foreign-born population - Costa Rica (%)
Place of birth for the foreign-born population - El Salvador (%)
Place of birth for the foreign-born population - Guatemala (%)
Place of birth for the foreign-born population - Honduras (%)
Place of birth for the foreign-born population - Mexico (%)
Place of birth for the foreign-born population - Nicaragua (%)
Place of birth for the foreign-born population - Panama (%)
Place of birth for the foreign-born population - Other Central America (%)
Place of birth for the foreign-born population - Argentina (%)
Place of birth for the foreign-born population - Bolivia (%)
Place of birth for the foreign-born population - Brazil (%)
Place of birth for the foreign-born population - Chile (%)
Place of birth for the foreign-born population - Colombia (%)
Place of birth for the foreign-born population - Ecuador (%)
Place of birth for the foreign-born population - Guyana (%)
Place of birth for the foreign-born population - Peru (%)
Place of birth for the foreign-born population - Uruguay (%)
Place of birth for the foreign-born population - Venezuela (%)
Place of birth for the foreign-born population - Other South America (%)
Place of birth for the foreign-born population - Canada (%)
Place of birth for the foreign-born population - Other Northern America (%)
Place of birth for the foreign-born population - Other (%)
Latest news about races in Downingtown, PA collected exclusively by city-data.com from local newspapers, TV, and radio stations
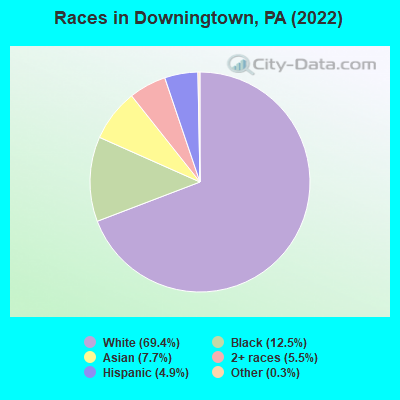
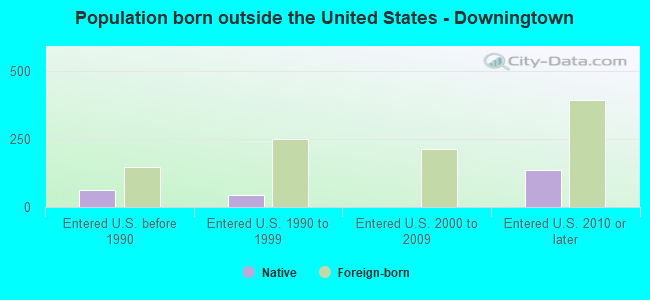
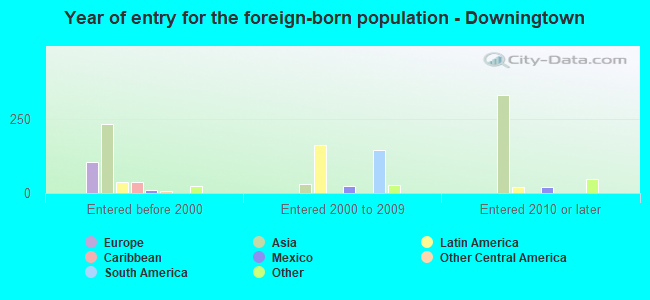
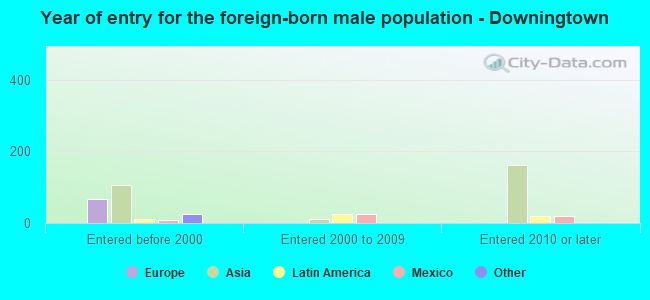
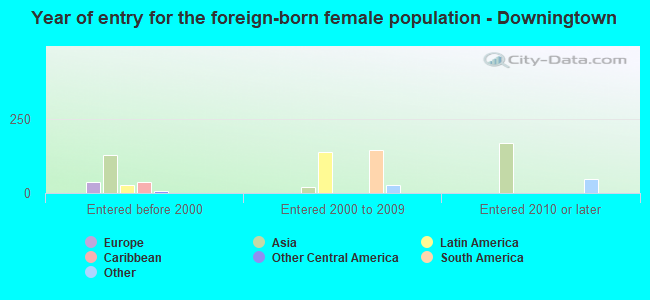
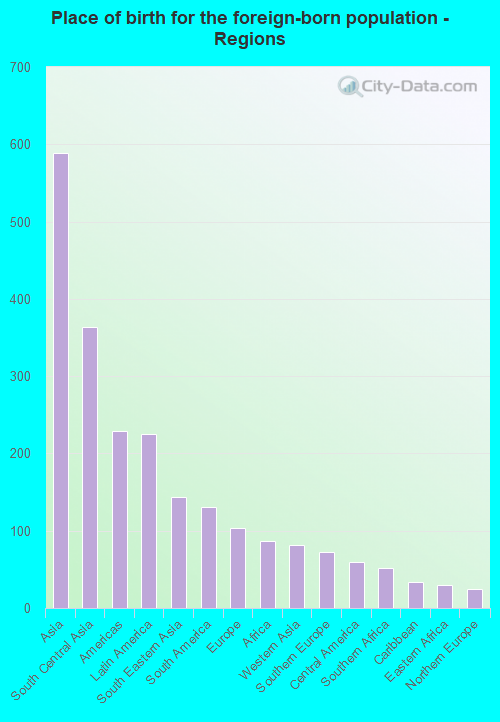
According to 2022 data, the most numerous races in Downingtown, PA are White alone (5,708 residents), Black alone (1,031 residents), and Hispanic (400 residents). 84.4% of Downingtown residents speak English at home. 12.3% of Downingtown, PA residents are foreign-born (7.0% born in Asia, 2.7% born in Latin America), which is 43.0% greater than the foreign-born rate of 7.0% across the entire state of Pennsylvania.
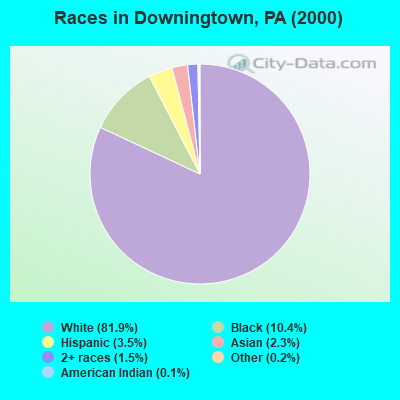
Race distribution in Downingtown
2000 2022
10,322,455 84.1% White alone 1,202,437 9.8% Black alone 394,088 3.2% Hispanic 218,296 1.8% Asian alone 113,097 0.9% Two or more races 13,086 0.1% Other race alone 14,904 0.1% American Indian alone 2,691 0.02% Native Hawaiian and Other
9,487,228 73.1% White alone 1,311,581 10.1% Black alone 1,115,997 8.6% Hispanic 493,942 3.8% Two or more races 487,124 3.8% Asian alone 63,582 0.5% Other race alone 10,130 0.08% American Indian alone 2,424 0.02% Native Hawaiian and Other
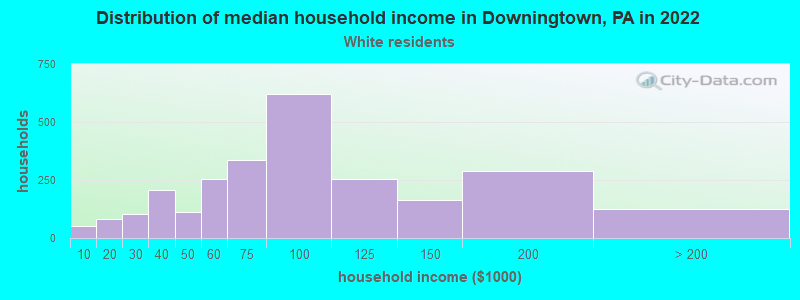
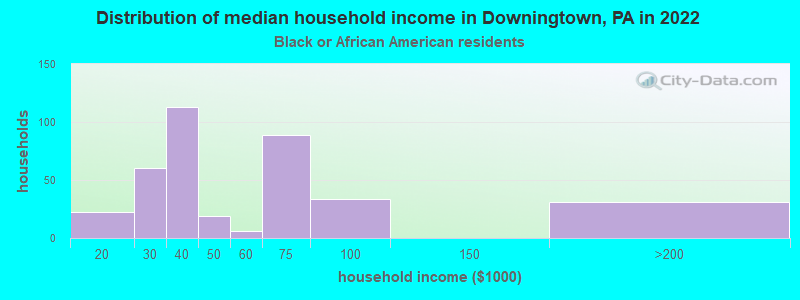
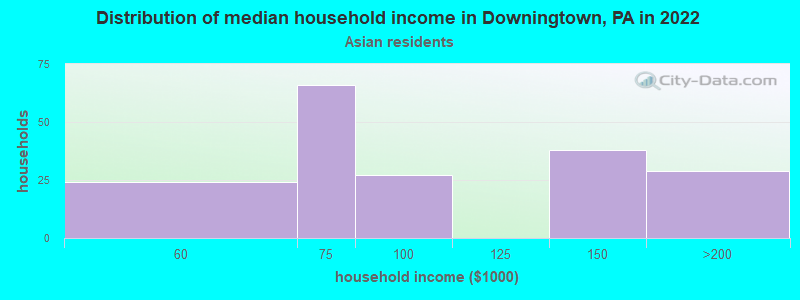
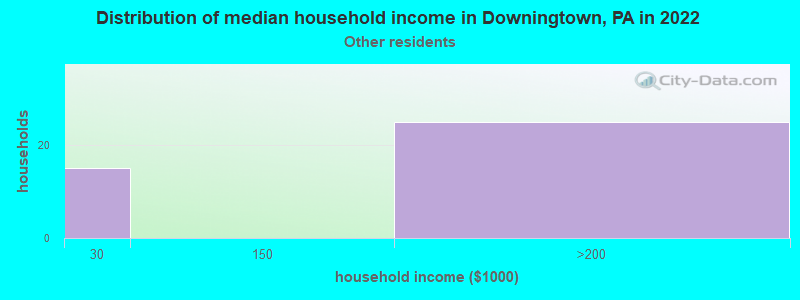
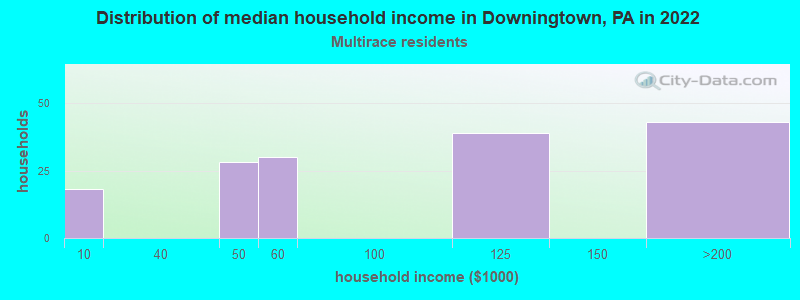
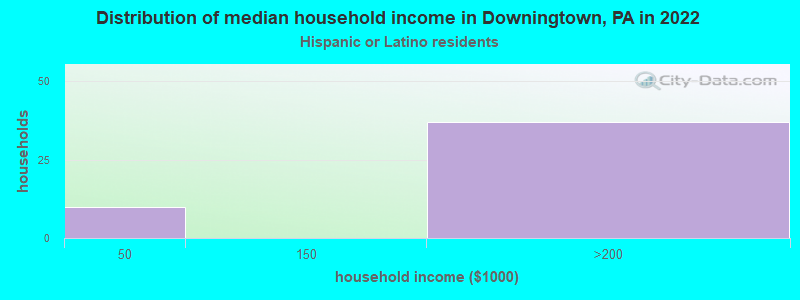
Income and house value in Downingtown Median household income in 2022 $83,988 White non-Hispanic householders$62,907 Black householders$93,209 Asian householders$180,361 Hispanic or Latino race householdersMedian 2022 house value $313,500 White Non-Hispanic householders$279,166 Black or African American householders$363,153 American Indian or Alaska Native householders $429,181 Asian householders$219,740 Two or more races householders$250,906 Hispanic or Latino householders
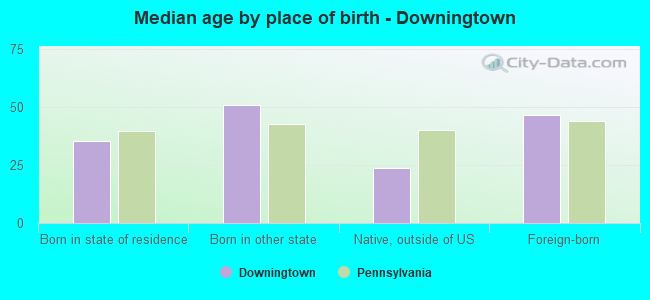
Median age by race in Downingtown
42.2 Median age for White residents43.1 40.9 39.4 Median age for Black or African American residents29.9 45.9 -591,549,295.2 Median age for American Indian / Alaska Native residents-596,491,227.5 -593,055,555.0 44.1 Median age for Asian residents38.9 45.5 -596,045,197.1 Median age for Native Hawaiian / Pacific Islander residents-665,394,401.4 -747,474,746.7 27.3 Median age for Other race residents24.6 -717,439,292.9 26.9 Median age for Two or more races residents27.5 8.7 40.8 Median age for White alone residents42.6 38.2 45.2 Median age for Hispanic or Latino residents42.6 46.0
Owner/renter occupied households by race in Downingtown
House owners and renters - White residents 1,491 58.9% Owner occupied1,040 41.1% Renter occupiedHouse owners and renters - Black or African American residents 149 35.5% Owner occupied270 64.5% Renter occupiedHouse owners and renters - Asian residents 75 44.6% Owner occupied94 55.4% Renter occupiedHouse owners and renters - Other race residents 23 69.4% Owner occupied10 30.6% Renter occupiedHouse owners and renters - Two or more races residents 162 69.3% Owner occupied72 30.7% Renter occupiedHouse owners and renters - White alone residents 1,493 58.6% Owner occupied1,056 41.4% Renter occupiedHouse owners and renters - Hispanic or Latino residents 101 88.2% Owner occupied14 11.8% Renter occupied
Language usage in Downingtown
English speakers - Total 84.4% of residents of Downingtown speak English at home.
1.5% of residents speak Spanish at home 117 100.0% Speak English very well15.1% of residents speak other language at home 798 67.7% Speak English very well380 32.3% Speak English less than very well
English speakers - Born in the United States 96.1% of residents of Downingtown speak English at home.
1.7% of residents speak Spanish at home 21 100.0% Speak English very well0.9% of residents speak other language at home 11 100.0% Speak English less than very well
English speakers - Native, born elsewhere 42.5% of residents of Downingtown speak English at home.
8.9% of residents speak Spanish at home 22 100.0% Speak English very well71.7% of residents speak other language at home 112 63.3% Speak English very well65 36.7% Speak English less than very well
English speakers - Foreign-born 16.3% of residents of Downingtown speak English at home.
1.1% of residents speak Spanish at home 11 100.0% Speak English very well84.3% of residents speak other language at home 574 66.5% Speak English very well289 33.5% Speak English less than very well
White (Caucasian) - Speak only English Native:
96.5% (5,029)Foreign-born:
29.6% (76)
White (Caucasian) - Speak another language Native:
3.4% (180)Foreign-born:
68.4% (176)
Black or African American - Speak only English Native:
96.3% (900)Foreign-born:
98.1% (89)
Asian - Speak another language Native:
42.4% (48)Foreign-born:
95.4% (477)
Two or more races - Speak another language Native:
7.7% (33)Foreign-born:
100.0% (216)
White alone - Speak only English Native:
96.1% (5,038)Foreign-born:
39.3% (74)
White alone - Speak another language Native:
4.0% (212)Foreign-born:
62.1% (116)
Hispanic or Latino - Speak only English Native:
42.3% (64)Foreign-born:
3.8% (9)
Hispanic or Latino - Speak another language Native:
54.5% (83)Foreign-born:
93.7% (223)
Foreign-born residents in Downingtown 1,010 residents are foreign born (7.0% Asia , 2.7% Latin America ).
This city:
12.3%Pennsylvania:
7.3%
Marital status for residents in Downingtown Marital status - White (Caucasian) population 15 years and over
Males 30.6% Never married52.7% Now married3.0% Separated2.1% Widowed11.6% DivorcedFemales 28.5% Never married47.1% Now married1.9% Separated5.6% Widowed16.8% DivorcedWomen who gave birth in the past 12 months Now married:
95.8% (90)Unmarried:
4.2% (4)
Women who did not give birth in the past 12 months Now married:
48.7% (737)Unmarried:
51.3% (778)
Marital status - Black or African American population 15 years and over
Males 56.2% Never married10.7% Now married0.0% Separated5.6% Widowed27.5% DivorcedFemales 60.8% Never married7.6% Now married16.7% Separated4.8% Widowed10.1% DivorcedWomen who did not give birth in the past 12 months Now married:
0.0% (0)Unmarried:
100.0% (203)
Marital status - Asian population 15 years and over
Males 42.8% Never married57.2% Now married0.0% Separated0.0% Widowed0.0% DivorcedFemales 25.5% Never married44.1% Now married0.0% Separated0.0% Widowed30.4% DivorcedWomen who did not give birth in the past 12 months Now married:
37.1% (98)Unmarried:
62.9% (167)
Marital status - Other race population 15 years and over
Males 62.2% Never married21.6% Now married0.0% Separated0.0% Widowed16.2% DivorcedFemales 0.0% Never married100.0% Now married0.0% Separated0.0% Widowed0.0% DivorcedWomen who did not give birth in the past 12 months Now married:
100.0% (19)Unmarried:
0.0% (0)
Marital status - Two or more races population 15 years and over
Males 64.9% Never married35.1% Now married0.0% Separated0.0% Widowed0.0% DivorcedFemales 79.2% Never married6.9% Now married0.0% Separated0.0% Widowed13.8% DivorcedWomen who did not give birth in the past 12 months Now married:
6.9% (13)Unmarried:
93.1% (175)
Marital status - White alone, not Hispanic / Latino population 15 years and over
Males 30.6% Never married52.7% Now married3.0% Separated2.1% Widowed11.6% DivorcedFemales 29.9% Never married44.5% Now married2.0% Separated5.8% Widowed17.7% DivorcedWomen who gave birth in the past 12 months Now married:
95.8% (91)Unmarried:
4.2% (4)
Women who did not give birth in the past 12 months Now married:
44.0% (617)Unmarried:
56.0% (785)
Marital status - Hispanic or Latino population 15 years and over
Males 56.9% Never married43.1% Now married0.0% Separated0.0% Widowed0.0% DivorcedFemales 4.1% Never married95.9% Now married0.0% Separated0.0% Widowed0.0% DivorcedWomen who did not give birth in the past 12 months Now married:
95.9% (143)Unmarried:
4.1% (6)
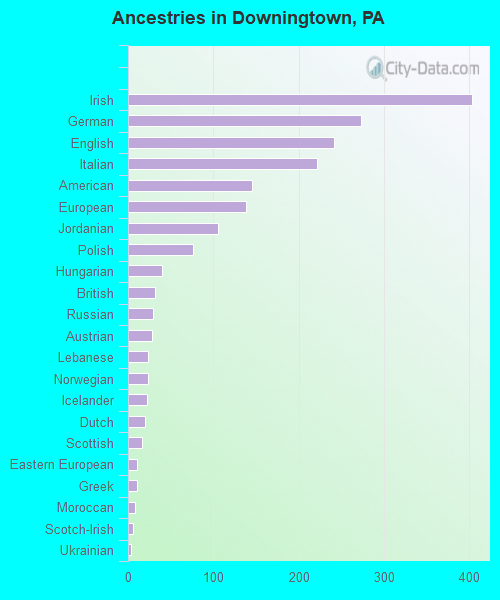
Ancestries in Downingtown
403 11.2% Irish273 7.6% German242 6.7% English222 6.2% Italian145 4.0% American138 3.8% European106 2.9% Jordanian76 2.1% Polish40 1.1% Hungarian32 0.9% British29 0.8% Russian28 0.8% Austrian23 0.6% Lebanese23 0.6% Norwegian22 0.6% Icelander20 0.6% Dutch16 0.4% Scottish11 0.3% Eastern European10 0.3% Greek8 0.2% Moroccan6 0.2% Scotch-Irish4 0.1% Ukrainian1 0.03% Pennsylvania German
Children Nativity (place of birth) in Downingtown
Children under 6 years - Living with two parents Both parents native 410 100.0% NativeBoth parents foreign-born 15 100.0% NativeOne native, one foreign-born parent 16 100.0% NativeChildren under 6 years - Living with one parent Native parent 69 100.0% NativeChildren 6 to 17 years - Living with two parents Both parents native 298 98.5% Native5 1.5% Foreign-bornBoth parents foreign-born 154 67.5% Native74 32.5% Foreign-bornOne native, one foreign-born parent 38 100.0% NativeChildren 6 to 17 years - Living with one parent Native parent 381 95.7% Native17 4.3% Foreign-bornForeign-born parent 28 100.0% Native
Grandparents responsible for own grandchildren in Downingtown
Grandparents (30 to 59 years) White / Caucasian 22 100.0% Not responsible for grandchildrenBlack or African American 25 100.0% Responsible for grandchildrenOther race 14 36.5% Responsible for grandchildren24 63.5% Not responsible for grandchildrenWhite alone, not Hispanic / Latino 27 100.0% Not responsible for grandchildrenHispanic or Latino 11 37.7% Responsible for grandchildren18 62.3% Not responsible for grandchildrenGrandparents (60 years and over) White / Caucasian 3 17.2% Responsible for grandchildren12 82.8% Not responsible for grandchildrenWhite alone, not Hispanic / Latino 3 17.2% Responsible for grandchildren13 82.8% Not responsible for grandchildren