Races in Dover, New Jersey (NJ) Detailed Stats
Data:
Races - White alone (%)
Races - White alone (% change since 2000)
Races - Black alone (%)
Races - Black alone (% change since 2000)
Races - American Indian alone (%)
Races - American Indian alone (% change since 2000)
Races - Asian alone (%)
Races - Asian alone (% change since 2000)
Races - Hispanic (%)
Races - Hispanic (% change since 2000)
Races - Native Hawaiian and Other Pacific Islander alone (%)
Races - Native Hawaiian and Other Pacific Islander alone (% change since 2000)
Races - Two or more races(%)
Races - Two or more races(% change since 2000)
Races - Other race alone (%)
Races - Other race alone (% change since 2000)
Racial diversity
Place of birth - Born in state of residence (%)
Place of birth - Born in state of residence (%) - White
Place of birth - Born in state of residence (%) - Black or African American
Place of birth - Born in state of residence (%) - Asian
Place of birth - Born in state of residence (%) - Hispanic or Latino
Place of birth - Born in state of residence (%) - American Indian and Alaska Native
Place of birth - Born in state of residence (%) - Multirace
Place of birth - Born in state of residence (%) - Other Race
Place of birth - Born in other state (%)
Place of birth - Born in other state (%) - White
Place of birth - Born in other state (%) - Black or African American
Place of birth - Born in other state (%) - Asian
Place of birth - Born in other state (%) - Hispanic or Latino
Place of birth - Born in other state (%) - American Indian and Alaska Native
Place of birth - Born in other state (%) - Multirace
Place of birth - Born in other state (%) - Other Race
Place of birth - Native, outside of US (%)
Place of birth - Native, outside of US (%) - White
Place of birth - Native, outside of US (%) - Black or African American
Place of birth - Native, outside of US (%) - Asian
Place of birth - Native, outside of US (%) - Hispanic or Latino
Place of birth - Native, outside of US (%) - American Indian and Alaska Native
Place of birth - Native, outside of US (%) - Multirace
Place of birth - Native, outside of US (%) - Other Race
Place of birth - Foreign born (%)
Place of birth - Foreign born (%) - White
Place of birth - Foreign born (%) - Black or African American
Place of birth - Foreign born (%) - Asian
Place of birth - Foreign born (%) - Hispanic or Latino
Place of birth - Foreign born (%) - American Indian and Alaska Native
Place of birth - Foreign born (%) - Multirace
Place of birth - Foreign born (%) - Other Race
Residents speaking English at home (%)
Residents speaking English at home - Born in the United States (%)
Residents speaking English at home - Native, born elsewhere (%)
Residents speaking English at home - Foreign born (%)
Residents speaking Spanish at home (%)
Residents speaking Spanish at home - Born in the United States (%)
Residents speaking Spanish at home - Native, born elsewhere (%)
Residents speaking Spanish at home - Foreign born (%)
Residents speaking other language at home (%)
Residents speaking other language at home - Born in the United States (%)
Residents speaking other language at home - Native, born elsewhere (%)
Residents speaking other language at home - Foreign born (%)
Marital status - Never married (%)
Marital status - Now married (%)
Marital status - Separated (%)
Marital status - Widowed (%)
Marital status - Divorced (%)
Ancestries Reported - Arab (%)
Ancestries Reported - Czech (%)
Ancestries Reported - Danish (%)
Ancestries Reported - Dutch (%)
Ancestries Reported - English (%)
Ancestries Reported - French (%)
Ancestries Reported - French Canadian (%)
Ancestries Reported - German (%)
Ancestries Reported - Greek (%)
Ancestries Reported - Hungarian (%)
Ancestries Reported - Irish (%)
Ancestries Reported - Italian (%)
Ancestries Reported - Lithuanian (%)
Ancestries Reported - Norwegian (%)
Ancestries Reported - Polish (%)
Ancestries Reported - Portuguese (%)
Ancestries Reported - Russian (%)
Ancestries Reported - Scotch-Irish (%)
Ancestries Reported - Scottish (%)
Ancestries Reported - Slovak (%)
Ancestries Reported - Subsaharan African (%)
Ancestries Reported - Swedish (%)
Ancestries Reported - Swiss (%)
Ancestries Reported - Ukrainian (%)
Ancestries Reported - United States (%)
Ancestries Reported - Welsh (%)
Ancestries Reported - West Indian (%)
Ancestries Reported - Other (%)
Geographical mobility - Same house 1 year ago (%)
Geographical mobility - Same house 1 year ago (%) - White
Geographical mobility - Same house 1 year ago (%) - Black or African American
Geographical mobility - Same house 1 year ago (%) - Asian
Geographical mobility - Same house 1 year ago (%) - Hispanic or Latino
Geographical mobility - Same house 1 year ago (%) - American Indian and Alaska Native
Geographical mobility - Same house 1 year ago (%) - Multirace
Geographical mobility - Same house 1 year ago (%) - Other Race
Geographical mobility - Moved within same county (%)
Geographical mobility - Moved within same county (%) - White
Geographical mobility - Moved within same county (%) - Black or African American
Geographical mobility - Moved within same county (%) - Asian
Geographical mobility - Moved within same county (%) - Hispanic or Latino
Geographical mobility - Moved within same county (%) - American Indian and Alaska Native
Geographical mobility - Moved within same county (%) - Multirace
Geographical mobility - Moved within same county (%) - Other Race
Geographical mobility - Moved from different county within same state (%)
Geographical mobility - Moved from different county within same state (%) - White
Geographical mobility - Moved from different county within same state (%) - Black or African American
Geographical mobility - Moved from different county within same state (%) - Asian
Geographical mobility - Moved from different county within same state (%) - Hispanic or Latino
Geographical mobility - Moved from different county within same state (%) - American Indian and Alaska Native
Geographical mobility - Moved from different county within same state (%) - Multirace
Geographical mobility - Moved from different county within same state (%) - Other Race
Geographical mobility - Moved from different state (%)
Geographical mobility - Moved from different state (%) - White
Geographical mobility - Moved from different state (%) - Black or African American
Geographical mobility - Moved from different state (%) - Asian
Geographical mobility - Moved from different state (%) - Hispanic or Latino
Geographical mobility - Moved from different state (%) - American Indian and Alaska Native
Geographical mobility - Moved from different state (%) - Multirace
Geographical mobility - Moved from different state (%) - Other Race
Geographical mobility - Moved from abroad (%)
Geographical mobility - Moved from abroad (%) - White
Geographical mobility - Moved from abroad (%) - Black or African American
Geographical mobility - Moved from abroad (%) - Asian
Geographical mobility - Moved from abroad (%) - Hispanic or Latino
Geographical mobility - Moved from abroad (%) - American Indian and Alaska Native
Geographical mobility - Moved from abroad (%) - Multirace
Geographical mobility - Moved from abroad (%) - Other Race
Place of birth for the foreign-born population - Ireland (%)
Place of birth for the foreign-born population - Denmark (%)
Place of birth for the foreign-born population - Norway (%)
Place of birth for the foreign-born population - Sweden (%)
Place of birth for the foreign-born population - United Kingdom (%)
Place of birth for the foreign-born population - England (%)
Place of birth for the foreign-born population - Scotland (%)
Place of birth for the foreign-born population - Other Northern Europe (%)
Place of birth for the foreign-born population - Austria (%)
Place of birth for the foreign-born population - Belgium (%)
Place of birth for the foreign-born population - France (%)
Place of birth for the foreign-born population - Germany (%)
Place of birth for the foreign-born population - Netherlands (%)
Place of birth for the foreign-born population - Switzerland (%)
Place of birth for the foreign-born population - Other Western Europe (%)
Place of birth for the foreign-born population - Greece (%)
Place of birth for the foreign-born population - Italy (%)
Place of birth for the foreign-born population - Portugal (%)
Place of birth for the foreign-born population - Spain (%)
Place of birth for the foreign-born population - Other Southern Europe (%)
Place of birth for the foreign-born population - Albania (%)
Place of birth for the foreign-born population - Belarus (%)
Place of birth for the foreign-born population - Bosnia and Herzegovina (%)
Place of birth for the foreign-born population - Bulgaria (%)
Place of birth for the foreign-born population - Croatia (%)
Place of birth for the foreign-born population - Czechoslovakia (%)
Place of birth for the foreign-born population - Hungary (%)
Place of birth for the foreign-born population - Latvia (%)
Place of birth for the foreign-born population - Lithuania (%)
Place of birth for the foreign-born population - North Macedonia (Macedonia) (%)
Place of birth for the foreign-born population - Moldova (%)
Place of birth for the foreign-born population - Poland (%)
Place of birth for the foreign-born population - Romania (%)
Place of birth for the foreign-born population - Russia (%)
Place of birth for the foreign-born population - Serbia (%)
Place of birth for the foreign-born population - Ukraine (%)
Place of birth for the foreign-born population - Other Eastern Europe (%)
Place of birth for the foreign-born population - China (%)
Place of birth for the foreign-born population - Hong Kong (%)
Place of birth for the foreign-born population - Taiwan (%)
Place of birth for the foreign-born population - Japan (%)
Place of birth for the foreign-born population - Korea (%)
Place of birth for the foreign-born population - Other Eastern Asia (%)
Place of birth for the foreign-born population - Afghanistan (%)
Place of birth for the foreign-born population - Bangladesh (%)
Place of birth for the foreign-born population - India (%)
Place of birth for the foreign-born population - Iran (%)
Place of birth for the foreign-born population - Kazakhstan (%)
Place of birth for the foreign-born population - Nepal (%)
Place of birth for the foreign-born population - Pakistan (%)
Place of birth for the foreign-born population - Sri Lanka (%)
Place of birth for the foreign-born population - Uzbekistan (%)
Place of birth for the foreign-born population - Other South Central Asia (%)
Place of birth for the foreign-born population - Burma (%)
Place of birth for the foreign-born population - Cambodia (%)
Place of birth for the foreign-born population - Indonesia (%)
Place of birth for the foreign-born population - Laos (%)
Place of birth for the foreign-born population - Malaysia (%)
Place of birth for the foreign-born population - Philippines (%)
Place of birth for the foreign-born population - Singapore (%)
Place of birth for the foreign-born population - Thailand (%)
Place of birth for the foreign-born population - Vietnam (%)
Place of birth for the foreign-born population - Other South Eastern Asia (%)
Place of birth for the foreign-born population - Armenia (%)
Place of birth for the foreign-born population - Iraq (%)
Place of birth for the foreign-born population - Israel (%)
Place of birth for the foreign-born population - Jordan (%)
Place of birth for the foreign-born population - Kuwait (%)
Place of birth for the foreign-born population - Lebanon (%)
Place of birth for the foreign-born population - Saudi Arabia (%)
Place of birth for the foreign-born population - Syria (%)
Place of birth for the foreign-born population - Turkey (%)
Place of birth for the foreign-born population - Yemen (%)
Place of birth for the foreign-born population - Other Western Asia (%)
Place of birth for the foreign-born population - Eritrea (%)
Place of birth for the foreign-born population - Ethiopia (%)
Place of birth for the foreign-born population - Kenya (%)
Place of birth for the foreign-born population - Somalia (%)
Place of birth for the foreign-born population - Uganda (%)
Place of birth for the foreign-born population - Zimbabwe (%)
Place of birth for the foreign-born population - Other Eastern Africa (%)
Place of birth for the foreign-born population - Cameroon (%)
Place of birth for the foreign-born population - Congo (%)
Place of birth for the foreign-born population - Democratic Republic of Congo (Zaire) (%)
Place of birth for the foreign-born population - Other Middle Africa (%)
Place of birth for the foreign-born population - Egypt (%)
Place of birth for the foreign-born population - Morocco (%)
Place of birth for the foreign-born population - Sudan (%)
Place of birth for the foreign-born population - Other Northern Africa (%)
Place of birth for the foreign-born population - South Africa (%)
Place of birth for the foreign-born population - Other Southern Africa (%)
Place of birth for the foreign-born population - Cabo Verde (%)
Place of birth for the foreign-born population - Ghana (%)
Place of birth for the foreign-born population - Liberia (%)
Place of birth for the foreign-born population - Nigeria (%)
Place of birth for the foreign-born population - Senegal (%)
Place of birth for the foreign-born population - Sierra Leone (%)
Place of birth for the foreign-born population - Other Western Africa (%)
Place of birth for the foreign-born population - Australia (%)
Place of birth for the foreign-born population - New Zealand (%)
Place of birth for the foreign-born population - Fiji (%)
Place of birth for the foreign-born population - Micronesia (%)
Place of birth for the foreign-born population - Bahamas (%)
Place of birth for the foreign-born population - Barbados (%)
Place of birth for the foreign-born population - Cuba (%)
Place of birth for the foreign-born population - Dominica (%)
Place of birth for the foreign-born population - Dominican Republic (%)
Place of birth for the foreign-born population - Grenada (%)
Place of birth for the foreign-born population - Haiti (%)
Place of birth for the foreign-born population - Jamaica (%)
Place of birth for the foreign-born population - St. Vincent and the Grenadines (%)
Place of birth for the foreign-born population - Trinidad and Tobago (%)
Place of birth for the foreign-born population - West Indies (%)
Place of birth for the foreign-born population - Other Caribbean (%)
Place of birth for the foreign-born population - Belize (%)
Place of birth for the foreign-born population - Costa Rica (%)
Place of birth for the foreign-born population - El Salvador (%)
Place of birth for the foreign-born population - Guatemala (%)
Place of birth for the foreign-born population - Honduras (%)
Place of birth for the foreign-born population - Mexico (%)
Place of birth for the foreign-born population - Nicaragua (%)
Place of birth for the foreign-born population - Panama (%)
Place of birth for the foreign-born population - Other Central America (%)
Place of birth for the foreign-born population - Argentina (%)
Place of birth for the foreign-born population - Bolivia (%)
Place of birth for the foreign-born population - Brazil (%)
Place of birth for the foreign-born population - Chile (%)
Place of birth for the foreign-born population - Colombia (%)
Place of birth for the foreign-born population - Ecuador (%)
Place of birth for the foreign-born population - Guyana (%)
Place of birth for the foreign-born population - Peru (%)
Place of birth for the foreign-born population - Uruguay (%)
Place of birth for the foreign-born population - Venezuela (%)
Place of birth for the foreign-born population - Other South America (%)
Place of birth for the foreign-born population - Canada (%)
Place of birth for the foreign-born population - Other Northern America (%)
Place of birth for the foreign-born population - Other (%)
Latest news about races in Dover, NJ collected exclusively by city-data.com from local newspapers, TV, and radio stations
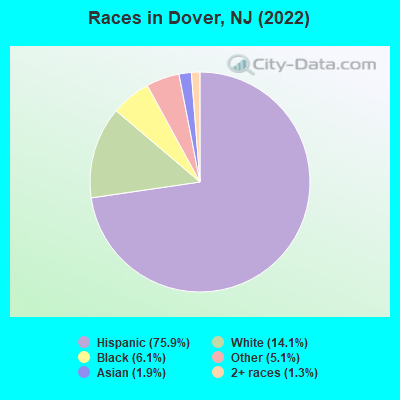
According to 2022 data, the most numerous races in Dover, NJ are White alone (2,614 residents), Hispanic (14,049 residents), and Black alone (1,138 residents). 22.4% of Dover residents speak English at home. 50.7% of Dover, NJ residents are foreign-born (46.9% born in Latin America), which is 54.6% greater than the foreign-born rate of 23.0% across the entire state of New Jersey.
Race distribution in Dover
2000 2022
5,557,209 66.0% White alone 1,117,191 13.3% Hispanic 1,096,171 13.0% Black alone 477,012 5.7% Asian alone 133,689 1.6% Two or more races 19,565 0.2% Other race alone 11,338 0.1% American Indian alone 2,175 0.03% Native Hawaiian and Other
4,766,476 51.5% White alone 2,028,470 21.9% Hispanic 1,111,632 12.0% Black alone 923,546 10.0% Asian alone 332,237 3.6% Two or more races 89,847 1.0% Other race alone 8,557 0.09% American Indian alone 934 0.01% Native Hawaiian and Other
Income and house value in Dover Median household income in 2022 $72,767 White non-Hispanic householders$92,512 Black householders$103,278 Asian householders$47,126 Some other race householders$87,929 Two or more races householders$69,055 Hispanic or Latino race householdersMedian 2022 house value $312,459 White Non-Hispanic householders$334,915 Black or African American householders $354,163 Asian householders$326,788 Some other race householders$303,904 Two or more races householders$343,898 Hispanic or Latino householders
Median age by race in Dover
45.2 Median age for White residents46.0 41.7 38.6 Median age for Black or African American residents41.0 29.2 -847,710,329.3 Median age for American Indian / Alaska Native residents-707,246,376.1 -671,264,367.1 59.4 Median age for Asian residents41.5 63.1 -804,177,544.9 Median age for Native Hawaiian / Pacific Islander residents-666,666,666.0 -713,070,378.3 35.6 Median age for Other race residents40.9 29.6 53.7 Median age for Two or more races residents41.4 57.2 51.4 Median age for White alone residents47.8 57.9 39.9 Median age for Hispanic or Latino residents40.0 39.6
Owner/renter occupied households by race in Dover
House owners and renters - White residents 1,221 52.1% Owner occupied1,123 47.9% Renter occupiedHouse owners and renters - Black or African American residents 260 51.5% Owner occupied245 48.5% Renter occupiedHouse owners and renters - American Indian / Alaska Native residents 81 100.0% Renter occupiedHouse owners and renters - Asian residents 64 68.0% Owner occupied30 32.0% Renter occupiedHouse owners and renters - Other race residents 932 35.2% Owner occupied1,718 64.8% Renter occupiedHouse owners and renters - Two or more races residents 921 49.9% Owner occupied924 50.1% Renter occupiedHouse owners and renters - White alone residents 849 73.2% Owner occupied311 26.8% Renter occupiedHouse owners and renters - Hispanic or Latino residents 1,810 40.3% Owner occupied2,676 59.7% Renter occupied
Language usage in Dover
English speakers - Total 22.4% of residents of Dover speak English at home.
71.1% of residents speak Spanish at home 5,860 46.4% Speak English very well6,756 53.6% Speak English less than very well4.2% of residents speak other language at home 424 57.1% Speak English very well318 42.9% Speak English less than very well
English speakers - Born in the United States 57.9% of residents of Dover speak English at home.
41.6% of residents speak Spanish at home 552 92.3% Speak English very well46 7.7% Speak English less than very well8.7% of residents speak other language at home 102 81.6% Speak English very well23 18.4% Speak English less than very well
English speakers - Native, born elsewhere 5.1% of residents of Dover speak English at home.
98.3% of residents speak Spanish at home 638 53.8% Speak English very well548 46.2% Speak English less than very well
English speakers - Foreign-born 8.0% of residents of Dover speak English at home.
87.2% of residents speak Spanish at home 1,990 25.4% Speak English very well5,854 74.6% Speak English less than very well5.9% of residents speak other language at home 236 44.7% Speak English very well292 55.3% Speak English less than very well
White (Caucasian) - Speak only English Native:
49.3% (1,762)Foreign-born:
7.3% (131)
White (Caucasian) - Speak another language Native:
41.4% (1,479)Foreign-born:
86.3% (1,541)
Black or African American - Speak only English Native:
74.8% (840)Foreign-born:
70.2% (242)
Black or African American - Speak another language Native:
24.3% (273)Foreign-born:
34.8% (120)
Asian - Speak only English Native:
32.4% (32)Foreign-born:
11.8% (30)
Asian - Speak another language Native:
66.1% (65)Foreign-born:
87.3% (223)
Other race - Speak only English Native:
15.4% (491)Foreign-born:
1.6% (82)
Other race - Speak another language Native:
87.3% (2,777)Foreign-born:
98.1% (5,090)
Two or more races - Speak only English Native:
17.1% (308)Foreign-born:
13.4% (406)
Two or more races - Speak another language Native:
86.3% (1,552)Foreign-born:
86.5% (2,628)
White alone - Speak only English Native:
67.8% (1,556)Foreign-born:
15.6% (37)
White alone - Speak another language Native:
32.9% (755)Foreign-born:
86.7% (205)
Hispanic or Latino - Speak only English Native:
15.5% (757)Foreign-born:
7.2% (621)
Hispanic or Latino - Speak another language Native:
81.7% (3,998)Foreign-born:
92.2% (7,969)
Foreign-born residents in Dover 9,382 residents are foreign born (46.9% Latin America ).
This city:
50.7%New Jersey:
23.2%
Marital status for residents in Dover Marital status - White (Caucasian) population 15 years and over
Males 29.2% Never married58.5% Now married3.2% Separated1.1% Widowed8.0% DivorcedFemales 30.0% Never married40.5% Now married3.4% Separated13.0% Widowed13.1% DivorcedWomen who did not give birth in the past 12 months Now married:
50.4% (708)Unmarried:
49.6% (695)
Marital status - Black or African American population 15 years and over
Males 57.5% Never married34.9% Now married3.7% Separated3.9% Widowed0.0% DivorcedFemales 52.6% Never married24.4% Now married5.4% Separated9.6% Widowed8.0% DivorcedWomen who did not give birth in the past 12 months Now married:
20.2% (65)Unmarried:
79.8% (256)
Marital status - Asian population 15 years and over
Males 52.8% Never married47.2% Now married0.0% Separated0.0% Widowed0.0% DivorcedFemales 10.9% Never married84.1% Now married0.0% Separated5.1% Widowed0.0% DivorcedWomen who did not give birth in the past 12 months Now married:
60.5% (25)Unmarried:
39.5% (16)
Marital status - Other race population 15 years and over
Males 41.9% Never married49.6% Now married2.0% Separated2.8% Widowed3.8% DivorcedFemales 34.2% Never married44.0% Now married2.8% Separated2.8% Widowed16.2% DivorcedWomen who gave birth in the past 12 months Now married:
100.0% (48)Unmarried:
0.0% (0)
Women who did not give birth in the past 12 months Now married:
42.0% (863)Unmarried:
58.0% (1,192)
Marital status - Two or more races population 15 years and over
Males 54.9% Never married35.1% Now married1.5% Separated0.0% Widowed8.5% DivorcedFemales 40.2% Never married34.3% Now married1.5% Separated8.9% Widowed15.1% DivorcedWomen who gave birth in the past 12 months Now married:
44.4% (17)Unmarried:
55.6% (21)
Women who did not give birth in the past 12 months Now married:
29.0% (325)Unmarried:
71.0% (794)
Marital status - White alone, not Hispanic / Latino population 15 years and over
Males 39.9% Never married44.6% Now married1.2% Separated2.7% Widowed11.7% DivorcedFemales 28.5% Never married26.9% Now married1.3% Separated23.7% Widowed19.6% DivorcedWomen who did not give birth in the past 12 months Now married:
37.5% (146)Unmarried:
62.5% (243)
Marital status - Hispanic or Latino population 15 years and over
Males 39.7% Never married51.0% Now married2.6% Separated1.4% Widowed5.4% DivorcedFemales 35.5% Never married43.2% Now married3.1% Separated5.2% Widowed12.9% DivorcedWomen who gave birth in the past 12 months Now married:
59.5% (23)Unmarried:
40.5% (16)
Women who did not give birth in the past 12 months Now married:
43.4% (1,626)Unmarried:
56.6% (2,118)
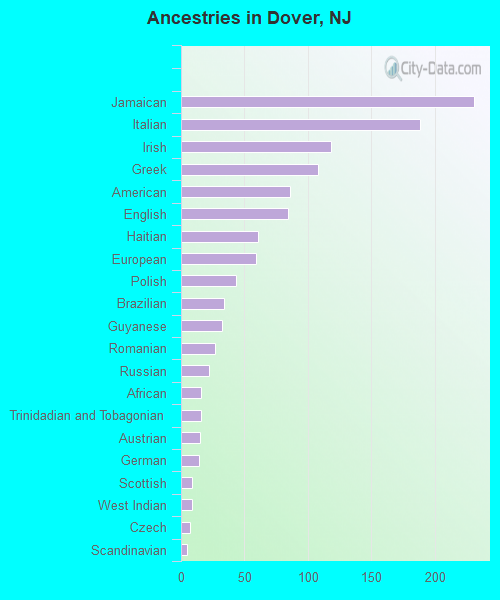
Ancestries in Dover
231 1.7% Jamaican188 1.4% Italian118 0.9% Irish108 0.8% Greek86 0.6% American84 0.6% English61 0.5% Haitian59 0.4% European43 0.3% Polish34 0.3% Brazilian32 0.2% Guyanese27 0.2% Romanian22 0.2% Russian16 0.1% African16 0.1% Trinidadian and Tobagonian15 0.1% Austrian14 0.1% German9 0.07% Scottish9 0.07% West Indian7 0.05% Czech5 0.04% Scandinavian
Geographical mobility in Dover Same house 1 year ago 4,898 81.0% White (Caucasian)1,620 98.2% Black or African American71 96.6% American Indian / Alaska Native332 92.7% Asian7,236 79.2% Other race4,424 96.5% Two or more races2,468 94.3% White alone, not Hispanic / Latino11,989 85.4% Hispanic or LatinoMoved within same county 873 14.4% White / Caucasian58 3.5% Black or African American18 4.9% Asian487 5.3% Other race317 6.9% Two or more races42 1.6% White alone, not Hispanic / Latino1,109 7.9% Hispanic or LatinoMoved within same state 81 1.3% White / Caucasian11 0.7% Black or African American60 0.7% Other race73 2.8% White alone, not Hispanic / Latino88 0.6% Hispanic or LatinoMoved from different state 29 0.5% White / Caucasian42 0.5% Other race30 1.2% White alone, not Hispanic / Latino67 0.5% Hispanic or LatinoMoved from abroad 42 0.7% White11 3.1% Asian476 5.2% Other race645 4.6% Hispanic or Latino
Children Nativity (place of birth) in Dover
Children under 6 years - Living with two parents Both parents native 90 100.0% NativeBoth parents foreign-born 155 83.1% Native32 16.9% Foreign-bornOne native, one foreign-born parent 235 100.0% NativeChildren under 6 years - Living with one parent Native parent 62 100.0% NativeForeign-born parent 178 100.0% NativeChildren 6 to 17 years - Living with two parents Both parents native 191 92.2% Native16 7.8% Foreign-bornBoth parents foreign-born 984 76.6% Native300 23.4% Foreign-bornOne native, one foreign-born parent 459 93.6% Native31 6.4% Foreign-bornChildren 6 to 17 years - Living with one parent Foreign-born parent 782 56.0% Native615 44.0% Foreign-born
Grandparents responsible for own grandchildren in Dover
Grandparents (30 to 59 years) Black or African American 22 100.0% Not responsible for grandchildrenOther race 84 100.0% Not responsible for grandchildrenHispanic or Latino 64 100.0% Not responsible for grandchildrenGrandparents (60 years and over) Black or African American 35 100.0% Not responsible for grandchildrenOther race 83 100.0% Responsible for grandchildrenHispanic or Latino 59 55.1% Responsible for grandchildren48 44.9% Not responsible for grandchildren