Races in Dodge City, Kansas (KS) Detailed Stats
Data:
Races - White alone (%)
Races - White alone (% change since 2000)
Races - Black alone (%)
Races - Black alone (% change since 2000)
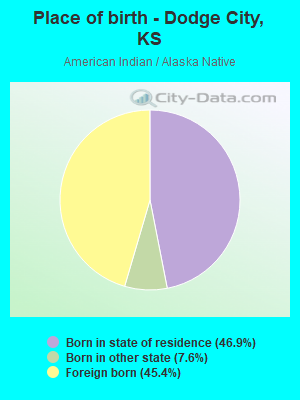
Races - American Indian alone (%)
Races - American Indian alone (% change since 2000)
Races - Asian alone (%)
Races - Asian alone (% change since 2000)
Races - Hispanic (%)
Races - Hispanic (% change since 2000)
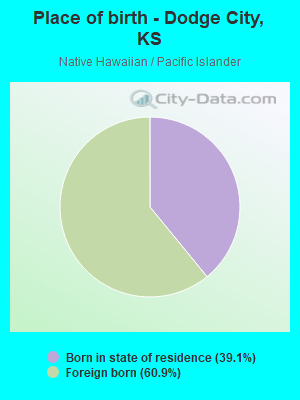
Races - Native Hawaiian and Other Pacific Islander alone (%)
Races - Native Hawaiian and Other Pacific Islander alone (% change since 2000)
Races - Two or more races(%)
Races - Two or more races(% change since 2000)
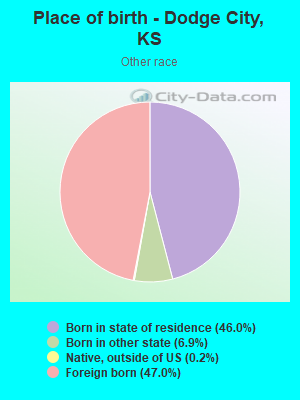
Races - Other race alone (%)
Races - Other race alone (% change since 2000)
Racial diversity
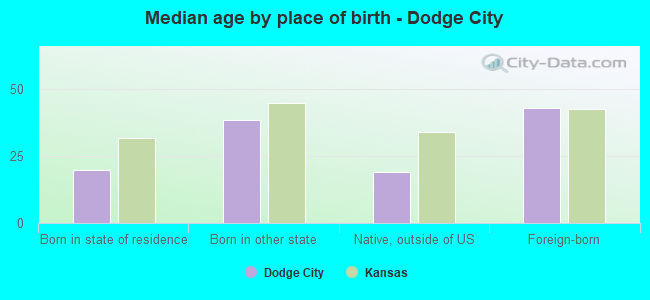
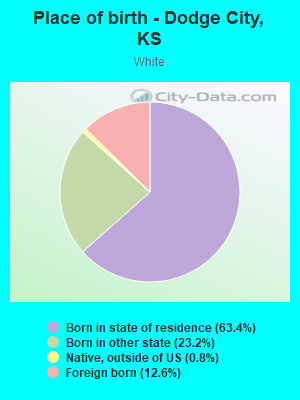
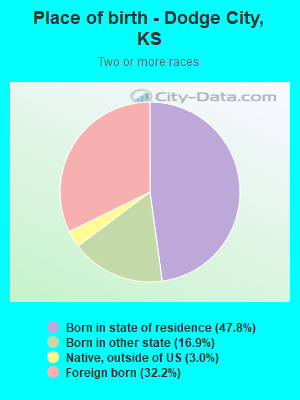
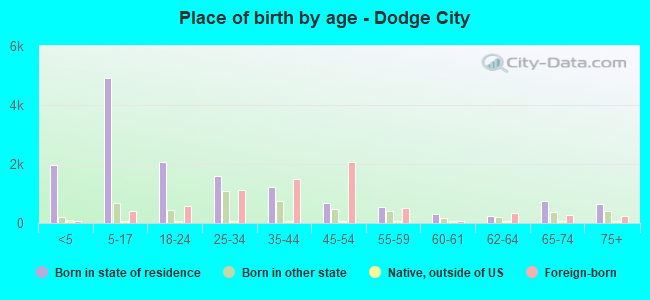
Place of birth - Born in state of residence (%)
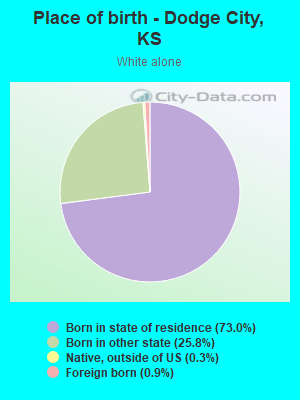
Place of birth - Born in state of residence (%) - White
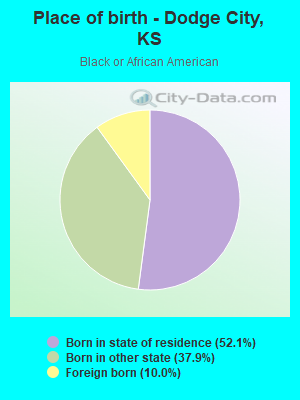
Place of birth - Born in state of residence (%) - Black or African American
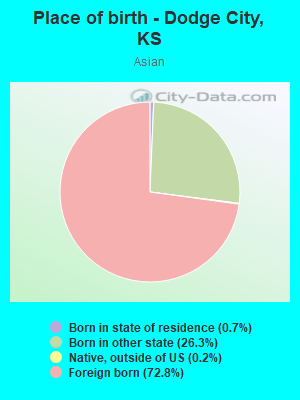
Place of birth - Born in state of residence (%) - Asian
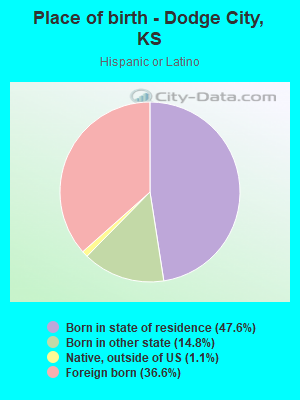
Place of birth - Born in state of residence (%) - Hispanic or Latino
Place of birth - Born in state of residence (%) - American Indian and Alaska Native
Place of birth - Born in state of residence (%) - Multirace
Place of birth - Born in state of residence (%) - Other Race
Place of birth - Born in other state (%)
Place of birth - Born in other state (%) - White
Place of birth - Born in other state (%) - Black or African American
Place of birth - Born in other state (%) - Asian
Place of birth - Born in other state (%) - Hispanic or Latino
Place of birth - Born in other state (%) - American Indian and Alaska Native
Place of birth - Born in other state (%) - Multirace
Place of birth - Born in other state (%) - Other Race
Place of birth - Native, outside of US (%)
Place of birth - Native, outside of US (%) - White
Place of birth - Native, outside of US (%) - Black or African American
Place of birth - Native, outside of US (%) - Asian
Place of birth - Native, outside of US (%) - Hispanic or Latino
Place of birth - Native, outside of US (%) - American Indian and Alaska Native
Place of birth - Native, outside of US (%) - Multirace
Place of birth - Native, outside of US (%) - Other Race
Place of birth - Foreign born (%)
Place of birth - Foreign born (%) - White
Place of birth - Foreign born (%) - Black or African American
Place of birth - Foreign born (%) - Asian
Place of birth - Foreign born (%) - Hispanic or Latino
Place of birth - Foreign born (%) - American Indian and Alaska Native
Place of birth - Foreign born (%) - Multirace
Place of birth - Foreign born (%) - Other Race
Residents speaking English at home (%)
Residents speaking English at home - Born in the United States (%)
Residents speaking English at home - Native, born elsewhere (%)
Residents speaking English at home - Foreign born (%)
Residents speaking Spanish at home (%)
Residents speaking Spanish at home - Born in the United States (%)
Residents speaking Spanish at home - Native, born elsewhere (%)
Residents speaking Spanish at home - Foreign born (%)
Residents speaking other language at home (%)
Residents speaking other language at home - Born in the United States (%)
Residents speaking other language at home - Native, born elsewhere (%)
Residents speaking other language at home - Foreign born (%)
Marital status - Never married (%)
Marital status - Now married (%)
Marital status - Separated (%)
Marital status - Widowed (%)
Marital status - Divorced (%)
Ancestries Reported - Arab (%)
Ancestries Reported - Czech (%)
Ancestries Reported - Danish (%)
Ancestries Reported - Dutch (%)
Ancestries Reported - English (%)
Ancestries Reported - French (%)
Ancestries Reported - French Canadian (%)
Ancestries Reported - German (%)
Ancestries Reported - Greek (%)
Ancestries Reported - Hungarian (%)
Ancestries Reported - Irish (%)
Ancestries Reported - Italian (%)
Ancestries Reported - Lithuanian (%)
Ancestries Reported - Norwegian (%)
Ancestries Reported - Polish (%)
Ancestries Reported - Portuguese (%)
Ancestries Reported - Russian (%)
Ancestries Reported - Scotch-Irish (%)
Ancestries Reported - Scottish (%)
Ancestries Reported - Slovak (%)
Ancestries Reported - Subsaharan African (%)
Ancestries Reported - Swedish (%)
Ancestries Reported - Swiss (%)
Ancestries Reported - Ukrainian (%)
Ancestries Reported - United States (%)
Ancestries Reported - Welsh (%)
Ancestries Reported - West Indian (%)
Ancestries Reported - Other (%)
Geographical mobility - Same house 1 year ago (%)
Geographical mobility - Same house 1 year ago (%) - White
Geographical mobility - Same house 1 year ago (%) - Black or African American
Geographical mobility - Same house 1 year ago (%) - Asian
Geographical mobility - Same house 1 year ago (%) - Hispanic or Latino
Geographical mobility - Same house 1 year ago (%) - American Indian and Alaska Native
Geographical mobility - Same house 1 year ago (%) - Multirace
Geographical mobility - Same house 1 year ago (%) - Other Race
Geographical mobility - Moved within same county (%)
Geographical mobility - Moved within same county (%) - White
Geographical mobility - Moved within same county (%) - Black or African American
Geographical mobility - Moved within same county (%) - Asian
Geographical mobility - Moved within same county (%) - Hispanic or Latino
Geographical mobility - Moved within same county (%) - American Indian and Alaska Native
Geographical mobility - Moved within same county (%) - Multirace
Geographical mobility - Moved within same county (%) - Other Race
Geographical mobility - Moved from different county within same state (%)
Geographical mobility - Moved from different county within same state (%) - White
Geographical mobility - Moved from different county within same state (%) - Black or African American
Geographical mobility - Moved from different county within same state (%) - Asian
Geographical mobility - Moved from different county within same state (%) - Hispanic or Latino
Geographical mobility - Moved from different county within same state (%) - American Indian and Alaska Native
Geographical mobility - Moved from different county within same state (%) - Multirace
Geographical mobility - Moved from different county within same state (%) - Other Race
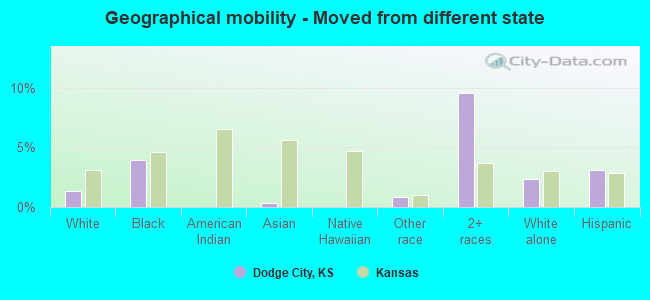
Geographical mobility - Moved from different state (%)
Geographical mobility - Moved from different state (%) - White
Geographical mobility - Moved from different state (%) - Black or African American
Geographical mobility - Moved from different state (%) - Asian
Geographical mobility - Moved from different state (%) - Hispanic or Latino
Geographical mobility - Moved from different state (%) - American Indian and Alaska Native
Geographical mobility - Moved from different state (%) - Multirace
Geographical mobility - Moved from different state (%) - Other Race
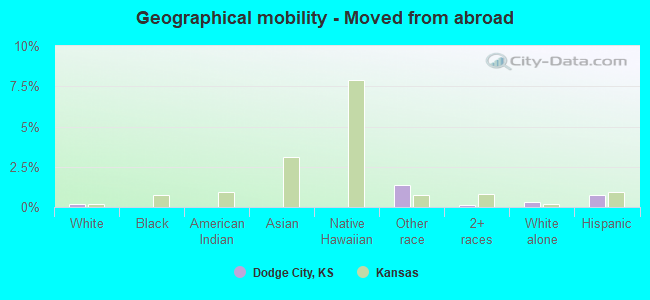
Geographical mobility - Moved from abroad (%)
Geographical mobility - Moved from abroad (%) - White
Geographical mobility - Moved from abroad (%) - Black or African American
Geographical mobility - Moved from abroad (%) - Asian
Geographical mobility - Moved from abroad (%) - Hispanic or Latino
Geographical mobility - Moved from abroad (%) - American Indian and Alaska Native
Geographical mobility - Moved from abroad (%) - Multirace
Geographical mobility - Moved from abroad (%) - Other Race
Place of birth for the foreign-born population - Ireland (%)
Place of birth for the foreign-born population - Denmark (%)
Place of birth for the foreign-born population - Norway (%)
Place of birth for the foreign-born population - Sweden (%)
Place of birth for the foreign-born population - United Kingdom (%)
Place of birth for the foreign-born population - England (%)
Place of birth for the foreign-born population - Scotland (%)
Place of birth for the foreign-born population - Other Northern Europe (%)
Place of birth for the foreign-born population - Austria (%)
Place of birth for the foreign-born population - Belgium (%)
Place of birth for the foreign-born population - France (%)
Place of birth for the foreign-born population - Germany (%)
Place of birth for the foreign-born population - Netherlands (%)
Place of birth for the foreign-born population - Switzerland (%)
Place of birth for the foreign-born population - Other Western Europe (%)
Place of birth for the foreign-born population - Greece (%)
Place of birth for the foreign-born population - Italy (%)
Place of birth for the foreign-born population - Portugal (%)
Place of birth for the foreign-born population - Spain (%)
Place of birth for the foreign-born population - Other Southern Europe (%)
Place of birth for the foreign-born population - Albania (%)
Place of birth for the foreign-born population - Belarus (%)
Place of birth for the foreign-born population - Bosnia and Herzegovina (%)
Place of birth for the foreign-born population - Bulgaria (%)
Place of birth for the foreign-born population - Croatia (%)
Place of birth for the foreign-born population - Czechoslovakia (%)
Place of birth for the foreign-born population - Hungary (%)
Place of birth for the foreign-born population - Latvia (%)
Place of birth for the foreign-born population - Lithuania (%)
Place of birth for the foreign-born population - North Macedonia (Macedonia) (%)
Place of birth for the foreign-born population - Moldova (%)
Place of birth for the foreign-born population - Poland (%)
Place of birth for the foreign-born population - Romania (%)
Place of birth for the foreign-born population - Russia (%)
Place of birth for the foreign-born population - Serbia (%)
Place of birth for the foreign-born population - Ukraine (%)
Place of birth for the foreign-born population - Other Eastern Europe (%)
Place of birth for the foreign-born population - China (%)
Place of birth for the foreign-born population - Hong Kong (%)
Place of birth for the foreign-born population - Taiwan (%)
Place of birth for the foreign-born population - Japan (%)
Place of birth for the foreign-born population - Korea (%)
Place of birth for the foreign-born population - Other Eastern Asia (%)
Place of birth for the foreign-born population - Afghanistan (%)
Place of birth for the foreign-born population - Bangladesh (%)
Place of birth for the foreign-born population - India (%)
Place of birth for the foreign-born population - Iran (%)
Place of birth for the foreign-born population - Kazakhstan (%)
Place of birth for the foreign-born population - Nepal (%)
Place of birth for the foreign-born population - Pakistan (%)
Place of birth for the foreign-born population - Sri Lanka (%)
Place of birth for the foreign-born population - Uzbekistan (%)
Place of birth for the foreign-born population - Other South Central Asia (%)
Place of birth for the foreign-born population - Burma (%)
Place of birth for the foreign-born population - Cambodia (%)
Place of birth for the foreign-born population - Indonesia (%)
Place of birth for the foreign-born population - Laos (%)
Place of birth for the foreign-born population - Malaysia (%)
Place of birth for the foreign-born population - Philippines (%)
Place of birth for the foreign-born population - Singapore (%)
Place of birth for the foreign-born population - Thailand (%)
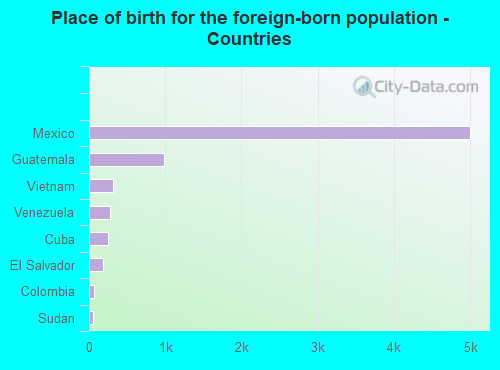
Place of birth for the foreign-born population - Vietnam (%)
Place of birth for the foreign-born population - Other South Eastern Asia (%)
Place of birth for the foreign-born population - Armenia (%)
Place of birth for the foreign-born population - Iraq (%)
Place of birth for the foreign-born population - Israel (%)
Place of birth for the foreign-born population - Jordan (%)
Place of birth for the foreign-born population - Kuwait (%)
Place of birth for the foreign-born population - Lebanon (%)
Place of birth for the foreign-born population - Saudi Arabia (%)
Place of birth for the foreign-born population - Syria (%)
Place of birth for the foreign-born population - Turkey (%)
Place of birth for the foreign-born population - Yemen (%)
Place of birth for the foreign-born population - Other Western Asia (%)
Place of birth for the foreign-born population - Eritrea (%)
Place of birth for the foreign-born population - Ethiopia (%)
Place of birth for the foreign-born population - Kenya (%)
Place of birth for the foreign-born population - Somalia (%)
Place of birth for the foreign-born population - Uganda (%)
Place of birth for the foreign-born population - Zimbabwe (%)
Place of birth for the foreign-born population - Other Eastern Africa (%)
Place of birth for the foreign-born population - Cameroon (%)
Place of birth for the foreign-born population - Congo (%)
Place of birth for the foreign-born population - Democratic Republic of Congo (Zaire) (%)
Place of birth for the foreign-born population - Other Middle Africa (%)
Place of birth for the foreign-born population - Egypt (%)
Place of birth for the foreign-born population - Morocco (%)
Place of birth for the foreign-born population - Sudan (%)
Place of birth for the foreign-born population - Other Northern Africa (%)
Place of birth for the foreign-born population - South Africa (%)
Place of birth for the foreign-born population - Other Southern Africa (%)
Place of birth for the foreign-born population - Cabo Verde (%)
Place of birth for the foreign-born population - Ghana (%)
Place of birth for the foreign-born population - Liberia (%)
Place of birth for the foreign-born population - Nigeria (%)
Place of birth for the foreign-born population - Senegal (%)
Place of birth for the foreign-born population - Sierra Leone (%)
Place of birth for the foreign-born population - Other Western Africa (%)
Place of birth for the foreign-born population - Australia (%)
Place of birth for the foreign-born population - New Zealand (%)
Place of birth for the foreign-born population - Fiji (%)
Place of birth for the foreign-born population - Micronesia (%)
Place of birth for the foreign-born population - Bahamas (%)
Place of birth for the foreign-born population - Barbados (%)
Place of birth for the foreign-born population - Cuba (%)
Place of birth for the foreign-born population - Dominica (%)
Place of birth for the foreign-born population - Dominican Republic (%)
Place of birth for the foreign-born population - Grenada (%)
Place of birth for the foreign-born population - Haiti (%)
Place of birth for the foreign-born population - Jamaica (%)
Place of birth for the foreign-born population - St. Vincent and the Grenadines (%)
Place of birth for the foreign-born population - Trinidad and Tobago (%)
Place of birth for the foreign-born population - West Indies (%)
Place of birth for the foreign-born population - Other Caribbean (%)
Place of birth for the foreign-born population - Belize (%)
Place of birth for the foreign-born population - Costa Rica (%)
Place of birth for the foreign-born population - El Salvador (%)
Place of birth for the foreign-born population - Guatemala (%)
Place of birth for the foreign-born population - Honduras (%)
Place of birth for the foreign-born population - Mexico (%)
Place of birth for the foreign-born population - Nicaragua (%)
Place of birth for the foreign-born population - Panama (%)
Place of birth for the foreign-born population - Other Central America (%)
Place of birth for the foreign-born population - Argentina (%)
Place of birth for the foreign-born population - Bolivia (%)
Place of birth for the foreign-born population - Brazil (%)
Place of birth for the foreign-born population - Chile (%)
Place of birth for the foreign-born population - Colombia (%)
Place of birth for the foreign-born population - Ecuador (%)
Place of birth for the foreign-born population - Guyana (%)
Place of birth for the foreign-born population - Peru (%)
Place of birth for the foreign-born population - Uruguay (%)
Place of birth for the foreign-born population - Venezuela (%)
Place of birth for the foreign-born population - Other South America (%)
Place of birth for the foreign-born population - Canada (%)
Place of birth for the foreign-born population - Other Northern America (%)
Place of birth for the foreign-born population - Other (%)
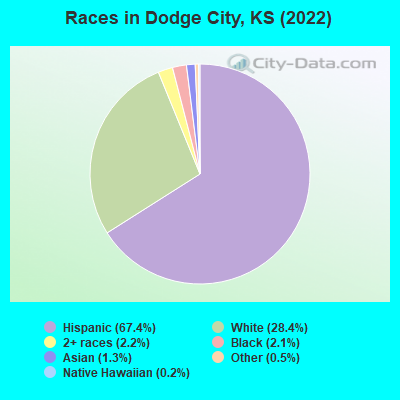
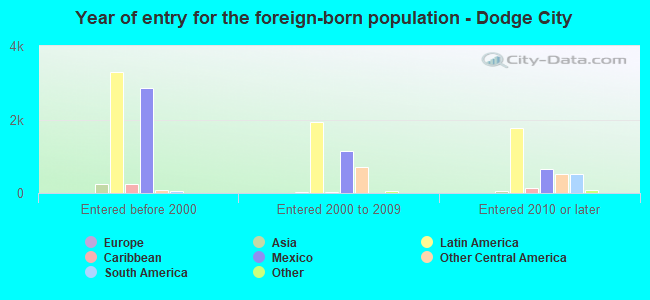
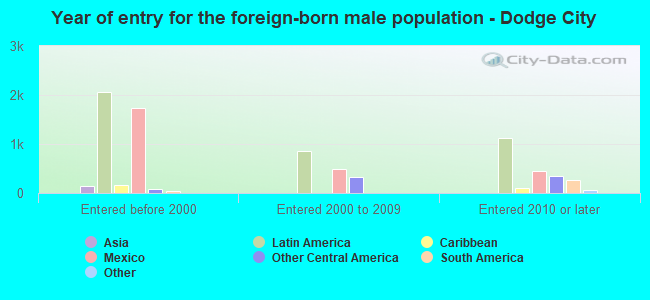
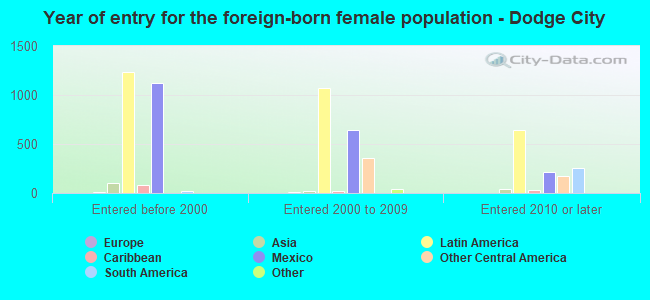
According to 2022 data, the most numerous races in Dodge City, KS are White alone (7,871 residents), Hispanic (18,681 residents), and Black alone (583 residents). 44.5% of Dodge City residents speak English at home. 26.6% of Dodge City, KS residents are foreign-born (24.3% born in Latin America), which is 73.6% greater than the foreign-born rate of 7.0% across the entire state of Kansas.
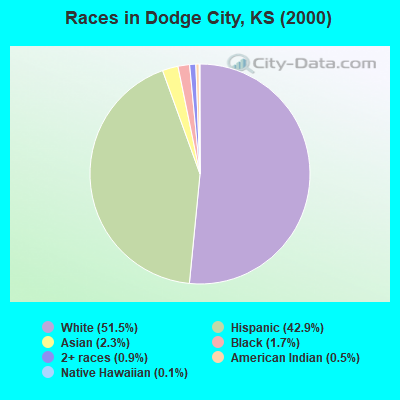
Race distribution in Dodge City
2000 2022
2,233,997 83.1% White alone 188,252 7.0% Hispanic 151,407 5.6% Black alone 46,301 1.7% Asian alone 42,508 1.6% Two or more races 22,322 0.8% American Indian alone 2,477 0.09% Other race alone 1,154 0.04% Native Hawaiian and Other
2,147,943 73.1% White alone 381,746 13.0% Hispanic 147,666 5.0% Black alone 145,362 4.9% Two or more races 85,085 2.9% Asian alone 13,263 0.5% Other race alone 12,065 0.4% American Indian alone 4,020 0.1% Native Hawaiian and Other
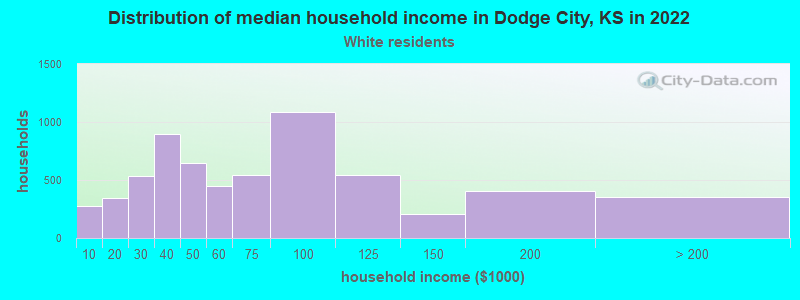
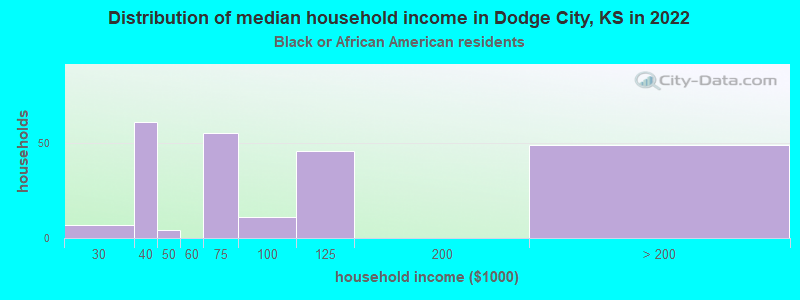
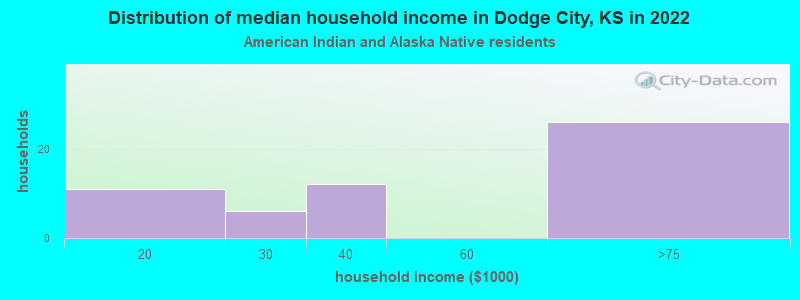
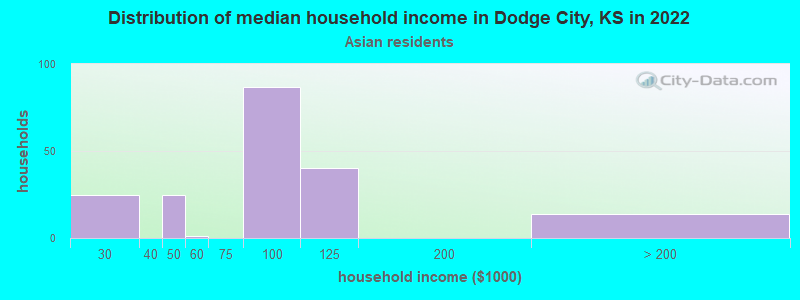
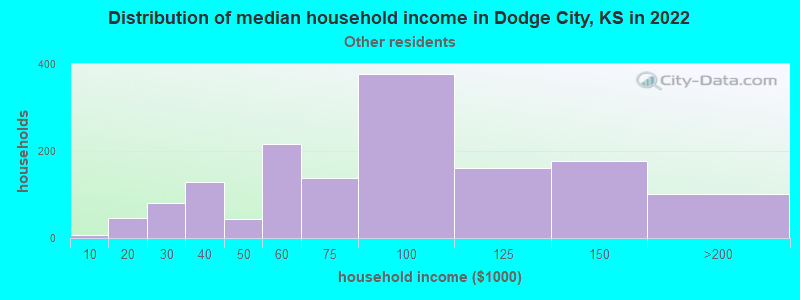
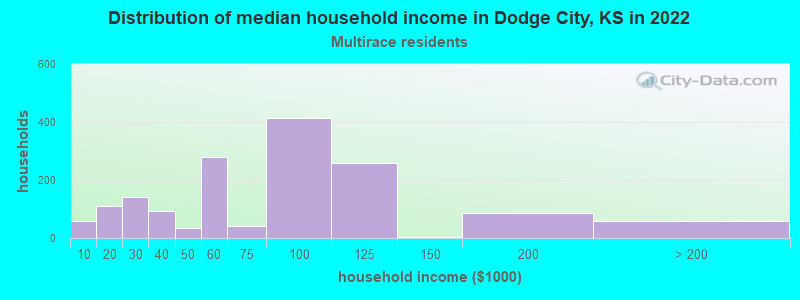
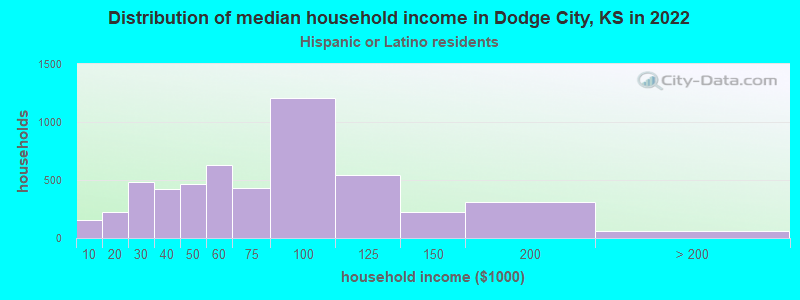
Income and house value in Dodge City Median household income in 2022 $60,652 White non-Hispanic householders$75,187 Black householders$93,375 Asian householders$82,194 Some other race householders$69,570 Two or more races householders$68,162 Hispanic or Latino race householdersMedian 2022 house value $150,424 White Non-Hispanic householders$90,179 Black or African American householders$125,540 American Indian or Alaska Native householders $118,992 Asian householders$83,818 Some other race householders$108,141 Two or more races householders$89,244 Hispanic or Latino householders
Median age by race in Dodge City
33.7 Median age for White residents32.4 34.4 41.2 Median age for Black or African American residents45.6 40.8 16.8 Median age for American Indian / Alaska Native residents17.0 19.2 50.8 Median age for Asian residents50.4 50.2 25.1 Median age for Native Hawaiian / Pacific Islander residents-669,240,668.6 -641,269,840.6 26.6 Median age for Other race residents27.2 24.0 25.2 Median age for Two or more races residents20.2 28.8 44.9 Median age for White alone residents43.3 48.7 25.1 Median age for Hispanic or Latino residents25.1 25.2
Owner/renter occupied households by race in Dodge City
House owners and renters - White residents 4,157 66.3% Owner occupied2,109 33.7% Renter occupiedHouse owners and renters - Black or African American residents 52 23.9% Owner occupied164 76.1% Renter occupiedHouse owners and renters - American Indian / Alaska Native residents 42 60.6% Owner occupied28 39.4% Renter occupiedHouse owners and renters - Asian residents 193 99.5% Owner occupied1 0.5% Renter occupiedHouse owners and renters - Native Hawaiian / Pacific Islander residents 29 100.0% Renter occupiedHouse owners and renters - Other race residents 918 62.2% Owner occupied557 37.8% Renter occupiedHouse owners and renters - Two or more races residents 425 29.4% Owner occupied1,021 70.6% Renter occupiedHouse owners and renters - White alone residents 2,485 66.7% Owner occupied1,238 33.3% Renter occupiedHouse owners and renters - Hispanic or Latino residents 2,921 56.2% Owner occupied2,277 43.8% Renter occupied
Language usage in Dodge City
English speakers - Total 44.5% of residents of Dodge City speak English at home.
53.1% of residents speak Spanish at home 7,662 56.9% Speak English very well5,807 43.1% Speak English less than very well2.8% of residents speak other language at home 238 33.3% Speak English very well476 66.7% Speak English less than very well
English speakers - Born in the United States 64.8% of residents of Dodge City speak English at home.
35.9% of residents speak Spanish at home 1,559 86.4% Speak English very well245 13.6% Speak English less than very well0.4% of residents speak other language at home 9 50.0% Speak English very well9 50.0% Speak English less than very well
English speakers - Native, born elsewhere 63.7% of residents of Dodge City speak English at home.
40.0% of residents speak Spanish at home 8 10.5% Speak English very well68 89.5% Speak English less than very well
English speakers - Foreign-born 2.9% of residents of Dodge City speak English at home.
91.4% of residents speak Spanish at home 1,932 29.5% Speak English very well4,612 70.5% Speak English less than very well6.5% of residents speak other language at home 191 41.3% Speak English very well272 58.7% Speak English less than very well
White (Caucasian) - Speak only English Native:
66.6% (8,149)Foreign-born:
2.4% (46)
White (Caucasian) - Speak another language Native:
22.3% (2,724)Foreign-born:
86.0% (1,626)
Black or African American - Speak another language Native:
7.4% (40)Foreign-born:
98.2% (67)
American Indian / Alaska Native - Speak another language Native:
43.8% (79)Foreign-born:
100.0% (165)
Asian - Speak only English Native:
98.4% (24)Foreign-born:
10.5% (34)
Asian - Speak another language Native:
10.6% (3)Foreign-born:
89.7% (293)
Native Hawaiian / Pacific Islander - Speak another language Native:
57.0% (29)Foreign-born:
85.0% (80)
Other race - Speak only English Native:
35.1% (881)Foreign-born:
7.2% (176)
Other race - Speak another language Native:
62.4% (1,568)Foreign-born:
92.1% (2,254)
Two or more races - Speak only English Native:
48.8% (1,891)Foreign-born:
0.6% (14)
Two or more races - Speak another language Native:
60.6% (2,346)Foreign-born:
100.0% (2,257)
White alone - Speak only English Native:
98.1% (7,306)Foreign-born:
31.7% (23)
White alone - Speak another language Native:
1.8% (134)Foreign-born:
69.7% (50)
Hispanic or Latino - Speak only English Native:
28.9% (2,882)Foreign-born:
2.6% (177)
Hispanic or Latino - Speak another language Native:
70.7% (7,055)Foreign-born:
96.4% (6,539)
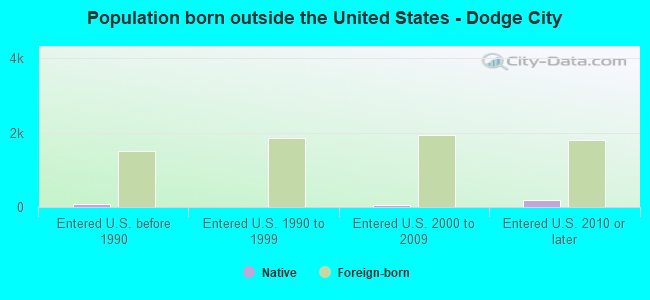
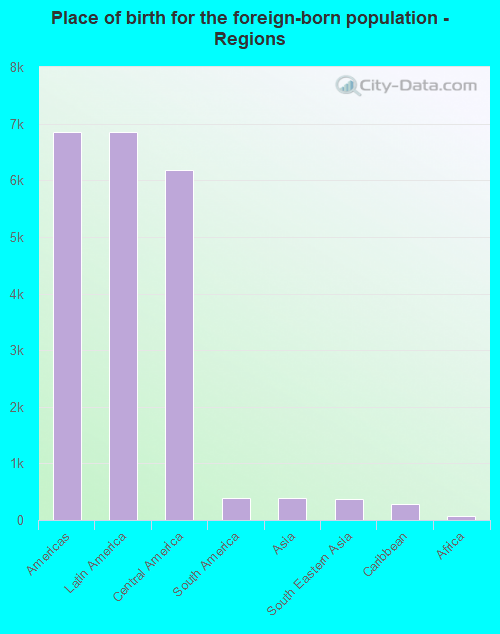
Foreign-born residents in Dodge City 7,367 residents are foreign born (24.3% Latin America ).
This city:
26.6%Kansas:
7.1%
Marital status for residents in Dodge City Marital status - White (Caucasian) population 15 years and over
Males 30.5% Never married53.1% Now married1.3% Separated2.6% Widowed12.5% DivorcedFemales 28.7% Never married44.7% Now married2.0% Separated10.9% Widowed13.6% DivorcedWomen who gave birth in the past 12 months Now married:
82.3% (194)Unmarried:
17.7% (42)
Women who did not give birth in the past 12 months Now married:
44.6% (1,649)Unmarried:
55.4% (2,050)
Marital status - Black or African American population 15 years and over
Males 69.1% Never married30.9% Now married0.0% Separated0.0% Widowed0.0% DivorcedFemales 29.9% Never married42.0% Now married2.5% Separated0.0% Widowed25.6% DivorcedWomen who did not give birth in the past 12 months Now married:
47.2% (86)Unmarried:
52.8% (96)
Marital status - American Indian / Alaska Native population 15 years and over
Males 44.7% Never married55.3% Now married0.0% Separated0.0% Widowed0.0% DivorcedFemales 52.1% Never married24.7% Now married0.0% Separated23.3% Widowed0.0% DivorcedWomen who gave birth in the past 12 months Now married:
100.0% (20)Unmarried:
0.0% (0)
Women who did not give birth in the past 12 months Now married:
0.0% (0)Unmarried:
100.0% (62)
Marital status - Asian population 15 years and over
Males 0.0% Never married81.4% Now married0.0% Separated0.0% Widowed18.6% DivorcedFemales 0.5% Never married84.9% Now married0.0% Separated0.0% Widowed14.6% DivorcedWomen who did not give birth in the past 12 months Now married:
99.2% (122)Unmarried:
0.8% (1)
Marital status - Native Hawaiian / Pacific Islander population 15 years and over
Males 0.0% Never married100.0% Now married0.0% Separated0.0% Widowed0.0% DivorcedFemales 0.0% Never married100.0% Now married0.0% Separated0.0% Widowed0.0% DivorcedWomen who gave birth in the past 12 months Now married:
100.0% (34)Unmarried:
0.0% (0)
Women who did not give birth in the past 12 months Now married:
100.0% (17)Unmarried:
0.0% (0)
Marital status - Other race population 15 years and over
Males 41.2% Never married40.9% Now married5.4% Separated0.0% Widowed12.5% DivorcedFemales 25.6% Never married55.1% Now married1.2% Separated4.3% Widowed13.8% DivorcedWomen who gave birth in the past 12 months Now married:
100.0% (24)Unmarried:
0.0% (0)
Women who did not give birth in the past 12 months Now married:
56.0% (463)Unmarried:
44.0% (363)
Marital status - Two or more races population 15 years and over
Males 45.0% Never married38.8% Now married0.3% Separated1.0% Widowed14.9% DivorcedFemales 48.7% Never married34.3% Now married0.8% Separated4.6% Widowed11.6% DivorcedWomen who gave birth in the past 12 months Now married:
100.0% (37)Unmarried:
0.0% (0)
Women who did not give birth in the past 12 months Now married:
30.6% (507)Unmarried:
69.4% (1,147)
Marital status - White alone, not Hispanic / Latino population 15 years and over
Males 30.2% Never married49.6% Now married0.0% Separated2.9% Widowed17.3% DivorcedFemales 24.4% Never married42.5% Now married0.7% Separated17.9% Widowed14.4% DivorcedWomen who gave birth in the past 12 months Now married:
88.8% (109)Unmarried:
11.2% (14)
Women who did not give birth in the past 12 months Now married:
44.5% (666)Unmarried:
55.5% (829)
Marital status - Hispanic or Latino population 15 years and over
Males 37.0% Never married48.1% Now married2.9% Separated1.4% Widowed10.7% DivorcedFemales 36.8% Never married44.4% Now married2.3% Separated4.1% Widowed12.4% DivorcedWomen who gave birth in the past 12 months Now married:
84.0% (167)Unmarried:
16.0% (32)
Women who did not give birth in the past 12 months Now married:
41.1% (1,838)Unmarried:
58.9% (2,636)
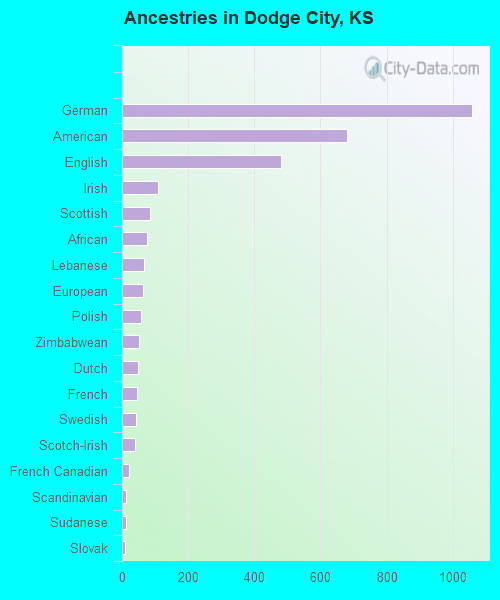
Ancestries in Dodge City
1,057 6.2% German681 4.0% American482 2.8% English110 0.6% Irish85 0.5% Scottish76 0.4% African66 0.4% Lebanese62 0.4% European57 0.3% Polish52 0.3% Zimbabwean49 0.3% Dutch45 0.3% French43 0.3% Swedish38 0.2% Scotch-Irish21 0.1% French Canadian12 0.07% Scandinavian12 0.07% Sudanese10 0.06% Slovak9 0.05% German Russian9 0.05% Russian4 0.02% Italian1 0.01% Brazilian
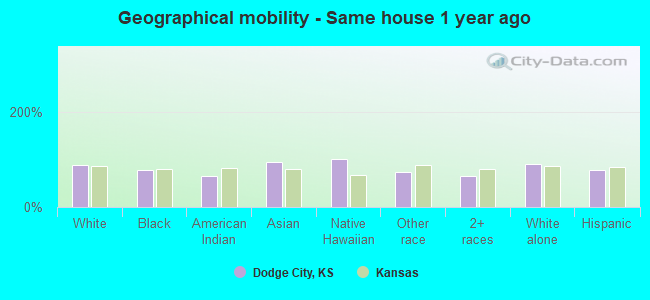
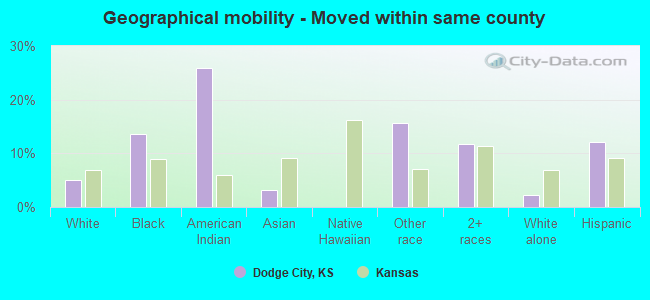
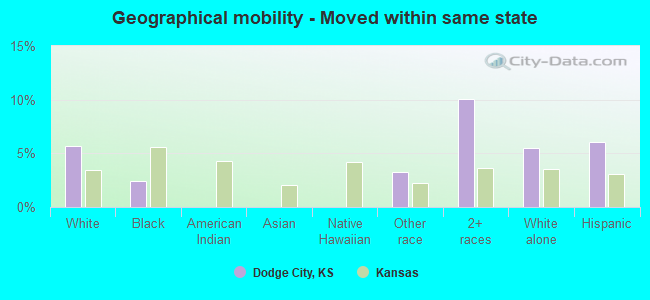
Geographical mobility in Dodge City Same house 1 year ago 14,367 88.1% White (Caucasian)498 78.1% Black or African American186 64.2% American Indian / Alaska Native344 94.7% Asian80 100.0% Native Hawaiian / Pacific Islander3,832 73.1% Other race4,395 66.3% Two or more races7,051 90.3% White alone, not Hispanic / Latino14,196 77.1% Hispanic or LatinoMoved within same county 805 4.9% White / Caucasian87 13.6% Black or African American75 25.9% American Indian / Alaska Native12 3.2% Asian819 15.6% Other race779 11.7% Two or more races170 2.2% White alone, not Hispanic / Latino2,230 12.1% Hispanic or LatinoMoved within same state 927 5.7% White / Caucasian16 2.4% Black or African American173 3.3% Other race667 10.0% Two or more races432 5.5% White alone, not Hispanic / Latino1,111 6.0% Hispanic or LatinoMoved from different state 216 1.3% White / Caucasian25 3.9% Black or African American1 0.3% Asian46 0.9% Other race632 9.5% Two or more races180 2.3% White alone, not Hispanic / Latino578 3.1% Hispanic or LatinoMoved from abroad 25 0.2% White71 1.4% Other race7 0.1% Two or more races26 0.3% White alone, not Hispanic / Latino135 0.7% Hispanic or Latino
Children Nativity (place of birth) in Dodge City
Children under 6 years - Living with two parents Both parents native 433 97.6% Native10 2.4% Foreign-bornBoth parents foreign-born 614 87.1% Native91 12.9% Foreign-bornOne native, one foreign-born parent 517 90.2% Native56 9.8% Foreign-bornChildren under 6 years - Living with one parent Native parent 642 100.0% NativeForeign-born parent 118 100.0% NativeChildren 6 to 17 years - Living with two parents Both parents native 1,228 99.7% Native3 0.3% Foreign-bornBoth parents foreign-born 1,539 86.0% Native251 14.0% Foreign-bornOne native, one foreign-born parent 612 100.0% NativeChildren 6 to 17 years - Living with one parent Native parent 872 100.0% NativeForeign-born parent 807 51.7% Native752 48.3% Foreign-born
Grandparents responsible for own grandchildren in Dodge City
Grandparents (30 to 59 years) White / Caucasian 30 100.0% Not responsible for grandchildrenOther race 7 100.0% Responsible for grandchildrenTwo or more races 11 8.4% Responsible for grandchildren119 91.6% Not responsible for grandchildrenWhite alone, not Hispanic / Latino 19 100.0% Not responsible for grandchildrenHispanic or Latino 12 8.6% Responsible for grandchildren131 91.4% Not responsible for grandchildrenGrandparents (60 years and over) White / Caucasian 30 13.5% Responsible for grandchildren190 86.5% Not responsible for grandchildrenOther race 16 100.0% Responsible for grandchildrenTwo or more races 13 14.5% Responsible for grandchildren77 85.5% Not responsible for grandchildrenWhite alone, not Hispanic / Latino 30 18.7% Responsible for grandchildren133 81.3% Not responsible for grandchildrenHispanic or Latino 22 16.4% Responsible for grandchildren110 83.6% Not responsible for grandchildren