Races in District 5, Queenstown, Maryland (MD) Detailed Stats
Ancestries, Foreign-born residents, place of birth
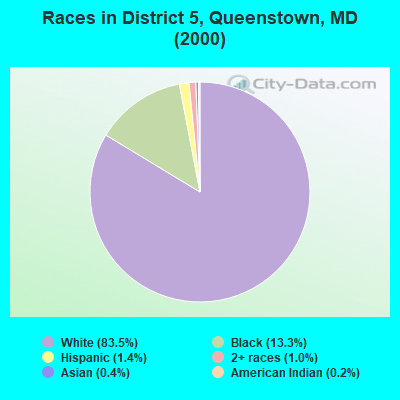
Race distribution in District 5, Queenstown

- 6,45583.5%White alone
- 1,03113.3%Black alone
- 1081.4%Hispanic
- 741.0%Two or more races
- 330.4%Asian alone
- 170.2%American Indian alone
- 50.06%Other race alone
- 40.05%Native Hawaiian and Other
Pacific Islander alone
2000
2022
-
- 3,286,54762.1%White alone
- 1,464,73527.7%Black alone
- 227,9164.3%Hispanic
- 209,7384.0%Asian alone
- 82,9461.6%Two or more races
- 13,3120.3%American Indian alone
- 9,3790.2%Other race alone
- 1,9130.04%Native Hawaiian and Other
Pacific Islander alone

-
- 2,906,49247.1%White alone
- 1,800,91429.2%Black alone
- 705,84211.4%Hispanic
- 401,8186.5%Asian alone
- 291,3174.7%Two or more races
- 46,9300.8%Other race alone
- 8,9300.1%American Indian alone
- 2,4170.04%Native Hawaiian and Other
Pacific Islander alone

Income and house value in District 5, Queenstown
- Median household income in 2022
- $127,785White non-Hispanic householders
- $68,581Black householders
- $114,599American Indian and Alaska Native householders
- $28,957Some other race householders
- $37,640Two or more races householders
- $48,997Hispanic or Latino race householders
- Median 2022 house value
- $627,085White Non-Hispanic householders
- $251,606Black or African American householders
- $262,090American Indian or Alaska Native householders
- $234,501Two or more races householders
- $531,077Hispanic or Latino householders
Household income for White non-Hispanic householders

Household income for Black householders

Household income for American Indian and Alaska Native householders

Household income for Two or more races householders

Household income for Hispanic or Latino race householders

Zip code: 21638