Races in District 25, Hagerstown, Maryland (MD) Detailed Stats
Ancestries, Foreign-born residents, place of birth
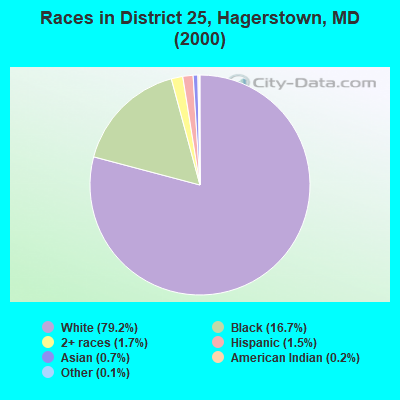
Race distribution in District 25, Hagerstown

- 6,29879.2%White alone
- 1,32616.7%Black alone
- 1351.7%Two or more races
- 1161.5%Hispanic
- 520.7%Asian alone
- 150.2%American Indian alone
- 100.1%Other race alone
- 10.01%Native Hawaiian and Other
Pacific Islander alone
2000
2022
-
- 3,286,54762.1%White alone
- 1,464,73527.7%Black alone
- 227,9164.3%Hispanic
- 209,7384.0%Asian alone
- 82,9461.6%Two or more races
- 13,3120.3%American Indian alone
- 9,3790.2%Other race alone
- 1,9130.04%Native Hawaiian and Other
Pacific Islander alone

-
- 2,906,49247.1%White alone
- 1,800,91429.2%Black alone
- 705,84211.4%Hispanic
- 401,8186.5%Asian alone
- 291,3174.7%Two or more races
- 46,9300.8%Other race alone
- 8,9300.1%American Indian alone
- 2,4170.04%Native Hawaiian and Other
Pacific Islander alone

Income and house value in District 25, Hagerstown
- Median household income in 2022
- $58,086White non-Hispanic householders
- $32,578Black householders
- $66,137Asian householders
- $37,087Some other race householders
- $27,932Two or more races householders
- $24,094Hispanic or Latino race householders
- Median 2022 house value
- $205,891White Non-Hispanic householders
- $139,925Black or African American householders
- $281,101Two or more races householders
- $187,400Hispanic or Latino householders
Household income for White non-Hispanic householders

Household income for Black householders

Household income for Asian householders

Household income for Two or more races householders

Household income for Hispanic or Latino race householders

Zip code: 21740