Races in District 1, Taneytown, Maryland (MD) Detailed Stats
Ancestries, Foreign-born residents, place of birth
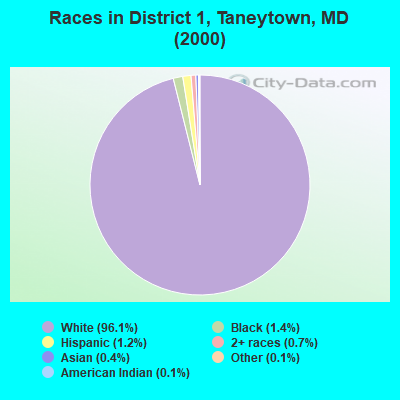
Race distribution in District 1, Taneytown

- 7,55896.1%White alone
- 1091.4%Black alone
- 981.2%Hispanic
- 530.7%Two or more races
- 300.4%Asian alone
- 100.1%Other race alone
- 90.1%American Indian alone
2000
2022
-
- 3,286,54762.1%White alone
- 1,464,73527.7%Black alone
- 227,9164.3%Hispanic
- 209,7384.0%Asian alone
- 82,9461.6%Two or more races
- 13,3120.3%American Indian alone
- 9,3790.2%Other race alone
- 1,9130.04%Native Hawaiian and Other
Pacific Islander alone

-
- 2,906,49247.1%White alone
- 1,800,91429.2%Black alone
- 705,84211.4%Hispanic
- 401,8186.5%Asian alone
- 291,3174.7%Two or more races
- 46,9300.8%Other race alone
- 8,9300.1%American Indian alone
- 2,4170.04%Native Hawaiian and Other
Pacific Islander alone

Income and house value in District 1, Taneytown
- Median household income in 2022
- $84,317White non-Hispanic householders
- $40,956Black householders
- $128,248Asian householders
- $128,252Some other race householders
- $61,968Two or more races householders
- $80,206Hispanic or Latino race householders
- Median 2022 house value
- $331,010White Non-Hispanic householders
- $347,051Black or African American householders
- $350,107American Indian or Alaska Native householders
- $413,763Asian householders
- $286,451Some other race householders
- $332,538Two or more races householders
- $294,853Hispanic or Latino householders
Household income for White non-Hispanic householders

Household income for Black householders

Household income for American Indian and Alaska Native householders

Household income for Asian householders

Household income for Two or more races householders

Household income for Hispanic or Latino race householders

Zip code: 21787