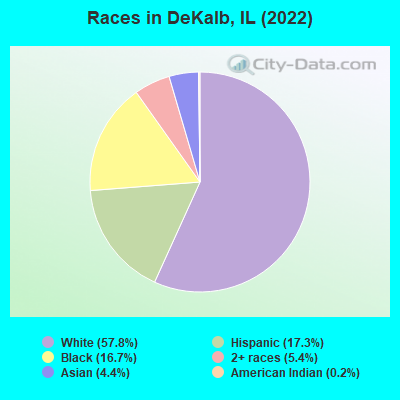
Races in DeKalb, Illinois (IL) Detailed Stats
Data:
Races - White alone (%)
Races - White alone (% change since 2000)
Races - Black alone (%)
Races - Black alone (% change since 2000)
Races - American Indian alone (%)
Races - American Indian alone (% change since 2000)
Races - Asian alone (%)
Races - Asian alone (% change since 2000)
Races - Hispanic (%)
Races - Hispanic (% change since 2000)
Races - Native Hawaiian and Other Pacific Islander alone (%)
Races - Native Hawaiian and Other Pacific Islander alone (% change since 2000)
Races - Two or more races(%)
Races - Two or more races(% change since 2000)
Races - Other race alone (%)
Races - Other race alone (% change since 2000)
Racial diversity
Place of birth - Born in state of residence (%)
Place of birth - Born in state of residence (%) - White
Place of birth - Born in state of residence (%) - Black or African American
Place of birth - Born in state of residence (%) - Asian
Place of birth - Born in state of residence (%) - Hispanic or Latino
Place of birth - Born in state of residence (%) - American Indian and Alaska Native
Place of birth - Born in state of residence (%) - Multirace
Place of birth - Born in state of residence (%) - Other Race
Place of birth - Born in other state (%)
Place of birth - Born in other state (%) - White
Place of birth - Born in other state (%) - Black or African American
Place of birth - Born in other state (%) - Asian
Place of birth - Born in other state (%) - Hispanic or Latino
Place of birth - Born in other state (%) - American Indian and Alaska Native
Place of birth - Born in other state (%) - Multirace
Place of birth - Born in other state (%) - Other Race
Place of birth - Native, outside of US (%)
Place of birth - Native, outside of US (%) - White
Place of birth - Native, outside of US (%) - Black or African American
Place of birth - Native, outside of US (%) - Asian
Place of birth - Native, outside of US (%) - Hispanic or Latino
Place of birth - Native, outside of US (%) - American Indian and Alaska Native
Place of birth - Native, outside of US (%) - Multirace
Place of birth - Native, outside of US (%) - Other Race
Place of birth - Foreign born (%)
Place of birth - Foreign born (%) - White
Place of birth - Foreign born (%) - Black or African American
Place of birth - Foreign born (%) - Asian
Place of birth - Foreign born (%) - Hispanic or Latino
Place of birth - Foreign born (%) - American Indian and Alaska Native
Place of birth - Foreign born (%) - Multirace
Place of birth - Foreign born (%) - Other Race
Residents speaking English at home (%)
Residents speaking English at home - Born in the United States (%)
Residents speaking English at home - Native, born elsewhere (%)
Residents speaking English at home - Foreign born (%)
Residents speaking Spanish at home (%)
Residents speaking Spanish at home - Born in the United States (%)
Residents speaking Spanish at home - Native, born elsewhere (%)
Residents speaking Spanish at home - Foreign born (%)
Residents speaking other language at home (%)
Residents speaking other language at home - Born in the United States (%)
Residents speaking other language at home - Native, born elsewhere (%)
Residents speaking other language at home - Foreign born (%)
Marital status - Never married (%)
Marital status - Now married (%)
Marital status - Separated (%)
Marital status - Widowed (%)
Marital status - Divorced (%)
Ancestries Reported - Arab (%)
Ancestries Reported - Czech (%)
Ancestries Reported - Danish (%)
Ancestries Reported - Dutch (%)
Ancestries Reported - English (%)
Ancestries Reported - French (%)
Ancestries Reported - French Canadian (%)
Ancestries Reported - German (%)
Ancestries Reported - Greek (%)
Ancestries Reported - Hungarian (%)
Ancestries Reported - Irish (%)
Ancestries Reported - Italian (%)
Ancestries Reported - Lithuanian (%)
Ancestries Reported - Norwegian (%)
Ancestries Reported - Polish (%)
Ancestries Reported - Portuguese (%)
Ancestries Reported - Russian (%)
Ancestries Reported - Scotch-Irish (%)
Ancestries Reported - Scottish (%)
Ancestries Reported - Slovak (%)
Ancestries Reported - Subsaharan African (%)
Ancestries Reported - Swedish (%)
Ancestries Reported - Swiss (%)
Ancestries Reported - Ukrainian (%)
Ancestries Reported - United States (%)
Ancestries Reported - Welsh (%)
Ancestries Reported - West Indian (%)
Ancestries Reported - Other (%)
Geographical mobility - Same house 1 year ago (%)
Geographical mobility - Same house 1 year ago (%) - White
Geographical mobility - Same house 1 year ago (%) - Black or African American
Geographical mobility - Same house 1 year ago (%) - Asian
Geographical mobility - Same house 1 year ago (%) - Hispanic or Latino
Geographical mobility - Same house 1 year ago (%) - American Indian and Alaska Native
Geographical mobility - Same house 1 year ago (%) - Multirace
Geographical mobility - Same house 1 year ago (%) - Other Race
Geographical mobility - Moved within same county (%)
Geographical mobility - Moved within same county (%) - White
Geographical mobility - Moved within same county (%) - Black or African American
Geographical mobility - Moved within same county (%) - Asian
Geographical mobility - Moved within same county (%) - Hispanic or Latino
Geographical mobility - Moved within same county (%) - American Indian and Alaska Native
Geographical mobility - Moved within same county (%) - Multirace
Geographical mobility - Moved within same county (%) - Other Race
Geographical mobility - Moved from different county within same state (%)
Geographical mobility - Moved from different county within same state (%) - White
Geographical mobility - Moved from different county within same state (%) - Black or African American
Geographical mobility - Moved from different county within same state (%) - Asian
Geographical mobility - Moved from different county within same state (%) - Hispanic or Latino
Geographical mobility - Moved from different county within same state (%) - American Indian and Alaska Native
Geographical mobility - Moved from different county within same state (%) - Multirace
Geographical mobility - Moved from different county within same state (%) - Other Race
Geographical mobility - Moved from different state (%)
Geographical mobility - Moved from different state (%) - White
Geographical mobility - Moved from different state (%) - Black or African American
Geographical mobility - Moved from different state (%) - Asian
Geographical mobility - Moved from different state (%) - Hispanic or Latino
Geographical mobility - Moved from different state (%) - American Indian and Alaska Native
Geographical mobility - Moved from different state (%) - Multirace
Geographical mobility - Moved from different state (%) - Other Race
Geographical mobility - Moved from abroad (%)
Geographical mobility - Moved from abroad (%) - White
Geographical mobility - Moved from abroad (%) - Black or African American
Geographical mobility - Moved from abroad (%) - Asian
Geographical mobility - Moved from abroad (%) - Hispanic or Latino
Geographical mobility - Moved from abroad (%) - American Indian and Alaska Native
Geographical mobility - Moved from abroad (%) - Multirace
Geographical mobility - Moved from abroad (%) - Other Race
Place of birth for the foreign-born population - Ireland (%)
Place of birth for the foreign-born population - Denmark (%)
Place of birth for the foreign-born population - Norway (%)
Place of birth for the foreign-born population - Sweden (%)
Place of birth for the foreign-born population - United Kingdom (%)
Place of birth for the foreign-born population - England (%)
Place of birth for the foreign-born population - Scotland (%)
Place of birth for the foreign-born population - Other Northern Europe (%)
Place of birth for the foreign-born population - Austria (%)
Place of birth for the foreign-born population - Belgium (%)
Place of birth for the foreign-born population - France (%)
Place of birth for the foreign-born population - Germany (%)
Place of birth for the foreign-born population - Netherlands (%)
Place of birth for the foreign-born population - Switzerland (%)
Place of birth for the foreign-born population - Other Western Europe (%)
Place of birth for the foreign-born population - Greece (%)
Place of birth for the foreign-born population - Italy (%)
Place of birth for the foreign-born population - Portugal (%)
Place of birth for the foreign-born population - Spain (%)
Place of birth for the foreign-born population - Other Southern Europe (%)
Place of birth for the foreign-born population - Albania (%)
Place of birth for the foreign-born population - Belarus (%)
Place of birth for the foreign-born population - Bosnia and Herzegovina (%)
Place of birth for the foreign-born population - Bulgaria (%)
Place of birth for the foreign-born population - Croatia (%)
Place of birth for the foreign-born population - Czechoslovakia (%)
Place of birth for the foreign-born population - Hungary (%)
Place of birth for the foreign-born population - Latvia (%)
Place of birth for the foreign-born population - Lithuania (%)
Place of birth for the foreign-born population - North Macedonia (Macedonia) (%)
Place of birth for the foreign-born population - Moldova (%)
Place of birth for the foreign-born population - Poland (%)
Place of birth for the foreign-born population - Romania (%)
Place of birth for the foreign-born population - Russia (%)
Place of birth for the foreign-born population - Serbia (%)
Place of birth for the foreign-born population - Ukraine (%)
Place of birth for the foreign-born population - Other Eastern Europe (%)
Place of birth for the foreign-born population - China (%)
Place of birth for the foreign-born population - Hong Kong (%)
Place of birth for the foreign-born population - Taiwan (%)
Place of birth for the foreign-born population - Japan (%)
Place of birth for the foreign-born population - Korea (%)
Place of birth for the foreign-born population - Other Eastern Asia (%)
Place of birth for the foreign-born population - Afghanistan (%)
Place of birth for the foreign-born population - Bangladesh (%)
Place of birth for the foreign-born population - India (%)
Place of birth for the foreign-born population - Iran (%)
Place of birth for the foreign-born population - Kazakhstan (%)
Place of birth for the foreign-born population - Nepal (%)
Place of birth for the foreign-born population - Pakistan (%)
Place of birth for the foreign-born population - Sri Lanka (%)
Place of birth for the foreign-born population - Uzbekistan (%)
Place of birth for the foreign-born population - Other South Central Asia (%)
Place of birth for the foreign-born population - Burma (%)
Place of birth for the foreign-born population - Cambodia (%)
Place of birth for the foreign-born population - Indonesia (%)
Place of birth for the foreign-born population - Laos (%)
Place of birth for the foreign-born population - Malaysia (%)
Place of birth for the foreign-born population - Philippines (%)
Place of birth for the foreign-born population - Singapore (%)
Place of birth for the foreign-born population - Thailand (%)
Place of birth for the foreign-born population - Vietnam (%)
Place of birth for the foreign-born population - Other South Eastern Asia (%)
Place of birth for the foreign-born population - Armenia (%)
Place of birth for the foreign-born population - Iraq (%)
Place of birth for the foreign-born population - Israel (%)
Place of birth for the foreign-born population - Jordan (%)
Place of birth for the foreign-born population - Kuwait (%)
Place of birth for the foreign-born population - Lebanon (%)
Place of birth for the foreign-born population - Saudi Arabia (%)
Place of birth for the foreign-born population - Syria (%)
Place of birth for the foreign-born population - Turkey (%)
Place of birth for the foreign-born population - Yemen (%)
Place of birth for the foreign-born population - Other Western Asia (%)
Place of birth for the foreign-born population - Eritrea (%)
Place of birth for the foreign-born population - Ethiopia (%)
Place of birth for the foreign-born population - Kenya (%)
Place of birth for the foreign-born population - Somalia (%)
Place of birth for the foreign-born population - Uganda (%)
Place of birth for the foreign-born population - Zimbabwe (%)
Place of birth for the foreign-born population - Other Eastern Africa (%)
Place of birth for the foreign-born population - Cameroon (%)
Place of birth for the foreign-born population - Congo (%)
Place of birth for the foreign-born population - Democratic Republic of Congo (Zaire) (%)
Place of birth for the foreign-born population - Other Middle Africa (%)
Place of birth for the foreign-born population - Egypt (%)
Place of birth for the foreign-born population - Morocco (%)
Place of birth for the foreign-born population - Sudan (%)
Place of birth for the foreign-born population - Other Northern Africa (%)
Place of birth for the foreign-born population - South Africa (%)
Place of birth for the foreign-born population - Other Southern Africa (%)
Place of birth for the foreign-born population - Cabo Verde (%)
Place of birth for the foreign-born population - Ghana (%)
Place of birth for the foreign-born population - Liberia (%)
Place of birth for the foreign-born population - Nigeria (%)
Place of birth for the foreign-born population - Senegal (%)
Place of birth for the foreign-born population - Sierra Leone (%)
Place of birth for the foreign-born population - Other Western Africa (%)
Place of birth for the foreign-born population - Australia (%)
Place of birth for the foreign-born population - New Zealand (%)
Place of birth for the foreign-born population - Fiji (%)
Place of birth for the foreign-born population - Micronesia (%)
Place of birth for the foreign-born population - Bahamas (%)
Place of birth for the foreign-born population - Barbados (%)
Place of birth for the foreign-born population - Cuba (%)
Place of birth for the foreign-born population - Dominica (%)
Place of birth for the foreign-born population - Dominican Republic (%)
Place of birth for the foreign-born population - Grenada (%)
Place of birth for the foreign-born population - Haiti (%)
Place of birth for the foreign-born population - Jamaica (%)
Place of birth for the foreign-born population - St. Vincent and the Grenadines (%)
Place of birth for the foreign-born population - Trinidad and Tobago (%)
Place of birth for the foreign-born population - West Indies (%)
Place of birth for the foreign-born population - Other Caribbean (%)
Place of birth for the foreign-born population - Belize (%)
Place of birth for the foreign-born population - Costa Rica (%)
Place of birth for the foreign-born population - El Salvador (%)
Place of birth for the foreign-born population - Guatemala (%)
Place of birth for the foreign-born population - Honduras (%)
Place of birth for the foreign-born population - Mexico (%)
Place of birth for the foreign-born population - Nicaragua (%)
Place of birth for the foreign-born population - Panama (%)
Place of birth for the foreign-born population - Other Central America (%)
Place of birth for the foreign-born population - Argentina (%)
Place of birth for the foreign-born population - Bolivia (%)
Place of birth for the foreign-born population - Brazil (%)
Place of birth for the foreign-born population - Chile (%)
Place of birth for the foreign-born population - Colombia (%)
Place of birth for the foreign-born population - Ecuador (%)
Place of birth for the foreign-born population - Guyana (%)
Place of birth for the foreign-born population - Peru (%)
Place of birth for the foreign-born population - Uruguay (%)
Place of birth for the foreign-born population - Venezuela (%)
Place of birth for the foreign-born population - Other South America (%)
Place of birth for the foreign-born population - Canada (%)
Place of birth for the foreign-born population - Other Northern America (%)
Place of birth for the foreign-born population - Other (%)
Latest news about races in DeKalb, IL collected exclusively by city-data.com from local newspapers, TV, and radio stations
According to 2022 data, the most numerous races in DeKalb, IL are White alone (23,426 residents), Hispanic (7,020 residents), and Black alone (6,754 residents). 82.0% of DeKalb residents speak English at home. 10.1% of DeKalb, IL residents are foreign-born (4.2% born in Latin America, 4.1% born in Asia, 1.1% born in Africa), which is 38.7% less than the foreign-born rate of 14.0% across the entire state of Illinois.
Race distribution in DeKalb
2000 2022
8,424,140 67.8% White alone 1,856,152 14.9% Black alone 1,530,262 12.3% Hispanic 419,916 3.4% Asian alone 153,996 1.2% Two or more races 13,479 0.1% Other race alone 18,232 0.1% American Indian alone 3,116 0.03% Native Hawaiian and Other
7,356,301 58.5% White alone 2,299,726 18.3% Hispanic 1,660,423 13.2% Black alone 747,296 5.9% Asian alone 458,599 3.6% Two or more races 45,386 0.4% Other race alone 10,405 0.08% American Indian alone 3,896 0.03% Native Hawaiian and Other
Income and house value in DeKalb Median household income in 2022 $55,268 White non-Hispanic householders$21,704 Black householders$16,157 Asian householders$52,415 Some other race householders$24,099 Two or more races householders$36,377 Hispanic or Latino race householdersMedian 2022 house value $205,631 White Non-Hispanic householders$234,736 Black or African American householders $263,366 Asian householders$43,499 Native Hawaiian and other Pacific Islander householders$164,505 Some other race householders$217,495 Two or more races householders$161,658 Hispanic or Latino householders
Median age by race in DeKalb
28.4 Median age for White residents28.2 30.1 20.4 Median age for Black or African American residents16.6 25.6 47.4 Median age for American Indian / Alaska Native residents6.4 34.3 30.9 Median age for Asian residents37.2 11.0 -593,236,714.4 Median age for Native Hawaiian / Pacific Islander residents-666,666,666.0 -666,666,666.0 32.7 Median age for Other race residents34.7 27.5 21.1 Median age for Two or more races residents20.4 23.8 29.4 Median age for White alone residents28.2 31.8 21.8 Median age for Hispanic or Latino residents20.7 24.8
Owner/renter occupied households by race in DeKalb
House owners and renters - White residents 5,779 54.6% Owner occupied4,814 45.4% Renter occupiedHouse owners and renters - Black or African American residents 257 11.7% Owner occupied1,943 88.3% Renter occupiedHouse owners and renters - American Indian / Alaska Native residents 95 73.2% Owner occupied35 26.8% Renter occupiedHouse owners and renters - Asian residents 160 19.3% Owner occupied668 80.7% Renter occupiedHouse owners and renters - Other race residents 268 40.9% Owner occupied386 59.1% Renter occupiedHouse owners and renters - Two or more races residents 661 40.0% Owner occupied990 60.0% Renter occupiedHouse owners and renters - White alone residents 5,477 53.7% Owner occupied4,721 46.3% Renter occupiedHouse owners and renters - Hispanic or Latino residents 895 43.1% Owner occupied1,181 56.9% Renter occupied
Language usage in DeKalb
English speakers - Total 82.0% of residents of DeKalb speak English at home.
9.1% of residents speak Spanish at home 2,200 62.1% Speak English very well1,340 37.9% Speak English less than very well8.3% of residents speak other language at home 2,745 85.2% Speak English very well476 14.8% Speak English less than very well
English speakers - Born in the United States 92.6% of residents of DeKalb speak English at home.
3.6% of residents speak Spanish at home 197 85.3% Speak English very well34 14.7% Speak English less than very well1.7% of residents speak other language at home 105 93.8% Speak English very well7 6.2% Speak English less than very well
English speakers - Native, born elsewhere 67.6% of residents of DeKalb speak English at home.
89.4% of residents speak Spanish at home 170 56.1% Speak English very well133 43.9% Speak English less than very well53.7% of residents speak other language at home 182 100.0% Speak English very well
English speakers - Foreign-born 15.2% of residents of DeKalb speak English at home.
32.7% of residents speak Spanish at home 300 24.9% Speak English very well903 75.1% Speak English less than very well49.0% of residents speak other language at home 1,382 76.7% Speak English very well421 23.3% Speak English less than very well
White (Caucasian) - Speak only English Native:
94.5% (22,380)Foreign-born:
7.6% (24)
White (Caucasian) - Speak another language Native:
4.3% (1,023)Foreign-born:
92.4% (296)
Black or African American - Speak only English Native:
98.8% (4,588)Foreign-born:
9.4% (39)
Black or African American - Speak another language Native:
1.2% (57)Foreign-born:
87.1% (357)
American Indian / Alaska Native - Speak only English Native:
58.2% (112)Foreign-born:
41.7% (129)
American Indian / Alaska Native - Speak another language Native:
36.3% (70)Foreign-born:
42.5% (132)
Asian - Speak only English Native:
61.8% (393)Foreign-born:
5.6% (78)
Asian - Speak another language Native:
38.0% (242)Foreign-born:
95.3% (1,314)
Other race - Speak only English Native:
10.4% (151)Foreign-born:
2.0% (14)
Other race - Speak another language Native:
92.5% (1,336)Foreign-born:
97.5% (651)
Two or more races - Speak only English Native:
83.9% (3,724)Foreign-born:
6.8% (75)
Two or more races - Speak another language Native:
15.6% (694)Foreign-born:
74.2% (822)
White alone - Speak only English Native:
96.6% (21,578)Foreign-born:
11.9% (47)
White alone - Speak another language Native:
3.4% (757)Foreign-born:
88.8% (351)
Hispanic or Latino - Speak only English Native:
53.0% (2,828)Foreign-born:
17.6% (257)
Hispanic or Latino - Speak another language Native:
44.1% (2,356)Foreign-born:
85.0% (1,239)
Foreign-born residents in DeKalb 4,090 residents are foreign born (4.2% Latin America , 4.1% Asia , 1.1% Africa ).
This city:
10.1%Illinois:
14.1%
Marital status for residents in DeKalb Marital status - White (Caucasian) population 15 years and over
Males 58.7% Never married31.9% Now married0.4% Separated2.4% Widowed6.6% DivorcedFemales 46.4% Never married33.2% Now married0.3% Separated9.9% Widowed10.2% DivorcedWomen who gave birth in the past 12 months Now married:
61.5% (76)Unmarried:
38.5% (48)
Women who did not give birth in the past 12 months Now married:
26.0% (1,781)Unmarried:
74.0% (5,075)
Marital status - Black or African American population 15 years and over
Males 69.8% Never married29.5% Now married0.0% Separated0.0% Widowed0.7% DivorcedFemales 83.1% Never married11.5% Now married0.5% Separated2.7% Widowed2.3% DivorcedWomen who gave birth in the past 12 months Now married:
9.1% (21)Unmarried:
90.9% (208)
Women who did not give birth in the past 12 months Now married:
9.9% (172)Unmarried:
90.1% (1,562)
Marital status - American Indian / Alaska Native population 15 years and over
Males 22.1% Never married77.9% Now married0.0% Separated0.0% Widowed0.0% DivorcedFemales 65.6% Never married34.4% Now married0.0% Separated0.0% Widowed0.0% DivorcedWomen who did not give birth in the past 12 months Now married:
34.4% (92)Unmarried:
65.6% (175)
Marital status - Asian population 15 years and over
Males 72.6% Never married20.8% Now married0.3% Separated0.0% Widowed6.3% DivorcedFemales 55.9% Never married40.9% Now married0.0% Separated3.2% Widowed0.0% DivorcedWomen who gave birth in the past 12 months Now married:
0.0% (0)Unmarried:
100.0% (28)
Women who did not give birth in the past 12 months Now married:
35.1% (259)Unmarried:
64.9% (478)
Marital status - Other race population 15 years and over
Males 48.4% Never married26.0% Now married10.5% Separated1.1% Widowed14.1% DivorcedFemales 65.1% Never married16.9% Now married8.9% Separated0.0% Widowed9.1% DivorcedWomen who gave birth in the past 12 months Now married:
38.3% (36)Unmarried:
61.7% (58)
Women who did not give birth in the past 12 months Now married:
13.3% (108)Unmarried:
86.7% (706)
Marital status - Two or more races population 15 years and over
Males 67.5% Never married30.6% Now married0.0% Separated0.0% Widowed2.0% DivorcedFemales 64.0% Never married16.3% Now married1.6% Separated0.0% Widowed18.1% DivorcedWomen who gave birth in the past 12 months Now married:
100.0% (9)Unmarried:
0.0% (0)
Women who did not give birth in the past 12 months Now married:
10.8% (190)Unmarried:
89.2% (1,570)
Marital status - White alone, not Hispanic / Latino population 15 years and over
Males 58.2% Never married31.5% Now married0.5% Separated2.6% Widowed7.3% DivorcedFemales 45.3% Never married33.1% Now married0.3% Separated10.5% Widowed10.8% DivorcedWomen who gave birth in the past 12 months Now married:
61.5% (79)Unmarried:
38.5% (50)
Women who did not give birth in the past 12 months Now married:
25.1% (1,605)Unmarried:
74.9% (4,801)
Marital status - Hispanic or Latino population 15 years and over
Males 57.9% Never married33.1% Now married3.3% Separated0.3% Widowed5.4% DivorcedFemales 59.9% Never married25.3% Now married3.3% Separated0.8% Widowed10.6% DivorcedWomen who gave birth in the past 12 months Now married:
0.0% (0)Unmarried:
100.0% (56)
Women who did not give birth in the past 12 months Now married:
21.9% (519)Unmarried:
78.1% (1,850)
Ancestries in DeKalb
1,470 8.7% Irish1,315 7.8% German1,207 7.1% English449 2.7% Italian427 2.5% American371 2.2% Norwegian353 2.1% Swedish347 2.1% European311 1.8% Polish303 1.8% Palestinian302 1.8% Nigerian206 1.2% African132 0.8% Greek125 0.7% French124 0.7% Scottish106 0.6% Ukrainian81 0.5% Russian76 0.4% Czech74 0.4% Somali64 0.4% Haitian56 0.3% British53 0.3% Iranian47 0.3% Serbian37 0.2% Sudanese36 0.2% Estonian36 0.2% Jamaican32 0.2% Jordanian26 0.2% Dutch26 0.2% Finnish25 0.1% Scotch-Irish24 0.1% Scandinavian19 0.1% Croatian17 0.1% French Canadian14 0.08% Austrian12 0.07% Slovak11 0.07% Ethiopian11 0.07% South African10 0.06% Hungarian10 0.06% Northern European7 0.04% Lithuanian5 0.03% Turkish5 0.03% Egyptian4 0.02% Albanian3 0.02% Yugoslavian2 0.01% Czechoslovakian
Geographical mobility in DeKalb Same house 1 year ago 18,398 75.0% White (Caucasian)5,338 80.0% Black or African American430 81.0% American Indian / Alaska Native1,474 81.6% Asian1,893 75.2% Other race4,693 78.7% Two or more races17,399 74.8% White alone, not Hispanic / Latino4,773 68.6% Hispanic or LatinoMoved within same county 2,507 10.2% White / Caucasian466 7.0% Black or African American102 19.2% American Indian / Alaska Native194 10.7% Asian366 14.6% Other race838 14.1% Two or more races2,356 10.1% White alone, not Hispanic / Latino1,972 28.3% Hispanic or LatinoMoved within same state 2,746 11.2% White / Caucasian827 12.4% Black or African American104 5.8% Asian155 6.1% Other race107 1.8% Two or more races2,562 11.0% White alone, not Hispanic / Latino376 5.4% Hispanic or LatinoMoved from different state 613 2.5% White / Caucasian51 0.8% Black or African American12 0.5% Other race156 2.6% Two or more races607 2.6% White alone, not Hispanic / Latino91 1.3% Hispanic or LatinoMoved from abroad 278 1.1% White8 0.1% Black or African American598 33.1% Asian75 3.0% Other race77 0.3% White alone, not Hispanic / Latino114 1.6% Hispanic or Latino
Children Nativity (place of birth) in DeKalb
Children under 6 years - Living with two parents Both parents native 798 100.0% NativeBoth parents foreign-born 169 89.1% Native21 10.9% Foreign-bornOne native, one foreign-born parent 38 100.0% NativeChildren under 6 years - Living with one parent Native parent 1,045 100.0% NativeForeign-born parent 104 100.0% NativeChildren 6 to 17 years - Living with two parents Both parents native 2,141 100.0% Native1 0.0% Foreign-bornBoth parents foreign-born 200 100.0% NativeOne native, one foreign-born parent 178 100.0% NativeChildren 6 to 17 years - Living with one parent Native parent 1,965 100.0% NativeForeign-born parent 315 57.2% Native236 42.8% Foreign-born
Grandparents responsible for own grandchildren in DeKalb
Grandparents (30 to 59 years) White / Caucasian 28 92.1% Responsible for grandchildren2 7.9% Not responsible for grandchildrenWhite alone, not Hispanic / Latino 31 91.3% Responsible for grandchildren3 8.7% Not responsible for grandchildrenGrandparents (60 years and over) White / Caucasian 50 31.4% Responsible for grandchildren110 68.6% Not responsible for grandchildrenWhite alone, not Hispanic / Latino 54 32.5% Responsible for grandchildren113 67.5% Not responsible for grandchildren