Races in Davidson, North Carolina (NC) Detailed Stats
Ancestries, Foreign-born residents, place of birth
Settings
X


Recent posts about races in Davidson, North Carolina on our local forum with over 2,400,000 registered users:

Latest news about races in Davidson, NC collected exclusively by city-data.com from local newspapers, TV, and radio stations
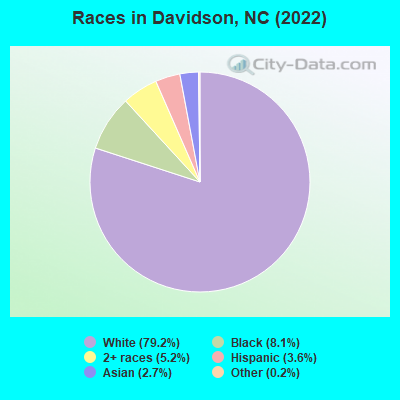
According to 2022 data, the most numerous races in Davidson, NC are White alone (12,353 residents), Black alone (1,270 residents), and Hispanic (557 residents). 94.9% of Davidson residents speak English at home. 5.9% of Davidson, NC residents are foreign-born (2.1% born in Asia, 1.5% born in Europe, 1.4% born in Latin America), which is 34.6% less than the foreign-born rate of 8.0% across the entire state of North Carolina.
Race distribution in Davidson
2000
2022

- 6,23487.3%White alone
- 5798.1%Black alone
- 1632.3%Hispanic
- 921.3%Asian alone
- 500.7%Two or more races
- 110.2%American Indian alone
- 60.08%Other race alone
- 40.06%Native Hawaiian and Other
Pacific Islander alone

-
- 12,35379.2%White alone
- 1,2708.1%Black alone
- 8095.2%Two or more races
- 5573.6%Hispanic
- 4272.7%Asian alone
- 280.2%Other race alone
- 60.04%Native Hawaiian and Other
Pacific Islander alone
2000
2022
-
- 5,647,15570.2%White alone
- 1,723,30121.4%Black alone
- 378,9634.7%Hispanic
- 112,4161.4%Asian alone
- 95,3331.2%American Indian alone
- 79,9651.0%Two or more races
- 9,0150.1%Other race alone
- 3,1650.04%Native Hawaiian and Other
Pacific Islander alone

-
- 6,497,51960.7%White alone
- 2,155,65020.1%Black alone
- 1,114,79910.4%Hispanic
- 438,0614.1%Two or more races
- 341,0523.2%Asian alone
- 91,7580.9%American Indian alone
- 50,1800.5%Other race alone
- 9,9540.09%Native Hawaiian and Other
Pacific Islander alone

Income and house value in Davidson
- Median household income in 2022
- $153,290White non-Hispanic householders
- over $200,000Asian householders
- $174,870Two or more races householders
- Median 2022 house value
- $801,610White Non-Hispanic householders
- $215,883Black or African American householders
- $985,125American Indian or Alaska Native householders
- $985,125Asian householders
- $434,018Some other race householders
- $28,143Two or more races householders
- $510,295Hispanic or Latino householders
Household income for White non-Hispanic householders

Household income for Black householders

Household income for Asian householders

Household income for Two or more races householders

Household income for Hispanic or Latino race householders

Median age by race in Davidson
- 44.2Median age for White residents
- 46.0Males
- 42.9Females
- 20.5Median age for Black or African American residents
- 19.6Males
- 38.7Females
- -623,853,210.4Median age for American Indian / Alaska Native residents
- -596,273,291.3Males
- -775,147,928.2Females
- 38.9Median age for Asian residents
- 36.7Males
- 39.3Females
- -865,497,075.2Median age for Native Hawaiian / Pacific Islander residents
- -706,616,728.4Males
- -668,458,780.7Females
- 32.6Median age for Other race residents
- 63.9Males
- -641,414,140.8Females
- 20.7Median age for Two or more races residents
- 21.1Males
- 20.5Females
- 45.0Median age for White alone residents
- 46.7Males
- 42.9Females
- 22.8Median age for Hispanic or Latino residents
- 35.8Males
- 19.7Females
Owner/renter occupied households by race in Davidson
- House owners and renters - White residents
- 3,77678.7%Owner occupied
- 1,01921.3%Renter occupied
- House owners and renters - Black or African American residents
- 23855.8%Owner occupied
- 18944.2%Renter occupied
- House owners and renters - Asian residents
- 77100.0%Owner occupied
- House owners and renters - Other race residents
- 5100.0%Owner occupied
- House owners and renters - Two or more races residents
- 22061.8%Owner occupied
- 13638.2%Renter occupied
- House owners and renters - White alone residents
- 3,81778.7%Owner occupied
- 1,03221.3%Renter occupied
- House owners and renters - Hispanic or Latino residents
- 4027.1%Owner occupied
- 10872.9%Renter occupied
Language usage in Davidson
- English speakers - Total
- 94.9% of residents of Davidson speak English at home.
- 1.9% of residents speak Spanish at home
- 15553.4%Speak English very well
- 13546.6%Speak English less than very well
- 3.3% of residents speak other language at home
- 38977.8%Speak English very well
- 11122.2%Speak English less than very well
- English speakers - Born in the United States
- 98.2% of residents of Davidson speak English at home.
- 0.8% of residents speak Spanish at home
- 5160.0%Speak English very well
- 3440.0%Speak English less than very well
- 1.2% of residents speak other language at home
- 12597.7%Speak English very well
- 32.3%Speak English less than very well
All residents speak only English at home
- English speakers - Foreign-born
- 43.4% of residents of Davidson speak English at home.
- 17.5% of residents speak Spanish at home
- 4629.7%Speak English very well
- 10970.3%Speak English less than very well
- 39.0% of residents speak other language at home
- 25072.5%Speak English very well
- 9527.5%Speak English less than very well
White (Caucasian) - Speak only English
| Native: | 99.7% (11,744) |
| Foreign-born: | 86.6% (224) |
White (Caucasian) - Speak another language
| Native: | 1.0% (123) |
| Foreign-born: | 28.0% (73) |
Black or African American - Speak only English
| Native: | 99.7% (1,249) |
| Foreign-born: | 57.4% (21) |
Black or African American - Speak another language
| Native: | 0.3% (3) |
| Foreign-born: | 44.1% (16) |
Asian - Speak only English
| Native: | 47.3% (80) |
| Foreign-born: | 24.6% (66) |
Asian - Speak another language
| Native: | 53.1% (90) |
| Foreign-born: | 75.7% (203) |
Two or more races - Speak only English
| Native: | 94.4% (771) |
| Foreign-born: | 16.4% (37) |
Two or more races - Speak another language
| Native: | 4.2% (34) |
| Foreign-born: | 83.8% (186) |
White alone - Speak only English
| Native: | 98.6% (11,589) |
| Foreign-born: | 70.1% (234) |
White alone - Speak another language
| Native: | 1.1% (133) |
| Foreign-born: | 23.1% (77) |
Hispanic or Latino - Speak only English
| Native: | 95.8% (378) |
| Foreign-born: | 2.1% (4) |
Hispanic or Latino - Speak another language
| Native: | 19.7% (78) |
| Foreign-born: | 98.0% (173) |
Foreign-born residents in Davidson
928 residents are foreign born (2.1% Asia, 1.5% Europe, 1.4% Latin America).
| This city: | 5.9% |
| North Carolina: | 8.3% |


Marital status for residents in Davidson
Marital status - White (Caucasian) population 15 years and over
- Males
- 25.6%Never married
- 65.3%Now married
- 1.4%Separated
- 0.5%Widowed
- 7.3%Divorced
- Females
- 28.9%Never married
- 54.8%Now married
- 0.5%Separated
- 5.1%Widowed
- 10.6%Divorced
Women who gave birth in the past 12 months
| Now married: | 100.0% (42) |
| Unmarried: | 0.0% (0) |
Women who did not give birth in the past 12 months
| Now married: | 46.3% (1,324) |
| Unmarried: | 53.7% (1,535) |
Marital status - Black or African American population 15 years and over
- Males
- 82.4%Never married
- 16.3%Now married
- 1.3%Separated
- 0.0%Widowed
- 0.0%Divorced
- Females
- 56.7%Never married
- 11.3%Now married
- 0.0%Separated
- 2.2%Widowed
- 29.9%Divorced
Women who did not give birth in the past 12 months
| Now married: | 16.8% (65) |
| Unmarried: | 83.2% (322) |
Marital status - Asian population 15 years and over
- Males
- 49.1%Never married
- 50.9%Now married
- 0.0%Separated
- 0.0%Widowed
- 0.0%Divorced
- Females
- 36.4%Never married
- 53.2%Now married
- 0.0%Separated
- 10.4%Widowed
- 0.0%Divorced
Women who did not give birth in the past 12 months
| Now married: | 57.3% (127) |
| Unmarried: | 42.7% (95) |
Marital status - Other race population 15 years and over
- Males
- 32.0%Never married
- 68.0%Now married
- 0.0%Separated
- 0.0%Widowed
- 0.0%Divorced
- Females
- 0.0%Never married
- 0.0%Now married
- 0.0%Separated
- 0.0%Widowed
- 100.0%Divorced
Women who did not give birth in the past 12 months
| Now married: | 0.0% (0) |
| Unmarried: | 100.0% (17) |
Marital status - Two or more races population 15 years and over
- Males
- 63.4%Never married
- 33.2%Now married
- 0.0%Separated
- 0.0%Widowed
- 3.4%Divorced
- Females
- 52.0%Never married
- 21.4%Now married
- 10.1%Separated
- 0.0%Widowed
- 16.5%Divorced
Women who did not give birth in the past 12 months
| Now married: | 27.0% (100) |
| Unmarried: | 73.0% (270) |
Marital status - White alone, not Hispanic / Latino population 15 years and over
- Males
- 25.7%Never married
- 65.0%Now married
- 1.4%Separated
- 0.5%Widowed
- 7.4%Divorced
- Females
- 28.2%Never married
- 55.2%Now married
- 0.5%Separated
- 5.2%Widowed
- 10.8%Divorced
Women who gave birth in the past 12 months
| Now married: | 100.0% (44) |
| Unmarried: | 0.0% (0) |
Women who did not give birth in the past 12 months
| Now married: | 46.8% (1,367) |
| Unmarried: | 53.2% (1,555) |
Marital status - Hispanic or Latino population 15 years and over
- Males
- 52.7%Never married
- 43.0%Now married
- 0.0%Separated
- 0.0%Widowed
- 4.3%Divorced
- Females
- 56.0%Never married
- 23.8%Now married
- 0.0%Separated
- 0.0%Widowed
- 20.2%Divorced
Women who did not give birth in the past 12 months
| Now married: | 24.8% (33) |
| Unmarried: | 75.2% (99) |
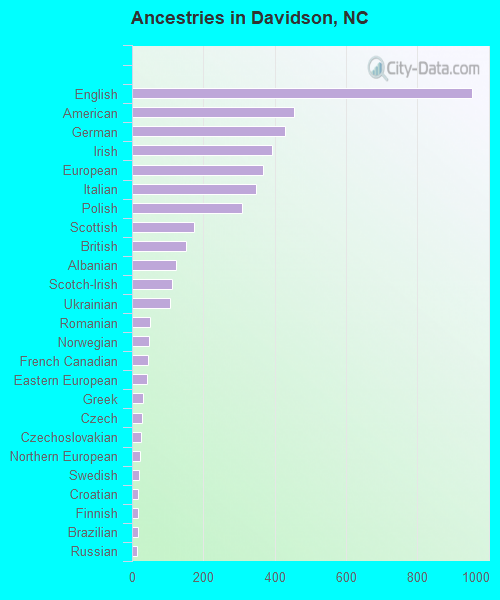
Ancestries in Davidson

- 95314.5%English
- 4556.9%American
- 4296.5%German
- 3936.0%Irish
- 3675.6%European
- 3475.3%Italian
- 3084.7%Polish
- 1742.6%Scottish
- 1502.3%British
- 1221.9%Albanian
- 1111.7%Scotch-Irish
- 1061.6%Ukrainian
- 510.8%Romanian
- 470.7%Norwegian
- 460.7%French Canadian
- 410.6%Eastern European
- 310.5%Greek
- 280.4%Czech
- 250.4%Czechoslovakian
- 220.3%Northern European
- 190.3%Swedish
- 180.3%Croatian
- 180.3%Finnish
- 170.3%Brazilian
- 130.2%Russian
- 100.2%Hungarian
- 90.1%French
- 90.1%Canadian
- 90.1%Barbadian
- 80.1%Lithuanian
- 80.1%Israeli
- 80.1%Trinidadian and Tobagonian
- 80.1%Turkish
- 70.1%Nigerian
- 60.09%Dutch
- 60.09%Austrian
- 60.09%Cape Verdean
- 60.09%Ethiopian
- 60.09%Jamaican
- 60.09%Ghanaian
- 50.08%Ugandan
- 40.06%African
- 20.03%Serbian
- 10.02%South African
Geographical mobility in Davidson

- Same house 1 year ago
- 9,63880.2%White (Caucasian)
- 1,05081.6%Black or African American
- 33878.6%Asian
- 4386.9%Other race
- 98380.6%Two or more races
- 9,83979.9%White alone, not Hispanic / Latino
- 49789.2%Hispanic or Latino

-
- Moved within same county
- 6485.4%White / Caucasian
- 947.3%Black or African American
- 51.2%Asian
- 336.9%Native Hawaiian / Pacific Islander
- 1088.8%Two or more races
- 6965.7%White alone, not Hispanic / Latino
- 51.0%Hispanic or Latino

-
- Moved within same state
- 6345.3%White / Caucasian
- 685.3%Black or African American
- 132.9%Asian
- 332.7%Two or more races
- 6395.2%White alone, not Hispanic / Latino
- 152.6%Hispanic or Latino

-
- Moved from different state
- 1,1499.6%White / Caucasian
- 816.3%Black or African American
- 5011.6%Asian
- 918.2%Other race
- 877.1%Two or more races
- 1,1549.4%White alone, not Hispanic / Latino
- 6311.3%Hispanic or Latino

-
- Moved from abroad
- 320.3%White
- 50.4%Black or African American
- 92.2%Asian
- 20.1%Two or more races
- 460.4%White alone, not Hispanic / Latino

Children Nativity (place of birth) in Davidson
Place of birth for residents in Davidson
![Place of birth for the foreign-born population - Regions]()
- 345Asia
- 272Americas
- 234Europe
- 224Latin America
- 141Eastern Asia
- 132South America
- 123Northern Europe
- 113South Eastern Asia
- 91China
- 86Central America
- 74Eastern Europe
- 47Western Asia
- 47Northern America
- 43South Central Asia
- 40Africa
- 35Oceania
- 35Australia and New Zealand Subregion
- 25Southern Europe
- 24Eastern Africa
- 10Western Europe
- 9Southern Africa
- 6Western Africa
- 6Caribbean

![Place of birth for the foreign-born population - Countries]()
- 91China
- 84Laos
- 81United Kingdom
- 57Venezuela
- 49Korea
- 47Romania
- 47Mexico
- 47Canada
- 42England
- 41India
- 39Guatemala
- 35Australia
- 35Chile
- 34Brazil
- 23Syria
- 20Italy
- 13North Macedonia (Macedonia)
- 12Jordan
- 12Uganda
- 11Turkey
- 10Germany
- 10Vietnam
- 9South Africa
- 6Ethiopia
- 6Ghana
- 6Jamaica
- 5Greece
- 5Tanzania
- 4Colombia
- 2Kazakhstan
- 1Belarus

Zip codes: 28115.