Races in Danville, Illinois (IL) Detailed Stats
Data:
Races - White alone (%)
Races - White alone (% change since 2000)
Races - Black alone (%)
Races - Black alone (% change since 2000)
Races - American Indian alone (%)
Races - American Indian alone (% change since 2000)
Races - Asian alone (%)
Races - Asian alone (% change since 2000)
Races - Hispanic (%)
Races - Hispanic (% change since 2000)
Races - Native Hawaiian and Other Pacific Islander alone (%)
Races - Native Hawaiian and Other Pacific Islander alone (% change since 2000)
Races - Two or more races(%)
Races - Two or more races(% change since 2000)
Races - Other race alone (%)
Races - Other race alone (% change since 2000)
Racial diversity
Place of birth - Born in state of residence (%)
Place of birth - Born in state of residence (%) - White
Place of birth - Born in state of residence (%) - Black or African American
Place of birth - Born in state of residence (%) - Asian
Place of birth - Born in state of residence (%) - Hispanic or Latino
Place of birth - Born in state of residence (%) - American Indian and Alaska Native
Place of birth - Born in state of residence (%) - Multirace
Place of birth - Born in state of residence (%) - Other Race
Place of birth - Born in other state (%)
Place of birth - Born in other state (%) - White
Place of birth - Born in other state (%) - Black or African American
Place of birth - Born in other state (%) - Asian
Place of birth - Born in other state (%) - Hispanic or Latino
Place of birth - Born in other state (%) - American Indian and Alaska Native
Place of birth - Born in other state (%) - Multirace
Place of birth - Born in other state (%) - Other Race
Place of birth - Native, outside of US (%)
Place of birth - Native, outside of US (%) - White
Place of birth - Native, outside of US (%) - Black or African American
Place of birth - Native, outside of US (%) - Asian
Place of birth - Native, outside of US (%) - Hispanic or Latino
Place of birth - Native, outside of US (%) - American Indian and Alaska Native
Place of birth - Native, outside of US (%) - Multirace
Place of birth - Native, outside of US (%) - Other Race
Place of birth - Foreign born (%)
Place of birth - Foreign born (%) - White
Place of birth - Foreign born (%) - Black or African American
Place of birth - Foreign born (%) - Asian
Place of birth - Foreign born (%) - Hispanic or Latino
Place of birth - Foreign born (%) - American Indian and Alaska Native
Place of birth - Foreign born (%) - Multirace
Place of birth - Foreign born (%) - Other Race
Residents speaking English at home (%)
Residents speaking English at home - Born in the United States (%)
Residents speaking English at home - Native, born elsewhere (%)
Residents speaking English at home - Foreign born (%)
Residents speaking Spanish at home (%)
Residents speaking Spanish at home - Born in the United States (%)
Residents speaking Spanish at home - Native, born elsewhere (%)
Residents speaking Spanish at home - Foreign born (%)
Residents speaking other language at home (%)
Residents speaking other language at home - Born in the United States (%)
Residents speaking other language at home - Native, born elsewhere (%)
Residents speaking other language at home - Foreign born (%)
Marital status - Never married (%)
Marital status - Now married (%)
Marital status - Separated (%)
Marital status - Widowed (%)
Marital status - Divorced (%)
Ancestries Reported - Arab (%)
Ancestries Reported - Czech (%)
Ancestries Reported - Danish (%)
Ancestries Reported - Dutch (%)
Ancestries Reported - English (%)
Ancestries Reported - French (%)
Ancestries Reported - French Canadian (%)
Ancestries Reported - German (%)
Ancestries Reported - Greek (%)
Ancestries Reported - Hungarian (%)
Ancestries Reported - Irish (%)
Ancestries Reported - Italian (%)
Ancestries Reported - Lithuanian (%)
Ancestries Reported - Norwegian (%)
Ancestries Reported - Polish (%)
Ancestries Reported - Portuguese (%)
Ancestries Reported - Russian (%)
Ancestries Reported - Scotch-Irish (%)
Ancestries Reported - Scottish (%)
Ancestries Reported - Slovak (%)
Ancestries Reported - Subsaharan African (%)
Ancestries Reported - Swedish (%)
Ancestries Reported - Swiss (%)
Ancestries Reported - Ukrainian (%)
Ancestries Reported - United States (%)
Ancestries Reported - Welsh (%)
Ancestries Reported - West Indian (%)
Ancestries Reported - Other (%)
Geographical mobility - Same house 1 year ago (%)
Geographical mobility - Same house 1 year ago (%) - White
Geographical mobility - Same house 1 year ago (%) - Black or African American
Geographical mobility - Same house 1 year ago (%) - Asian
Geographical mobility - Same house 1 year ago (%) - Hispanic or Latino
Geographical mobility - Same house 1 year ago (%) - American Indian and Alaska Native
Geographical mobility - Same house 1 year ago (%) - Multirace
Geographical mobility - Same house 1 year ago (%) - Other Race
Geographical mobility - Moved within same county (%)
Geographical mobility - Moved within same county (%) - White
Geographical mobility - Moved within same county (%) - Black or African American
Geographical mobility - Moved within same county (%) - Asian
Geographical mobility - Moved within same county (%) - Hispanic or Latino
Geographical mobility - Moved within same county (%) - American Indian and Alaska Native
Geographical mobility - Moved within same county (%) - Multirace
Geographical mobility - Moved within same county (%) - Other Race
Geographical mobility - Moved from different county within same state (%)
Geographical mobility - Moved from different county within same state (%) - White
Geographical mobility - Moved from different county within same state (%) - Black or African American
Geographical mobility - Moved from different county within same state (%) - Asian
Geographical mobility - Moved from different county within same state (%) - Hispanic or Latino
Geographical mobility - Moved from different county within same state (%) - American Indian and Alaska Native
Geographical mobility - Moved from different county within same state (%) - Multirace
Geographical mobility - Moved from different county within same state (%) - Other Race
Geographical mobility - Moved from different state (%)
Geographical mobility - Moved from different state (%) - White
Geographical mobility - Moved from different state (%) - Black or African American
Geographical mobility - Moved from different state (%) - Asian
Geographical mobility - Moved from different state (%) - Hispanic or Latino
Geographical mobility - Moved from different state (%) - American Indian and Alaska Native
Geographical mobility - Moved from different state (%) - Multirace
Geographical mobility - Moved from different state (%) - Other Race
Geographical mobility - Moved from abroad (%)
Geographical mobility - Moved from abroad (%) - White
Geographical mobility - Moved from abroad (%) - Black or African American
Geographical mobility - Moved from abroad (%) - Asian
Geographical mobility - Moved from abroad (%) - Hispanic or Latino
Geographical mobility - Moved from abroad (%) - American Indian and Alaska Native
Geographical mobility - Moved from abroad (%) - Multirace
Geographical mobility - Moved from abroad (%) - Other Race
Place of birth for the foreign-born population - Ireland (%)
Place of birth for the foreign-born population - Denmark (%)
Place of birth for the foreign-born population - Norway (%)
Place of birth for the foreign-born population - Sweden (%)
Place of birth for the foreign-born population - United Kingdom (%)
Place of birth for the foreign-born population - England (%)
Place of birth for the foreign-born population - Scotland (%)
Place of birth for the foreign-born population - Other Northern Europe (%)
Place of birth for the foreign-born population - Austria (%)
Place of birth for the foreign-born population - Belgium (%)
Place of birth for the foreign-born population - France (%)
Place of birth for the foreign-born population - Germany (%)
Place of birth for the foreign-born population - Netherlands (%)
Place of birth for the foreign-born population - Switzerland (%)
Place of birth for the foreign-born population - Other Western Europe (%)
Place of birth for the foreign-born population - Greece (%)
Place of birth for the foreign-born population - Italy (%)
Place of birth for the foreign-born population - Portugal (%)
Place of birth for the foreign-born population - Spain (%)
Place of birth for the foreign-born population - Other Southern Europe (%)
Place of birth for the foreign-born population - Albania (%)
Place of birth for the foreign-born population - Belarus (%)
Place of birth for the foreign-born population - Bosnia and Herzegovina (%)
Place of birth for the foreign-born population - Bulgaria (%)
Place of birth for the foreign-born population - Croatia (%)
Place of birth for the foreign-born population - Czechoslovakia (%)
Place of birth for the foreign-born population - Hungary (%)
Place of birth for the foreign-born population - Latvia (%)
Place of birth for the foreign-born population - Lithuania (%)
Place of birth for the foreign-born population - North Macedonia (Macedonia) (%)
Place of birth for the foreign-born population - Moldova (%)
Place of birth for the foreign-born population - Poland (%)
Place of birth for the foreign-born population - Romania (%)
Place of birth for the foreign-born population - Russia (%)
Place of birth for the foreign-born population - Serbia (%)
Place of birth for the foreign-born population - Ukraine (%)
Place of birth for the foreign-born population - Other Eastern Europe (%)
Place of birth for the foreign-born population - China (%)
Place of birth for the foreign-born population - Hong Kong (%)
Place of birth for the foreign-born population - Taiwan (%)
Place of birth for the foreign-born population - Japan (%)
Place of birth for the foreign-born population - Korea (%)
Place of birth for the foreign-born population - Other Eastern Asia (%)
Place of birth for the foreign-born population - Afghanistan (%)
Place of birth for the foreign-born population - Bangladesh (%)
Place of birth for the foreign-born population - India (%)
Place of birth for the foreign-born population - Iran (%)
Place of birth for the foreign-born population - Kazakhstan (%)
Place of birth for the foreign-born population - Nepal (%)
Place of birth for the foreign-born population - Pakistan (%)
Place of birth for the foreign-born population - Sri Lanka (%)
Place of birth for the foreign-born population - Uzbekistan (%)
Place of birth for the foreign-born population - Other South Central Asia (%)
Place of birth for the foreign-born population - Burma (%)
Place of birth for the foreign-born population - Cambodia (%)
Place of birth for the foreign-born population - Indonesia (%)
Place of birth for the foreign-born population - Laos (%)
Place of birth for the foreign-born population - Malaysia (%)
Place of birth for the foreign-born population - Philippines (%)
Place of birth for the foreign-born population - Singapore (%)
Place of birth for the foreign-born population - Thailand (%)
Place of birth for the foreign-born population - Vietnam (%)
Place of birth for the foreign-born population - Other South Eastern Asia (%)
Place of birth for the foreign-born population - Armenia (%)
Place of birth for the foreign-born population - Iraq (%)
Place of birth for the foreign-born population - Israel (%)
Place of birth for the foreign-born population - Jordan (%)
Place of birth for the foreign-born population - Kuwait (%)
Place of birth for the foreign-born population - Lebanon (%)
Place of birth for the foreign-born population - Saudi Arabia (%)
Place of birth for the foreign-born population - Syria (%)
Place of birth for the foreign-born population - Turkey (%)
Place of birth for the foreign-born population - Yemen (%)
Place of birth for the foreign-born population - Other Western Asia (%)
Place of birth for the foreign-born population - Eritrea (%)
Place of birth for the foreign-born population - Ethiopia (%)
Place of birth for the foreign-born population - Kenya (%)
Place of birth for the foreign-born population - Somalia (%)
Place of birth for the foreign-born population - Uganda (%)
Place of birth for the foreign-born population - Zimbabwe (%)
Place of birth for the foreign-born population - Other Eastern Africa (%)
Place of birth for the foreign-born population - Cameroon (%)
Place of birth for the foreign-born population - Congo (%)
Place of birth for the foreign-born population - Democratic Republic of Congo (Zaire) (%)
Place of birth for the foreign-born population - Other Middle Africa (%)
Place of birth for the foreign-born population - Egypt (%)
Place of birth for the foreign-born population - Morocco (%)
Place of birth for the foreign-born population - Sudan (%)
Place of birth for the foreign-born population - Other Northern Africa (%)
Place of birth for the foreign-born population - South Africa (%)
Place of birth for the foreign-born population - Other Southern Africa (%)
Place of birth for the foreign-born population - Cabo Verde (%)
Place of birth for the foreign-born population - Ghana (%)
Place of birth for the foreign-born population - Liberia (%)
Place of birth for the foreign-born population - Nigeria (%)
Place of birth for the foreign-born population - Senegal (%)
Place of birth for the foreign-born population - Sierra Leone (%)
Place of birth for the foreign-born population - Other Western Africa (%)
Place of birth for the foreign-born population - Australia (%)
Place of birth for the foreign-born population - New Zealand (%)
Place of birth for the foreign-born population - Fiji (%)
Place of birth for the foreign-born population - Micronesia (%)
Place of birth for the foreign-born population - Bahamas (%)
Place of birth for the foreign-born population - Barbados (%)
Place of birth for the foreign-born population - Cuba (%)
Place of birth for the foreign-born population - Dominica (%)
Place of birth for the foreign-born population - Dominican Republic (%)
Place of birth for the foreign-born population - Grenada (%)
Place of birth for the foreign-born population - Haiti (%)
Place of birth for the foreign-born population - Jamaica (%)
Place of birth for the foreign-born population - St. Vincent and the Grenadines (%)
Place of birth for the foreign-born population - Trinidad and Tobago (%)
Place of birth for the foreign-born population - West Indies (%)
Place of birth for the foreign-born population - Other Caribbean (%)
Place of birth for the foreign-born population - Belize (%)
Place of birth for the foreign-born population - Costa Rica (%)
Place of birth for the foreign-born population - El Salvador (%)
Place of birth for the foreign-born population - Guatemala (%)
Place of birth for the foreign-born population - Honduras (%)
Place of birth for the foreign-born population - Mexico (%)
Place of birth for the foreign-born population - Nicaragua (%)
Place of birth for the foreign-born population - Panama (%)
Place of birth for the foreign-born population - Other Central America (%)
Place of birth for the foreign-born population - Argentina (%)
Place of birth for the foreign-born population - Bolivia (%)
Place of birth for the foreign-born population - Brazil (%)
Place of birth for the foreign-born population - Chile (%)
Place of birth for the foreign-born population - Colombia (%)
Place of birth for the foreign-born population - Ecuador (%)
Place of birth for the foreign-born population - Guyana (%)
Place of birth for the foreign-born population - Peru (%)
Place of birth for the foreign-born population - Uruguay (%)
Place of birth for the foreign-born population - Venezuela (%)
Place of birth for the foreign-born population - Other South America (%)
Place of birth for the foreign-born population - Canada (%)
Place of birth for the foreign-born population - Other Northern America (%)
Place of birth for the foreign-born population - Other (%)
Latest news about races in Danville, IL collected exclusively by city-data.com from local newspapers, TV, and radio stations
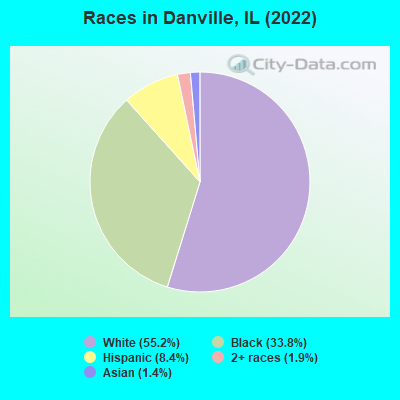
According to 2022 data, the most numerous races in Danville, IL are White alone (15,666 residents), Hispanic (2,392 residents), and Black alone (9,586 residents). 92.8% of Danville residents speak English at home. 3.7% of Danville, IL residents are foreign-born (2.2% born in Latin America, 1.1% born in Asia), which is 283.5% less than the foreign-born rate of 14.0% across the entire state of Illinois.
Race distribution in Danville
2000 2022
8,424,140 67.8% White alone 1,856,152 14.9% Black alone 1,530,262 12.3% Hispanic 419,916 3.4% Asian alone 153,996 1.2% Two or more races 13,479 0.1% Other race alone 18,232 0.1% American Indian alone 3,116 0.03% Native Hawaiian and Other
7,356,301 58.5% White alone 2,299,726 18.3% Hispanic 1,660,423 13.2% Black alone 747,296 5.9% Asian alone 458,599 3.6% Two or more races 45,386 0.4% Other race alone 10,405 0.08% American Indian alone 3,896 0.03% Native Hawaiian and Other
Income and house value in Danville Median household income in 2022 $50,357 White non-Hispanic householders$30,308 Black householders$52,459 Asian householders$61,953 Some other race householders$27,010 Two or more races householders$25,200 Hispanic or Latino race householdersMedian 2022 house value $86,902 White Non-Hispanic householders$62,815 Black or African American householders$75,567 American Indian or Alaska Native householders $222,766 Asian householders$59,037 Native Hawaiian and other Pacific Islander householders$52,267 Some other race householders$42,664 Two or more races householders$53,684 Hispanic or Latino householders
Median age by race in Danville
48.4 Median age for White residents46.9 51.1 31.1 Median age for Black or African American residents31.4 30.9 -692,753,622.5 Median age for American Indian / Alaska Native residents-720,238,094.5 -688,956,432.9 44.4 Median age for Asian residents39.8 42.0 -593,236,714.4 Median age for Native Hawaiian / Pacific Islander residents-666,666,666.0 -666,666,666.0 48.3 Median age for Other race residents49.1 41.6 28.3 Median age for Two or more races residents28.5 31.2 49.6 Median age for White alone residents47.5 51.5 41.4 Median age for Hispanic or Latino residents47.2 30.0
Owner/renter occupied households by race in Danville
House owners and renters - White residents 4,978 62.4% Owner occupied3,004 37.6% Renter occupiedHouse owners and renters - Black or African American residents 847 24.9% Owner occupied2,559 75.1% Renter occupiedHouse owners and renters - Asian residents 95 60.2% Owner occupied63 39.8% Renter occupiedHouse owners and renters - Other race residents 161 95.4% Owner occupied8 4.6% Renter occupiedHouse owners and renters - Two or more races residents 141 35.1% Owner occupied261 64.9% Renter occupiedHouse owners and renters - White alone residents 4,868 62.0% Owner occupied2,989 38.0% Renter occupiedHouse owners and renters - Hispanic or Latino residents 267 53.4% Owner occupied233 46.6% Renter occupied
Language usage in Danville
English speakers - Total 92.8% of residents of Danville speak English at home.
6.3% of residents speak Spanish at home 737 44.4% Speak English very well924 55.6% Speak English less than very well0.9% of residents speak other language at home 126 52.3% Speak English very well115 47.7% Speak English less than very well
English speakers - Born in the United States 93.5% of residents of Danville speak English at home.
3.6% of residents speak Spanish at home 102 65.0% Speak English very well55 35.0% Speak English less than very well0.6% of residents speak other language at home 28 100.0% Speak English very well
English speakers - Native, born elsewhere 33.0% of residents of Danville speak English at home.
95.4% of residents speak Spanish at home 104 100.0% Speak English less than very well
English speakers - Foreign-born 14.3% of residents of Danville speak English at home.
62.7% of residents speak Spanish at home 144 27.6% Speak English very well377 72.4% Speak English less than very well23.6% of residents speak other language at home 78 39.8% Speak English very well118 60.2% Speak English less than very well
White (Caucasian) - Speak only English Native:
97.9% (14,826)Foreign-born:
23.6% (62)
White (Caucasian) - Speak another language Native:
1.7% (260)Foreign-born:
83.9% (222)
Black or African American - Speak another language Native:
0.1% (6)Foreign-born:
95.1% (19)
Asian - Speak only English Native:
44.9% (67)Foreign-born:
14.5% (40)
Asian - Speak another language Native:
43.2% (64)Foreign-born:
85.9% (235)
Other race - Speak only English Native:
29.1% (124)Foreign-born:
13.4% (23)
Other race - Speak another language Native:
71.0% (302)Foreign-born:
86.7% (147)
Two or more races - Speak another language Native:
34.7% (541)Foreign-born:
100.0% (468)
White alone - Speak only English Native:
99.3% (14,703)Foreign-born:
100.0% (58)
White alone - Speak another language Native:
0.7% (102)Foreign-born:
86.7% (51)
Hispanic or Latino - Speak only English Native:
39.3% (676)Foreign-born:
3.6% (19)
Hispanic or Latino - Speak another language Native:
50.3% (866)Foreign-born:
99.4% (520)
Foreign-born residents in Danville 1,037 residents are foreign born (2.2% Latin America , 1.1% Asia ).
This city:
3.7%Illinois:
14.1%
Marital status for residents in Danville Marital status - White (Caucasian) population 15 years and over
Males 34.5% Never married37.9% Now married1.6% Separated6.1% Widowed19.8% DivorcedFemales 27.9% Never married35.0% Now married1.4% Separated14.2% Widowed21.6% DivorcedWomen who gave birth in the past 12 months Now married:
37.1% (33)Unmarried:
62.9% (56)
Women who did not give birth in the past 12 months Now married:
28.5% (840)Unmarried:
71.5% (2,108)
Marital status - Black or African American population 15 years and over
Males 68.5% Never married19.7% Now married1.0% Separated2.1% Widowed8.7% DivorcedFemales 60.3% Never married18.9% Now married3.0% Separated7.9% Widowed9.9% DivorcedWomen who gave birth in the past 12 months Now married:
4.4% (5)Unmarried:
95.6% (102)
Women who did not give birth in the past 12 months Now married:
15.8% (326)Unmarried:
84.2% (1,743)
Marital status - Asian population 15 years and over
Males 41.9% Never married37.9% Now married0.0% Separated7.3% Widowed12.9% DivorcedFemales 38.1% Never married24.2% Now married29.3% Separated5.1% Widowed3.3% DivorcedWomen who did not give birth in the past 12 months Now married:
17.2% (17)Unmarried:
82.8% (83)
Marital status - Other race population 15 years and over
Males 75.4% Never married19.6% Now married0.0% Separated0.0% Widowed5.0% DivorcedFemales 38.9% Never married52.2% Now married0.0% Separated8.8% Widowed0.0% DivorcedWomen who gave birth in the past 12 months Now married:
0.0% (0)Unmarried:
100.0% (26)
Women who did not give birth in the past 12 months Now married:
56.6% (100)Unmarried:
43.4% (77)
Marital status - Two or more races population 15 years and over
Males 80.5% Never married14.0% Now married0.0% Separated0.0% Widowed5.5% DivorcedFemales 52.2% Never married19.5% Now married14.4% Separated0.0% Widowed13.9% DivorcedWomen who did not give birth in the past 12 months Now married:
37.5% (198)Unmarried:
62.5% (330)
Marital status - White alone, not Hispanic / Latino population 15 years and over
Males 34.2% Never married38.0% Now married1.7% Separated6.2% Widowed19.9% DivorcedFemales 26.2% Never married35.4% Now married1.5% Separated14.8% Widowed22.2% DivorcedWomen who gave birth in the past 12 months Now married:
37.1% (34)Unmarried:
62.9% (57)
Women who did not give birth in the past 12 months Now married:
30.1% (851)Unmarried:
69.9% (1,973)
Marital status - Hispanic or Latino population 15 years and over
Males 60.2% Never married25.4% Now married0.0% Separated2.3% Widowed12.0% DivorcedFemales 52.5% Never married32.8% Now married7.8% Separated2.5% Widowed4.3% DivorcedWomen who gave birth in the past 12 months Now married:
0.0% (0)Unmarried:
100.0% (22)
Women who did not give birth in the past 12 months Now married:
36.5% (226)Unmarried:
63.5% (393)
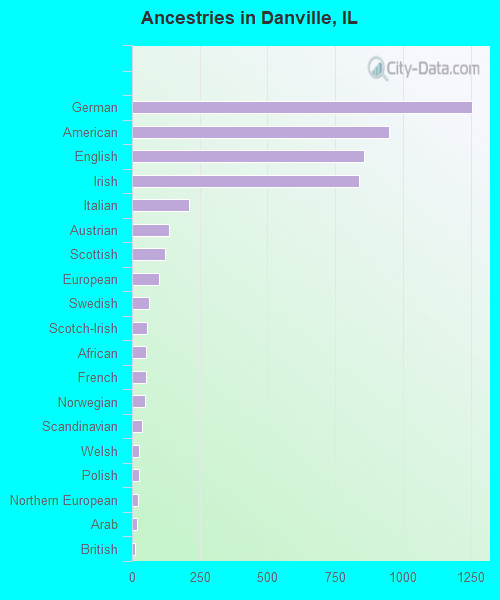
Ancestries in Danville
1,255 8.0% German947 6.1% American855 5.5% English839 5.4% Irish210 1.3% Italian136 0.9% Austrian120 0.8% Scottish98 0.6% European62 0.4% Swedish57 0.4% Scotch-Irish53 0.3% African52 0.3% French47 0.3% Norwegian38 0.2% Scandinavian27 0.2% Welsh25 0.2% Polish22 0.1% Northern European20 0.1% Arab12 0.08% British9 0.06% Lithuanian8 0.05% Belgian8 0.05% Czechoslovakian8 0.05% Danish8 0.05% Nigerian8 0.05% Ukrainian7 0.04% Canadian6 0.04% Hungarian6 0.04% Russian5 0.03% Czech5 0.03% Dutch3 0.02% Slovak
Geographical mobility in Danville Same house 1 year ago 14,740 92.0% White (Caucasian)8,187 90.1% Black or African American34 99.7% American Indian / Alaska Native285 72.0% Asian10 100.0% Native Hawaiian / Pacific Islander572 96.4% Other race1,574 77.0% Two or more races14,260 92.3% White alone, not Hispanic / Latino1,833 80.4% Hispanic or LatinoMoved within same county 950 5.9% White / Caucasian622 6.8% Black or African American99 25.0% Asian21 3.6% Other race432 21.2% Two or more races894 5.8% White alone, not Hispanic / Latino367 16.1% Hispanic or LatinoMoved within same state 188 1.2% White / Caucasian292 3.2% Black or African American19 0.9% Two or more races175 1.1% White alone, not Hispanic / Latino28 1.2% Hispanic or LatinoMoved from different state 87 0.5% White / Caucasian6 0.1% Black or African American9 2.3% Asian13 0.6% Two or more races87 0.6% White alone, not Hispanic / LatinoMoved from abroad 52 0.3% White27 0.2% White alone, not Hispanic / Latino36 1.6% Hispanic or Latino
Children Nativity (place of birth) in Danville
Children under 6 years - Living with two parents Both parents native 347 100.0% NativeBoth parents foreign-born 41 100.0% NativeOne native, one foreign-born parent 48 100.0% NativeChildren under 6 years - Living with one parent Native parent 1,558 100.0% NativeChildren 6 to 17 years - Living with two parents Both parents native 1,256 100.0% NativeBoth parents foreign-born 165 100.0% NativeOne native, one foreign-born parent 69 100.0% NativeChildren 6 to 17 years - Living with one parent Native parent 2,456 100.0% NativeForeign-born parent 168 49.8% Native169 50.2% Foreign-born
Grandparents responsible for own grandchildren in Danville
Grandparents (30 to 59 years) White / Caucasian 125 45.0% Responsible for grandchildren153 55.0% Not responsible for grandchildrenBlack or African American 30 38.4% Responsible for grandchildren48 61.6% Not responsible for grandchildrenAmerican Indian / Alaska Native 8 100.0% Responsible for grandchildrenAsian 8 100.0% Not responsible for grandchildrenOther race 3 100.0% Not responsible for grandchildrenWhite alone, not Hispanic / Latino 125 46.8% Responsible for grandchildren142 53.2% Not responsible for grandchildrenHispanic or Latino 3 100.0% Not responsible for grandchildrenGrandparents (60 years and over) White / Caucasian 58 28.5% Responsible for grandchildren145 71.5% Not responsible for grandchildrenBlack or African American 36 30.0% Responsible for grandchildren85 70.0% Not responsible for grandchildrenWhite alone, not Hispanic / Latino 62 29.5% Responsible for grandchildren149 70.5% Not responsible for grandchildrenHispanic or Latino 13 100.0% Not responsible for grandchildren