Races in Dallas, Georgia (GA) Detailed Stats
Ancestries, Foreign-born residents, place of birth
Settings
X


Recent posts about races in Dallas, Georgia on our local forum with over 2,400,000 registered users:
 | What is Dallas GA like? (13 replies) |
| Douglasville vs Dallas (9 replies) |
| Demographic changes in the ATL in the coming years (57 replies) |
| Dallas to Smyrna (5 replies) |
| Will Atlanta ever lose its title as the Black Mecca? (89 replies) |
| Moving from SoCal- where should I live? (72 replies) |
Latest news about races in Dallas, GA collected exclusively by city-data.com from local newspapers, TV, and radio stations
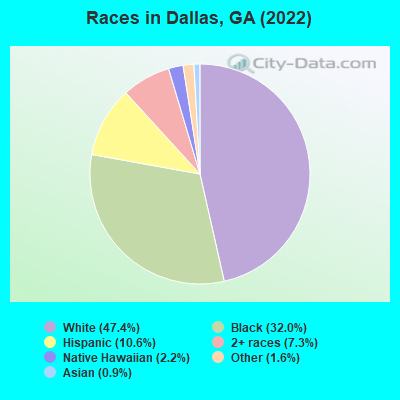
According to 2022 data, the most numerous races in Dallas, GA are White alone (7,030 residents), Black alone (4,742 residents), and Hispanic (1,579 residents). 86.7% of Dallas residents speak English at home. 8.1% of Dallas, GA residents are foreign-born (3.2% born in Latin America, 1.3% born in Africa, 1.2% born in Europe, 1.2% born in Asia, 1.1% born in Oceania), which is 22.7% less than the foreign-born rate of 10.0% across the entire state of Georgia.
Race distribution in Dallas
2000
2022

- 4,29484.9%White alone
- 51210.1%Black alone
- 1032.0%Hispanic
- 921.8%Two or more races
- 400.8%Asian alone
- 100.2%American Indian alone
- 40.08%Other race alone
- 10.02%Native Hawaiian and Other
Pacific Islander alone

-
- 7,03047.4%White alone
- 4,74232.0%Black alone
- 1,57910.6%Hispanic
- 1,0867.3%Two or more races
- 3272.2%Native Hawaiian and Other
Pacific Islander alone - 2321.6%Other race alone
- 1300.9%Asian alone
- 110.07%American Indian alone
2000
2022
-
- 5,128,66162.6%White alone
- 2,331,46528.5%Black alone
- 435,2275.3%Hispanic
- 171,5132.1%Asian alone
- 87,3641.1%Two or more races
- 17,6700.2%American Indian alone
- 11,2750.1%Other race alone
- 3,2780.04%Native Hawaiian and Other
Pacific Islander alone

-
- 5,415,65749.6%White alone
- 3,349,24030.7%Black alone
- 1,132,60410.4%Hispanic
- 479,1564.4%Asian alone
- 462,9234.2%Two or more races
- 54,4160.5%Other race alone
- 11,9230.1%American Indian alone
- 6,9570.06%Native Hawaiian and Other
Pacific Islander alone

Income and house value in Dallas
- Median household income in 2022
- $46,279White non-Hispanic householders
- $64,395Black householders
- $66,368Two or more races householders
- $37,041Hispanic or Latino race householders
- Median 2022 house value
- $263,822White Non-Hispanic householders
- $266,188Black or African American householders
- $221,823Two or more races householders
Household income for White non-Hispanic householders

Household income for Black householders

Household income for Asian householders

Household income for Some other race householders

Household income for Two or more races householders

Household income for Hispanic or Latino race householders

Median age by race in Dallas
- 36.2Median age for White residents
- 35.8Males
- 34.0Females
- 33.8Median age for Black or African American residents
- 38.2Males
- 32.0Females
- -597,462,513.8Median age for American Indian / Alaska Native residents
- -597,222,221.6Males
- -677,419,354.2Females
- 87.0Median age for Asian residents
- 86.4Males
- 112.1Females
- -666,666,666.0Median age for Native Hawaiian / Pacific Islander residents
- -666,666,666.0Males
- -666,666,666.0Females
- 26.3Median age for Other race residents
- 9.5Males
- 29.7Females
- 20.4Median age for Two or more races residents
- 17.4Males
- 22.4Females
- 36.5Median age for White alone residents
- 36.3Males
- 35.9Females
- 29.7Median age for Hispanic or Latino residents
- 15.6Males
- 32.2Females
Owner/renter occupied households by race in Dallas
- House owners and renters - White residents
- 1,67153.3%Owner occupied
- 1,46446.7%Renter occupied
- House owners and renters - Black or African American residents
- 1,17154.8%Owner occupied
- 96745.2%Renter occupied
- House owners and renters - American Indian / Alaska Native residents
- 14100.0%Renter occupied
- House owners and renters - Asian residents
- 7360.1%Owner occupied
- 4839.9%Renter occupied
- House owners and renters - Other race residents
- 68100.0%Owner occupied
- House owners and renters - Two or more races residents
- 26842.1%Owner occupied
- 36857.9%Renter occupied
- House owners and renters - White alone residents
- 1,58951.6%Owner occupied
- 1,48948.4%Renter occupied
- House owners and renters - Hispanic or Latino residents
- 27384.2%Owner occupied
- 5115.8%Renter occupied
Language usage in Dallas
- English speakers - Total
- 86.7% of residents of Dallas speak English at home.
- 7.5% of residents speak Spanish at home
- 67165.3%Speak English very well
- 35634.7%Speak English less than very well
- 6.3% of residents speak other language at home
- 56265.8%Speak English very well
- 29234.2%Speak English less than very well
- English speakers - Born in the United States
- 92.6% of residents of Dallas speak English at home.
- 6.9% of residents speak Spanish at home
- 355100.0%Speak English very well
- 1.5% of residents speak other language at home
- 78100.0%Speak English very well
- English speakers - Native, born elsewhere
- 98.2% of residents of Dallas speak English at home.
- English speakers - Foreign-born
- 19.0% of residents of Dallas speak English at home.
- 41.8% of residents speak Spanish at home
- 17531.8%Speak English very well
- 37668.2%Speak English less than very well
- 41.5% of residents speak other language at home
- 44180.6%Speak English very well
- 10619.4%Speak English less than very well
White (Caucasian) - Speak only English
| Native: | 94.0% (6,466) |
| Foreign-born: | 26.3% (46) |
White (Caucasian) - Speak another language
| Native: | 5.9% (407) |
| Foreign-born: | 50.9% (89) |
Black or African American - Speak only English
| Native: | 97.3% (4,534) |
| Foreign-born: | 45.4% (120) |
Black or African American - Speak another language
| Native: | 2.6% (122) |
| Foreign-born: | 50.8% (135) |
Other race - Speak another language
| Native: | 40.5% (149) |
| Foreign-born: | 100.0% (232) |
White alone - Speak only English
| Native: | 96.2% (6,462) |
| Foreign-born: | 59.7% (34) |
White alone - Speak another language
| Native: | 3.7% (248) |
| Foreign-born: | 40.5% (23) |
Hispanic or Latino - Speak another language
| Native: | 46.7% (375) |
| Foreign-born: | 100.0% (561) |
Foreign-born residents in Dallas
1,209 residents are foreign born (3.2% Latin America, 1.3% Africa, 1.2% Europe, 1.2% Asia, 1.1% Oceania).
| This city: | 8.1% |
| Georgia: | 10.4% |


Marital status for residents in Dallas
Marital status - White (Caucasian) population 15 years and over
- Males
- 26.2%Never married
- 48.4%Now married
- 2.0%Separated
- 1.8%Widowed
- 21.5%Divorced
- Females
- 25.6%Never married
- 38.8%Now married
- 3.7%Separated
- 9.5%Widowed
- 22.4%Divorced
Women who gave birth in the past 12 months
| Now married: | 80.5% (155) |
| Unmarried: | 19.5% (37) |
Women who did not give birth in the past 12 months
| Now married: | 44.0% (746) |
| Unmarried: | 56.0% (948) |
Marital status - Black or African American population 15 years and over
- Males
- 36.6%Never married
- 55.1%Now married
- 2.1%Separated
- 0.0%Widowed
- 6.2%Divorced
- Females
- 38.1%Never married
- 41.5%Now married
- 3.2%Separated
- 1.6%Widowed
- 15.6%Divorced
Women who did not give birth in the past 12 months
| Now married: | 43.9% (782) |
| Unmarried: | 56.1% (1,000) |
Marital status - Asian population 15 years and over
- Males
- 0.0%Never married
- 100.0%Now married
- 0.0%Separated
- 0.0%Widowed
- 0.0%Divorced
- Females
- 5.7%Never married
- 90.0%Now married
- 0.0%Separated
- 4.3%Widowed
- 0.0%Divorced
Women who did not give birth in the past 12 months
| Now married: | 61.9% (13) |
| Unmarried: | 38.1% (8) |
Marital status - Other race population 15 years and over
- Males
- 0.0%Never married
- 100.0%Now married
- 0.0%Separated
- 0.0%Widowed
- 0.0%Divorced
- Females
- 0.0%Never married
- 25.6%Now married
- 0.0%Separated
- 74.4%Widowed
- 0.0%Divorced
Women who gave birth in the past 12 months
| Now married: | 100.0% (18) |
| Unmarried: | 0.0% (0) |
Women who did not give birth in the past 12 months
| Now married: | 28.2% (40) |
| Unmarried: | 71.8% (102) |
Marital status - Two or more races population 15 years and over
- Males
- 4.7%Never married
- 95.3%Now married
- 0.0%Separated
- 0.0%Widowed
- 0.0%Divorced
- Females
- 20.4%Never married
- 45.9%Now married
- 0.0%Separated
- 25.2%Widowed
- 8.5%Divorced
Women who did not give birth in the past 12 months
| Now married: | 69.3% (184) |
| Unmarried: | 30.7% (81) |
Marital status - White alone, not Hispanic / Latino population 15 years and over
- Males
- 25.7%Never married
- 47.6%Now married
- 2.2%Separated
- 1.9%Widowed
- 22.7%Divorced
- Females
- 25.1%Never married
- 38.3%Now married
- 4.0%Separated
- 10.0%Widowed
- 22.5%Divorced
Women who gave birth in the past 12 months
| Now married: | 80.5% (159) |
| Unmarried: | 19.5% (38) |
Women who did not give birth in the past 12 months
| Now married: | 43.7% (683) |
| Unmarried: | 56.3% (879) |
Marital status - Hispanic or Latino population 15 years and over
- Males
- 23.0%Never married
- 77.0%Now married
- 0.0%Separated
- 0.0%Widowed
- 0.0%Divorced
- Females
- 16.5%Never married
- 26.6%Now married
- 6.6%Separated
- 35.7%Widowed
- 14.6%Divorced
Women who gave birth in the past 12 months
| Now married: | 100.0% (16) |
| Unmarried: | 0.0% (0) |
Women who did not give birth in the past 12 months
| Now married: | 39.1% (173) |
| Unmarried: | 60.9% (270) |
Ancestries in Dallas

- 1,56019.7%American
- 1,00112.7%English
- 3294.2%Irish
- 1952.5%European
- 1922.4%Bahamian
- 1632.1%Nigerian
- 1351.7%German
- 1321.7%Haitian
- 1291.6%Italian
- 1271.6%Trinidadian and Tobagonian
- 861.1%African
- 740.9%Scotch-Irish
- 650.8%Scottish
- 260.3%Greek
- 100.1%Norwegian
- 100.1%Liberian

Geographical mobility in Dallas

- Same house 1 year ago
- 6,28185.7%White (Caucasian)
- 3,97779.9%Black or African American
- 1699.5%American Indian / Alaska Native
- 17999.9%Asian
- 63277.4%Other race
- 79969.7%Two or more races
- 5,89484.5%White alone, not Hispanic / Latino
- 1,04986.9%Hispanic or Latino

-
- Moved within same county
- 2883.9%White / Caucasian
- 2384.8%Black or African American
- 16392.7%Native Hawaiian / Pacific Islander
- 2884.1%White alone, not Hispanic / Latino

-
- Moved within same state
- 3224.4%White / Caucasian
- 50210.1%Black or African American
- 182.2%Other race
- 36331.7%Two or more races
- 3314.7%White alone, not Hispanic / Latino
- 151.3%Hispanic or Latino

-
- Moved from different state
- 130.2%White / Caucasian
- 110.2%Black or African American
- 160.2%White alone, not Hispanic / Latino

-
- Moved from abroad
- 861.2%White
- 15418.9%Other race
- 1031.5%White alone, not Hispanic / Latino
- 15112.5%Hispanic or Latino

Children Nativity (place of birth) in Dallas
Place of birth for residents in Dallas
![Place of birth for the foreign-born population - Regions]()
- 500Americas
- 478Latin America
- 245Caribbean
- 219South America
- 187Africa
- 187Western Africa
- 177Europe
- 177Asia
- 165Oceania
- 150Western Europe
- 126South Eastern Asia
- 51Eastern Asia
- 27Southern Europe
- 21Northern America
- 14Central America

![Place of birth for the foreign-born population - Countries]()
- 195Peru
- 181Dominican Republic
- 165Micronesia
- 150Germany
- 126Philippines
- 113Nigeria
- 74Liberia
- 51Japan
- 46Trinidad and Tobago
- 27Italy
- 23Uruguay
- 21Canada
- 16Haiti
- 14Costa Rica

Grandparents responsible for own grandchildren in Dallas
Zip codes: 30132.