Races in Cumberland, Maryland (MD) Detailed Stats
Ancestries, Foreign-born residents, place of birth
Settings
X


Recent posts about races in Cumberland, Maryland on our local forum with over 2,400,000 registered users:
 | Cumberland MD house hunt for weekends and vacation (17 replies) |
| Cumberland MD Pros/Cons? (22 replies) |
| Cumberland Maryland? Please tell me what you know. (43 replies) |
| Best place in MD to rent a single-family house for $750/mo? (29 replies) |
| Handyman suggestions for aging parents in Cumberland (4 replies) |
| Potentially moving to Cumberland, MD (9 replies) |
Latest news about races in Cumberland, MD collected exclusively by city-data.com from local newspapers, TV, and radio stations
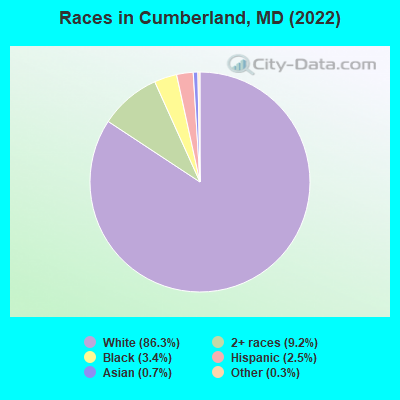
According to 2022 data, the most numerous races in Cumberland, MD are White alone (16,226 residents), Black alone (633 residents), and Hispanic (465 residents). 95.0% of Cumberland residents speak English at home. 2.1% of Cumberland, MD residents are foreign-born (0.8% born in Asia, 0.7% born in Europe, 0.4% born in Latin America), which is 646.0% less than the foreign-born rate of 16.0% across the entire state of Maryland.
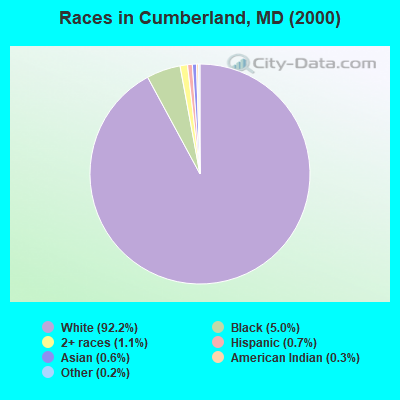
Race distribution in Cumberland
2000
2022

- 19,83592.2%White alone
- 1,0745.0%Black alone
- 2351.1%Two or more races
- 1500.7%Hispanic
- 1290.6%Asian alone
- 560.3%American Indian alone
- 350.2%Other race alone
- 40.02%Native Hawaiian and Other
Pacific Islander alone
-
- 16,22686.3%White alone
- 1,7279.2%Two or more races
- 6333.4%Black alone
- 4652.5%Hispanic
- 1380.7%Asian alone
- 540.3%Other race alone
- 160.09%American Indian alone
2000
2022
-
- 3,286,54762.1%White alone
- 1,464,73527.7%Black alone
- 227,9164.3%Hispanic
- 209,7384.0%Asian alone
- 82,9461.6%Two or more races
- 13,3120.3%American Indian alone
- 9,3790.2%Other race alone
- 1,9130.04%Native Hawaiian and Other
Pacific Islander alone

-
- 2,906,49247.1%White alone
- 1,800,91429.2%Black alone
- 705,84211.4%Hispanic
- 401,8186.5%Asian alone
- 291,3174.7%Two or more races
- 46,9300.8%Other race alone
- 8,9300.1%American Indian alone
- 2,4170.04%Native Hawaiian and Other
Pacific Islander alone

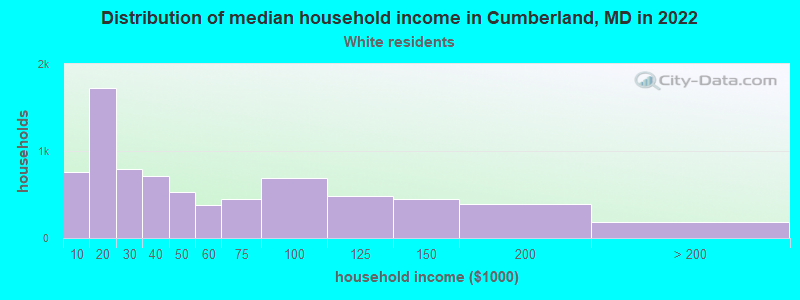
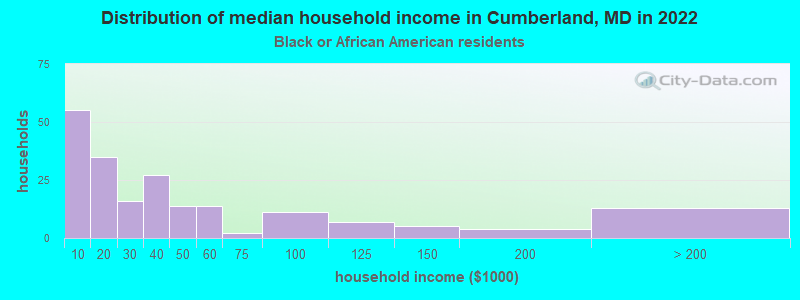
Income and house value in Cumberland
- Median household income in 2022
- $40,559White non-Hispanic householders
- $29,442Black householders
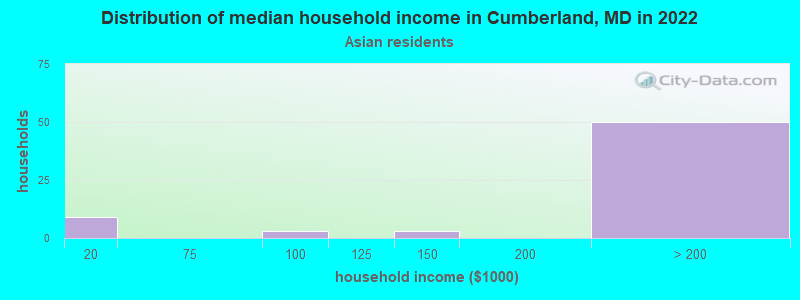
- over $200,000Asian householders
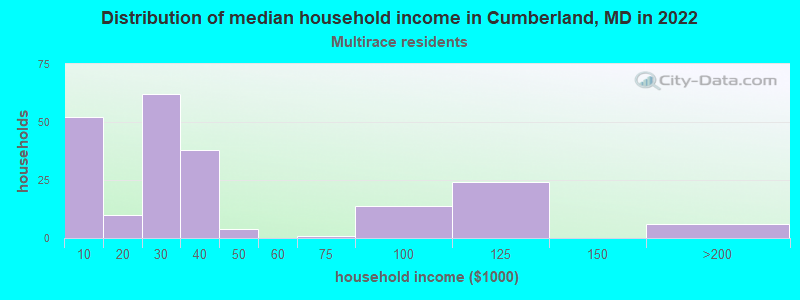
- $22,680Two or more races householders
- Median 2022 house value
- $117,637White Non-Hispanic householders
- $96,602Black or African American householders
- $126,596American Indian or Alaska Native householders
- $480,872Asian householders
- $313,375Two or more races householders
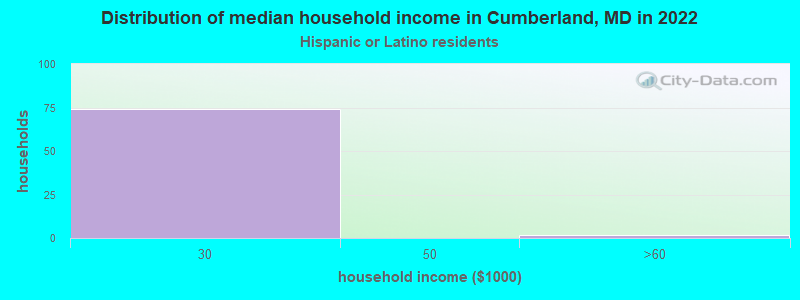
- $149,383Hispanic or Latino householders
Household income for White non-Hispanic householders
Household income for Black householders
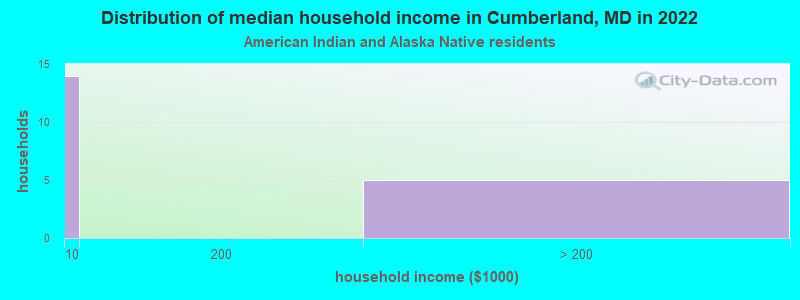
Household income for American Indian and Alaska Native householders
Household income for Asian householders
Household income for Two or more races householders
Household income for Hispanic or Latino race householders
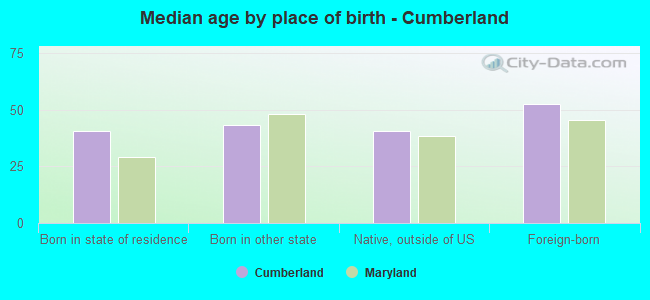
Median age by race in Cumberland
- 44.4Median age for White residents
- 42.4Males
- 46.9Females
- 28.7Median age for Black or African American residents
- 28.6Males
- 21.5Females
- 33.4Median age for American Indian / Alaska Native residents
- 52.5Males
- -676,818,950.3Females
- 64.8Median age for Asian residents
- 73.6Males
- 39.9Females
- -763,333,332.6Median age for Native Hawaiian / Pacific Islander residents
- -666,666,666.0Males
- -666,666,666.0Females
- 41.1Median age for Other race residents
- 19.4Males
- 41.6Females
- 15.5Median age for Two or more races residents
- 15.4Males
- 17.2Females
- 44.9Median age for White alone residents
- 42.5Males
- 47.0Females
- 21.2Median age for Hispanic or Latino residents
- 27.8Males
- 21.5Females
Owner/renter occupied households by race in Cumberland
- House owners and renters - White residents
- 4,31958.3%Owner occupied
- 3,08641.7%Renter occupied
- House owners and renters - Black or African American residents
- 5026.2%Owner occupied
- 14273.8%Renter occupied
- House owners and renters - American Indian / Alaska Native residents
- 424.1%Owner occupied
- 1375.9%Renter occupied
- House owners and renters - Asian residents
- 6582.2%Owner occupied
- 1417.8%Renter occupied
- House owners and renters - Other race residents
- 12100.0%Owner occupied
- House owners and renters - Two or more races residents
- 10051.7%Owner occupied
- 9448.3%Renter occupied
- House owners and renters - White alone residents
- 4,31558.5%Owner occupied
- 3,05541.5%Renter occupied
- House owners and renters - Hispanic or Latino residents
- 22.5%Owner occupied
- 8197.5%Renter occupied
Language usage in Cumberland
- English speakers - Total
- 95.0% of residents of Cumberland speak English at home.
- 1.3% of residents speak Spanish at home
- 19279.0%Speak English very well
- 5121.0%Speak English less than very well
- 2.7% of residents speak other language at home
- 43987.8%Speak English very well
- 6112.2%Speak English less than very well
- English speakers - Born in the United States
- 97.1% of residents of Cumberland speak English at home.
- 0.6% of residents speak Spanish at home
- 24100.0%Speak English very well
- 2.1% of residents speak other language at home
- 7790.6%Speak English very well
- 89.4%Speak English less than very well
- English speakers - Native, born elsewhere
- 30.4% of residents of Cumberland speak English at home.
- 57.1% of residents speak Spanish at home
- 6772.8%Speak English very well
- 2527.2%Speak English less than very well
- 9.3% of residents speak other language at home
- 15100.0%Speak English very well
- English speakers - Foreign-born
- 38.3% of residents of Cumberland speak English at home.
- 8.2% of residents speak Spanish at home
- 721.2%Speak English very well
- 2678.8%Speak English less than very well
- 54.0% of residents speak other language at home
- 16676.5%Speak English very well
- 5123.5%Speak English less than very well
White (Caucasian) - Speak only English
| Native: | 98.3% (15,281) |
| Foreign-born: | 47.1% (61) |
White (Caucasian) - Speak another language
| Native: | 1.2% (188) |
| Foreign-born: | 53.5% (69) |
Black or African American - Speak only English
| Native: | 97.8% (719) |
| Foreign-born: | 56.3% (34) |
Black or African American - Speak another language
| Native: | 2.1% (16) |
| Foreign-born: | 42.6% (26) |
Asian - Speak only English
| Native: | 97.1% (29) |
| Foreign-born: | 35.5% (47) |
Other race - Speak another language
| Native: | 35.0% (11) |
| Foreign-born: | 100.0% (29) |
White alone - Speak only English
| Native: | 98.2% (15,033) |
| Foreign-born: | 40.6% (68) |
White alone - Speak another language
| Native: | 1.8% (268) |
| Foreign-born: | 58.9% (99) |
Hispanic or Latino - Speak another language
| Native: | 34.2% (134) |
| Foreign-born: | 100.0% (27) |
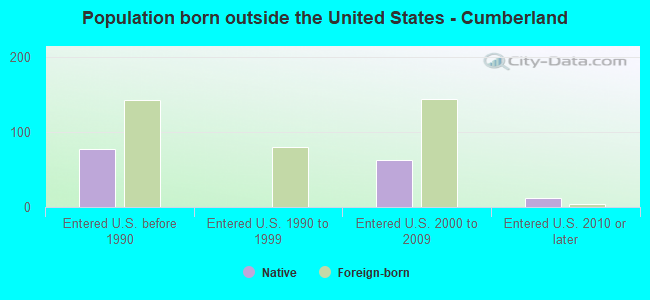
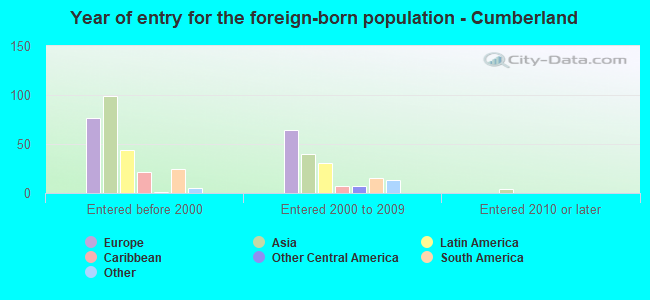
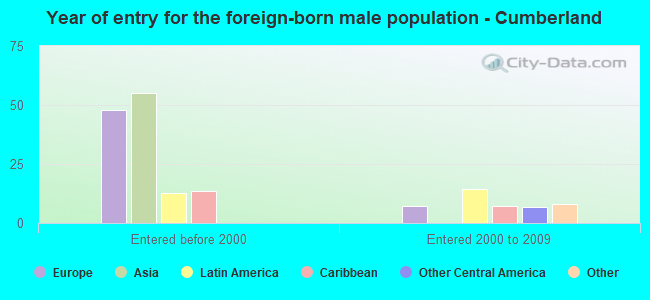
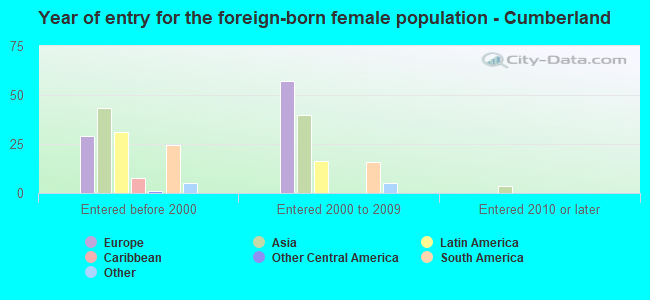
Foreign-born residents in Cumberland
403 residents are foreign born (0.8% Asia, 0.7% Europe, 0.4% Latin America).
| This city: | 2.1% |
| Maryland: | 15.7% |

Marital status for residents in Cumberland
Marital status - White (Caucasian) population 15 years and over
- Males
- 32.8%Never married
- 42.0%Now married
- 1.6%Separated
- 5.1%Widowed
- 18.5%Divorced
- Females
- 25.2%Never married
- 36.8%Now married
- 1.7%Separated
- 16.3%Widowed
- 20.1%Divorced
Women who gave birth in the past 12 months
| Now married: | 74.6% (142) |
| Unmarried: | 25.4% (48) |
Women who did not give birth in the past 12 months
| Now married: | 34.1% (1,176) |
| Unmarried: | 65.9% (2,278) |
Marital status - Black or African American population 15 years and over
- Males
- 67.7%Never married
- 19.0%Now married
- 4.0%Separated
- 1.2%Widowed
- 8.2%Divorced
- Females
- 75.7%Never married
- 5.9%Now married
- 0.0%Separated
- 11.8%Widowed
- 6.7%Divorced
Women who gave birth in the past 12 months
| Now married: | 0.0% (0) |
| Unmarried: | 98.0% (1) |
Women who did not give birth in the past 12 months
| Now married: | 3.3% (8) |
| Unmarried: | 96.7% (232) |
Marital status - Asian population 15 years and over
- Males
- 0.0%Never married
- 57.8%Now married
- 0.0%Separated
- 0.0%Widowed
- 42.2%Divorced
- Females
- 42.1%Never married
- 57.9%Now married
- 0.0%Separated
- 0.0%Widowed
- 0.0%Divorced
Women who did not give birth in the past 12 months
| Now married: | 21.6% (11) |
| Unmarried: | 78.4% (40) |
Marital status - Other race population 15 years and over
- Males
- 23.1%Never married
- 0.0%Now married
- 0.0%Separated
- 0.0%Widowed
- 76.9%Divorced
- Females
- 100.0%Never married
- 0.0%Now married
- 0.0%Separated
- 0.0%Widowed
- 0.0%Divorced
Women who did not give birth in the past 12 months
| Now married: | 0.0% (0) |
| Unmarried: | 100.0% (30) |
Marital status - Two or more races population 15 years and over
- Males
- 82.5%Never married
- 11.0%Now married
- 4.1%Separated
- 0.0%Widowed
- 2.4%Divorced
- Females
- 47.7%Never married
- 28.9%Now married
- 2.3%Separated
- 6.9%Widowed
- 14.2%Divorced
Women who did not give birth in the past 12 months
| Now married: | 30.2% (63) |
| Unmarried: | 69.8% (146) |
Marital status - White alone, not Hispanic / Latino population 15 years and over
- Males
- 33.2%Never married
- 41.1%Now married
- 1.6%Separated
- 5.2%Widowed
- 18.9%Divorced
- Females
- 25.1%Never married
- 37.0%Now married
- 1.7%Separated
- 16.4%Widowed
- 19.8%Divorced
Women who gave birth in the past 12 months
| Now married: | 74.6% (143) |
| Unmarried: | 25.4% (49) |
Women who did not give birth in the past 12 months
| Now married: | 34.5% (1,182) |
| Unmarried: | 65.5% (2,246) |
Marital status - Hispanic or Latino population 15 years and over
- Males
- 20.4%Never married
- 79.6%Now married
- 0.0%Separated
- 0.0%Widowed
- 0.0%Divorced
- Females
- 64.5%Never married
- 12.1%Now married
- 0.0%Separated
- 0.0%Widowed
- 23.4%Divorced
Women who did not give birth in the past 12 months
| Now married: | 0.0% (0) |
| Unmarried: | 100.0% (100) |
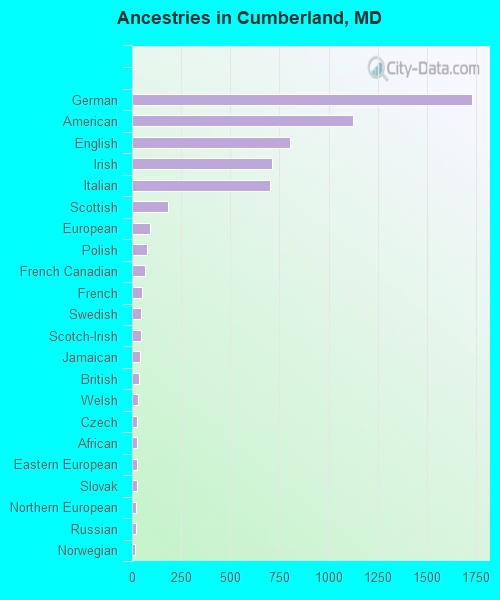
Ancestries in Cumberland

- 1,73022.5%German
- 1,12414.6%American
- 80310.4%English
- 7109.2%Irish
- 7029.1%Italian
- 1842.4%Scottish
- 931.2%European
- 771.0%Polish
- 680.9%French Canadian
- 490.6%French
- 470.6%Swedish
- 450.6%Scotch-Irish
- 390.5%Jamaican
- 340.4%British
- 310.4%Welsh
- 270.4%Czech
- 240.3%African
- 230.3%Eastern European
- 230.3%Slovak
- 200.3%Northern European
- 180.2%Russian
- 160.2%Norwegian
- 130.2%Yugoslavian
- 120.2%Danish
- 110.1%Greek
- 90.1%West Indian
- 70.09%Canadian
- 70.09%Croatian
- 60.08%Iranian
- 60.08%Trinidadian and Tobagonian
- 50.06%Austrian
- 50.06%Scandinavian
- 30.04%Dutch
- 10.01%Belizean
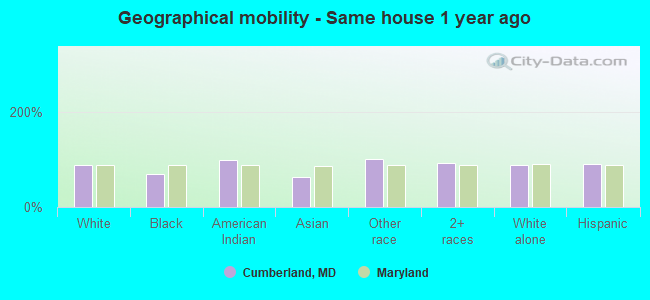
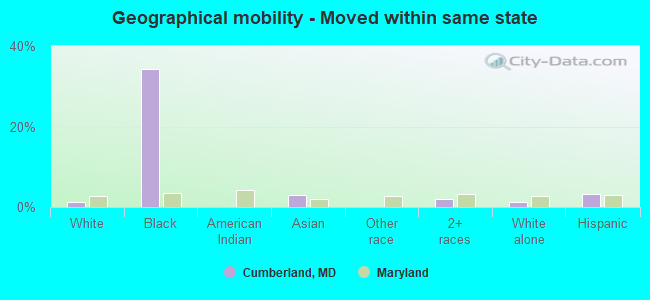
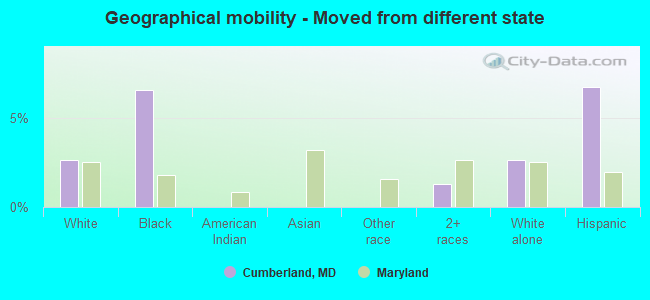
Geographical mobility in Cumberland

- Same house 1 year ago
- 14,24487.9%White (Caucasian)
- 44669.9%Black or African American
- 2398.9%American Indian / Alaska Native
- 10162.7%Asian
- 74100.0%Other race
- 1,38592.4%Two or more races
- 14,09087.7%White alone, not Hispanic / Latino
- 39390.4%Hispanic or Latino
-
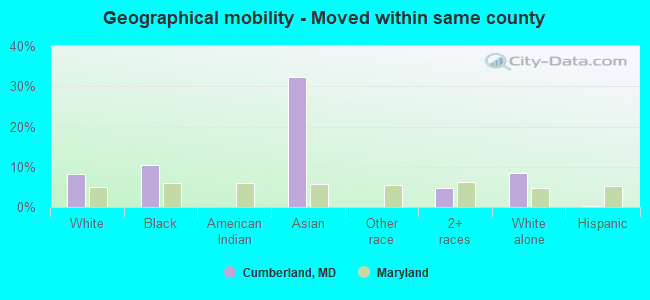
- Moved within same county
- 1,3258.2%White / Caucasian
- 6710.5%Black or African American
- 5232.2%Asian
- 714.7%Two or more races
- 1,3438.4%White alone, not Hispanic / Latino
- 10.2%Hispanic or Latino
-
- Moved within same state
- 1971.2%White / Caucasian
- 21934.3%Black or African American
- 53.0%Asian
- 312.0%Two or more races
- 2051.3%White alone, not Hispanic / Latino
- 143.2%Hispanic or Latino
-
- Moved from different state
- 4282.6%White / Caucasian
- 426.6%Black or African American
- 191.3%Two or more races
- 4182.6%White alone, not Hispanic / Latino
- 296.7%Hispanic or Latino
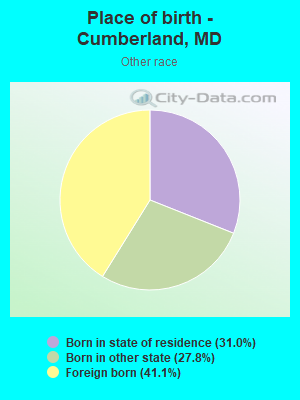
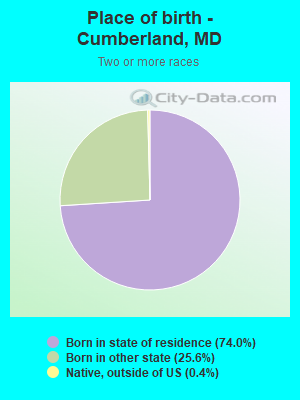
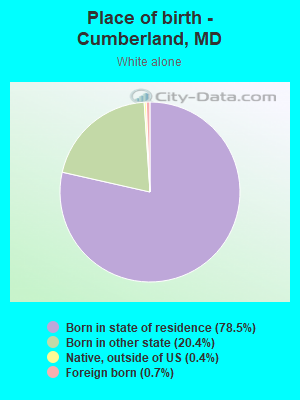
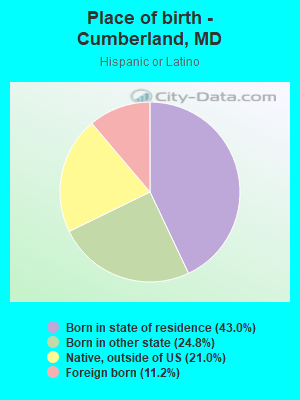
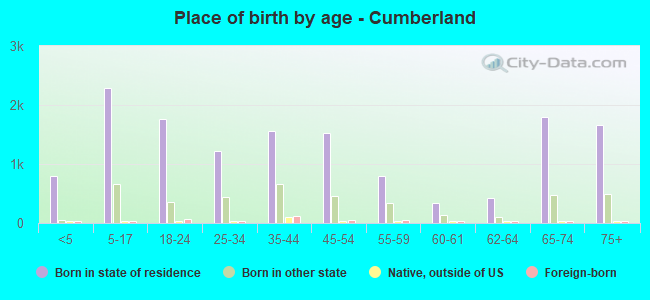
Children Nativity (place of birth) in Cumberland
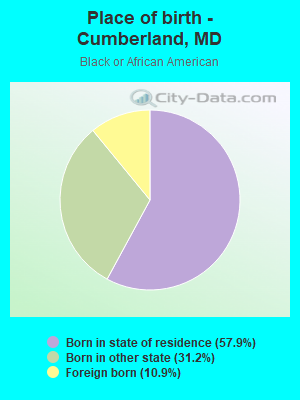
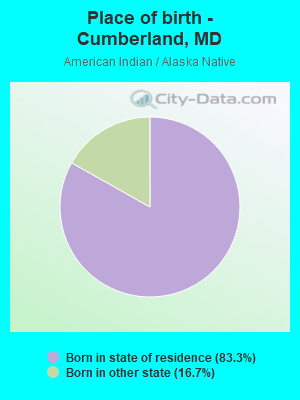
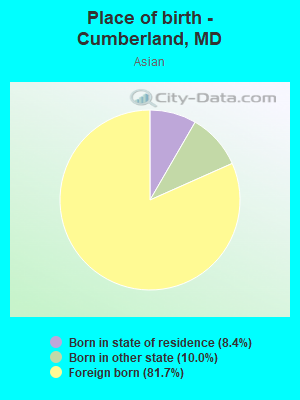
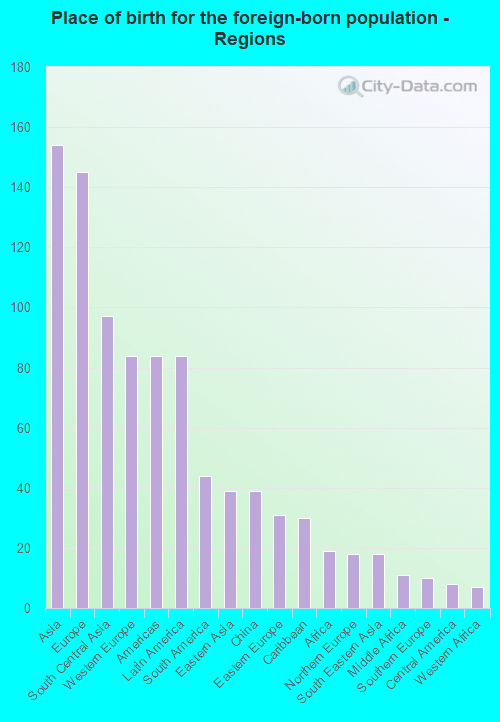
Place of birth for residents in Cumberland
![Place of birth for the foreign-born population - Regions]()
- 154Asia
- 145Europe
- 97South Central Asia
- 84Western Europe
- 84Americas
- 84Latin America
- 44South America
- 39Eastern Asia
- 39China
- 31Eastern Europe
- 30Caribbean
- 19Africa
- 18Northern Europe
- 18South Eastern Asia
- 11Middle Africa
- 10Southern Europe
- 8Central America
- 7Western Africa
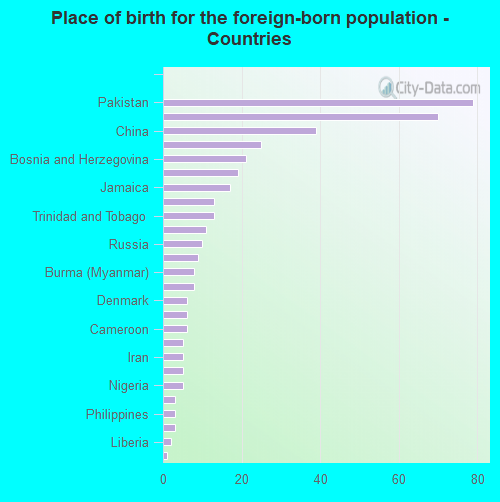
![Place of birth for the foreign-born population - Countries]()
- 79Pakistan
- 70Germany
- 39China
- 25Venezuela
- 21Bosnia and Herzegovina
- 19Brazil
- 17Jamaica
- 13France
- 13Trinidad and Tobago
- 11India
- 10Russia
- 9Portugal
- 8Burma (Myanmar)
- 8Belize
- 6Denmark
- 6United Kingdom
- 6Cameroon
- 5Scotland
- 5Iran
- 5Congo
- 5Nigeria
- 3Cambodia
- 3Philippines
- 3Thailand
- 2Liberia
- 1Spain
Grandparents responsible for own grandchildren in Cumberland
Zip codes: 21502.