Races in Culpeper, Virginia (VA) Detailed Stats
Data:
Races - White alone (%)
Races - White alone (% change since 2000)
Races - Black alone (%)
Races - Black alone (% change since 2000)
Races - American Indian alone (%)
Races - American Indian alone (% change since 2000)
Races - Asian alone (%)
Races - Asian alone (% change since 2000)
Races - Hispanic (%)
Races - Hispanic (% change since 2000)
Races - Native Hawaiian and Other Pacific Islander alone (%)
Races - Native Hawaiian and Other Pacific Islander alone (% change since 2000)
Races - Two or more races(%)
Races - Two or more races(% change since 2000)
Races - Other race alone (%)
Races - Other race alone (% change since 2000)
Racial diversity
Place of birth - Born in state of residence (%)
Place of birth - Born in state of residence (%) - White
Place of birth - Born in state of residence (%) - Black or African American
Place of birth - Born in state of residence (%) - Asian
Place of birth - Born in state of residence (%) - Hispanic or Latino
Place of birth - Born in state of residence (%) - American Indian and Alaska Native
Place of birth - Born in state of residence (%) - Multirace
Place of birth - Born in state of residence (%) - Other Race
Place of birth - Born in other state (%)
Place of birth - Born in other state (%) - White
Place of birth - Born in other state (%) - Black or African American
Place of birth - Born in other state (%) - Asian
Place of birth - Born in other state (%) - Hispanic or Latino
Place of birth - Born in other state (%) - American Indian and Alaska Native
Place of birth - Born in other state (%) - Multirace
Place of birth - Born in other state (%) - Other Race
Place of birth - Native, outside of US (%)
Place of birth - Native, outside of US (%) - White
Place of birth - Native, outside of US (%) - Black or African American
Place of birth - Native, outside of US (%) - Asian
Place of birth - Native, outside of US (%) - Hispanic or Latino
Place of birth - Native, outside of US (%) - American Indian and Alaska Native
Place of birth - Native, outside of US (%) - Multirace
Place of birth - Native, outside of US (%) - Other Race
Place of birth - Foreign born (%)
Place of birth - Foreign born (%) - White
Place of birth - Foreign born (%) - Black or African American
Place of birth - Foreign born (%) - Asian
Place of birth - Foreign born (%) - Hispanic or Latino
Place of birth - Foreign born (%) - American Indian and Alaska Native
Place of birth - Foreign born (%) - Multirace
Place of birth - Foreign born (%) - Other Race
Residents speaking English at home (%)
Residents speaking English at home - Born in the United States (%)
Residents speaking English at home - Native, born elsewhere (%)
Residents speaking English at home - Foreign born (%)
Residents speaking Spanish at home (%)
Residents speaking Spanish at home - Born in the United States (%)
Residents speaking Spanish at home - Native, born elsewhere (%)
Residents speaking Spanish at home - Foreign born (%)
Residents speaking other language at home (%)
Residents speaking other language at home - Born in the United States (%)
Residents speaking other language at home - Native, born elsewhere (%)
Residents speaking other language at home - Foreign born (%)
Marital status - Never married (%)
Marital status - Now married (%)
Marital status - Separated (%)
Marital status - Widowed (%)
Marital status - Divorced (%)
Ancestries Reported - Arab (%)
Ancestries Reported - Czech (%)
Ancestries Reported - Danish (%)
Ancestries Reported - Dutch (%)
Ancestries Reported - English (%)
Ancestries Reported - French (%)
Ancestries Reported - French Canadian (%)
Ancestries Reported - German (%)
Ancestries Reported - Greek (%)
Ancestries Reported - Hungarian (%)
Ancestries Reported - Irish (%)
Ancestries Reported - Italian (%)
Ancestries Reported - Lithuanian (%)
Ancestries Reported - Norwegian (%)
Ancestries Reported - Polish (%)
Ancestries Reported - Portuguese (%)
Ancestries Reported - Russian (%)
Ancestries Reported - Scotch-Irish (%)
Ancestries Reported - Scottish (%)
Ancestries Reported - Slovak (%)
Ancestries Reported - Subsaharan African (%)
Ancestries Reported - Swedish (%)
Ancestries Reported - Swiss (%)
Ancestries Reported - Ukrainian (%)
Ancestries Reported - United States (%)
Ancestries Reported - Welsh (%)
Ancestries Reported - West Indian (%)
Ancestries Reported - Other (%)
Geographical mobility - Same house 1 year ago (%)
Geographical mobility - Same house 1 year ago (%) - White
Geographical mobility - Same house 1 year ago (%) - Black or African American
Geographical mobility - Same house 1 year ago (%) - Asian
Geographical mobility - Same house 1 year ago (%) - Hispanic or Latino
Geographical mobility - Same house 1 year ago (%) - American Indian and Alaska Native
Geographical mobility - Same house 1 year ago (%) - Multirace
Geographical mobility - Same house 1 year ago (%) - Other Race
Geographical mobility - Moved within same county (%)
Geographical mobility - Moved within same county (%) - White
Geographical mobility - Moved within same county (%) - Black or African American
Geographical mobility - Moved within same county (%) - Asian
Geographical mobility - Moved within same county (%) - Hispanic or Latino
Geographical mobility - Moved within same county (%) - American Indian and Alaska Native
Geographical mobility - Moved within same county (%) - Multirace
Geographical mobility - Moved within same county (%) - Other Race
Geographical mobility - Moved from different county within same state (%)
Geographical mobility - Moved from different county within same state (%) - White
Geographical mobility - Moved from different county within same state (%) - Black or African American
Geographical mobility - Moved from different county within same state (%) - Asian
Geographical mobility - Moved from different county within same state (%) - Hispanic or Latino
Geographical mobility - Moved from different county within same state (%) - American Indian and Alaska Native
Geographical mobility - Moved from different county within same state (%) - Multirace
Geographical mobility - Moved from different county within same state (%) - Other Race
Geographical mobility - Moved from different state (%)
Geographical mobility - Moved from different state (%) - White
Geographical mobility - Moved from different state (%) - Black or African American
Geographical mobility - Moved from different state (%) - Asian
Geographical mobility - Moved from different state (%) - Hispanic or Latino
Geographical mobility - Moved from different state (%) - American Indian and Alaska Native
Geographical mobility - Moved from different state (%) - Multirace
Geographical mobility - Moved from different state (%) - Other Race
Geographical mobility - Moved from abroad (%)
Geographical mobility - Moved from abroad (%) - White
Geographical mobility - Moved from abroad (%) - Black or African American
Geographical mobility - Moved from abroad (%) - Asian
Geographical mobility - Moved from abroad (%) - Hispanic or Latino
Geographical mobility - Moved from abroad (%) - American Indian and Alaska Native
Geographical mobility - Moved from abroad (%) - Multirace
Geographical mobility - Moved from abroad (%) - Other Race
Place of birth for the foreign-born population - Ireland (%)
Place of birth for the foreign-born population - Denmark (%)
Place of birth for the foreign-born population - Norway (%)
Place of birth for the foreign-born population - Sweden (%)
Place of birth for the foreign-born population - United Kingdom (%)
Place of birth for the foreign-born population - England (%)
Place of birth for the foreign-born population - Scotland (%)
Place of birth for the foreign-born population - Other Northern Europe (%)
Place of birth for the foreign-born population - Austria (%)
Place of birth for the foreign-born population - Belgium (%)
Place of birth for the foreign-born population - France (%)
Place of birth for the foreign-born population - Germany (%)
Place of birth for the foreign-born population - Netherlands (%)
Place of birth for the foreign-born population - Switzerland (%)
Place of birth for the foreign-born population - Other Western Europe (%)
Place of birth for the foreign-born population - Greece (%)
Place of birth for the foreign-born population - Italy (%)
Place of birth for the foreign-born population - Portugal (%)
Place of birth for the foreign-born population - Spain (%)
Place of birth for the foreign-born population - Other Southern Europe (%)
Place of birth for the foreign-born population - Albania (%)
Place of birth for the foreign-born population - Belarus (%)
Place of birth for the foreign-born population - Bosnia and Herzegovina (%)
Place of birth for the foreign-born population - Bulgaria (%)
Place of birth for the foreign-born population - Croatia (%)
Place of birth for the foreign-born population - Czechoslovakia (%)
Place of birth for the foreign-born population - Hungary (%)
Place of birth for the foreign-born population - Latvia (%)
Place of birth for the foreign-born population - Lithuania (%)
Place of birth for the foreign-born population - North Macedonia (Macedonia) (%)
Place of birth for the foreign-born population - Moldova (%)
Place of birth for the foreign-born population - Poland (%)
Place of birth for the foreign-born population - Romania (%)
Place of birth for the foreign-born population - Russia (%)
Place of birth for the foreign-born population - Serbia (%)
Place of birth for the foreign-born population - Ukraine (%)
Place of birth for the foreign-born population - Other Eastern Europe (%)
Place of birth for the foreign-born population - China (%)
Place of birth for the foreign-born population - Hong Kong (%)
Place of birth for the foreign-born population - Taiwan (%)
Place of birth for the foreign-born population - Japan (%)
Place of birth for the foreign-born population - Korea (%)
Place of birth for the foreign-born population - Other Eastern Asia (%)
Place of birth for the foreign-born population - Afghanistan (%)
Place of birth for the foreign-born population - Bangladesh (%)
Place of birth for the foreign-born population - India (%)
Place of birth for the foreign-born population - Iran (%)
Place of birth for the foreign-born population - Kazakhstan (%)
Place of birth for the foreign-born population - Nepal (%)
Place of birth for the foreign-born population - Pakistan (%)
Place of birth for the foreign-born population - Sri Lanka (%)
Place of birth for the foreign-born population - Uzbekistan (%)
Place of birth for the foreign-born population - Other South Central Asia (%)
Place of birth for the foreign-born population - Burma (%)
Place of birth for the foreign-born population - Cambodia (%)
Place of birth for the foreign-born population - Indonesia (%)
Place of birth for the foreign-born population - Laos (%)
Place of birth for the foreign-born population - Malaysia (%)
Place of birth for the foreign-born population - Philippines (%)
Place of birth for the foreign-born population - Singapore (%)
Place of birth for the foreign-born population - Thailand (%)
Place of birth for the foreign-born population - Vietnam (%)
Place of birth for the foreign-born population - Other South Eastern Asia (%)
Place of birth for the foreign-born population - Armenia (%)
Place of birth for the foreign-born population - Iraq (%)
Place of birth for the foreign-born population - Israel (%)
Place of birth for the foreign-born population - Jordan (%)
Place of birth for the foreign-born population - Kuwait (%)
Place of birth for the foreign-born population - Lebanon (%)
Place of birth for the foreign-born population - Saudi Arabia (%)
Place of birth for the foreign-born population - Syria (%)
Place of birth for the foreign-born population - Turkey (%)
Place of birth for the foreign-born population - Yemen (%)
Place of birth for the foreign-born population - Other Western Asia (%)
Place of birth for the foreign-born population - Eritrea (%)
Place of birth for the foreign-born population - Ethiopia (%)
Place of birth for the foreign-born population - Kenya (%)
Place of birth for the foreign-born population - Somalia (%)
Place of birth for the foreign-born population - Uganda (%)
Place of birth for the foreign-born population - Zimbabwe (%)
Place of birth for the foreign-born population - Other Eastern Africa (%)
Place of birth for the foreign-born population - Cameroon (%)
Place of birth for the foreign-born population - Congo (%)
Place of birth for the foreign-born population - Democratic Republic of Congo (Zaire) (%)
Place of birth for the foreign-born population - Other Middle Africa (%)
Place of birth for the foreign-born population - Egypt (%)
Place of birth for the foreign-born population - Morocco (%)
Place of birth for the foreign-born population - Sudan (%)
Place of birth for the foreign-born population - Other Northern Africa (%)
Place of birth for the foreign-born population - South Africa (%)
Place of birth for the foreign-born population - Other Southern Africa (%)
Place of birth for the foreign-born population - Cabo Verde (%)
Place of birth for the foreign-born population - Ghana (%)
Place of birth for the foreign-born population - Liberia (%)
Place of birth for the foreign-born population - Nigeria (%)
Place of birth for the foreign-born population - Senegal (%)
Place of birth for the foreign-born population - Sierra Leone (%)
Place of birth for the foreign-born population - Other Western Africa (%)
Place of birth for the foreign-born population - Australia (%)
Place of birth for the foreign-born population - New Zealand (%)
Place of birth for the foreign-born population - Fiji (%)
Place of birth for the foreign-born population - Micronesia (%)
Place of birth for the foreign-born population - Bahamas (%)
Place of birth for the foreign-born population - Barbados (%)
Place of birth for the foreign-born population - Cuba (%)
Place of birth for the foreign-born population - Dominica (%)
Place of birth for the foreign-born population - Dominican Republic (%)
Place of birth for the foreign-born population - Grenada (%)
Place of birth for the foreign-born population - Haiti (%)
Place of birth for the foreign-born population - Jamaica (%)
Place of birth for the foreign-born population - St. Vincent and the Grenadines (%)
Place of birth for the foreign-born population - Trinidad and Tobago (%)
Place of birth for the foreign-born population - West Indies (%)
Place of birth for the foreign-born population - Other Caribbean (%)
Place of birth for the foreign-born population - Belize (%)
Place of birth for the foreign-born population - Costa Rica (%)
Place of birth for the foreign-born population - El Salvador (%)
Place of birth for the foreign-born population - Guatemala (%)
Place of birth for the foreign-born population - Honduras (%)
Place of birth for the foreign-born population - Mexico (%)
Place of birth for the foreign-born population - Nicaragua (%)
Place of birth for the foreign-born population - Panama (%)
Place of birth for the foreign-born population - Other Central America (%)
Place of birth for the foreign-born population - Argentina (%)
Place of birth for the foreign-born population - Bolivia (%)
Place of birth for the foreign-born population - Brazil (%)
Place of birth for the foreign-born population - Chile (%)
Place of birth for the foreign-born population - Colombia (%)
Place of birth for the foreign-born population - Ecuador (%)
Place of birth for the foreign-born population - Guyana (%)
Place of birth for the foreign-born population - Peru (%)
Place of birth for the foreign-born population - Uruguay (%)
Place of birth for the foreign-born population - Venezuela (%)
Place of birth for the foreign-born population - Other South America (%)
Place of birth for the foreign-born population - Canada (%)
Place of birth for the foreign-born population - Other Northern America (%)
Place of birth for the foreign-born population - Other (%)
Latest news about races in Culpeper, VA collected exclusively by city-data.com from local newspapers, TV, and radio stations
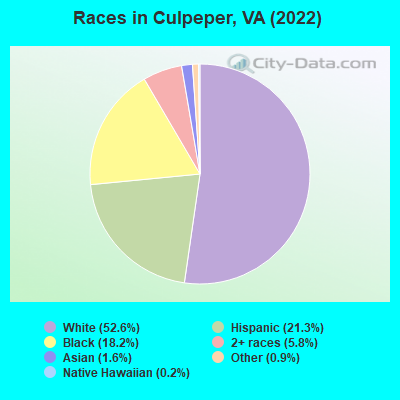
According to 2022 data, the most numerous races in Culpeper, VA are White alone (10,649 residents), Black alone (3,691 residents), and Hispanic (4,308 residents). 79.1% of Culpeper residents speak English at home. 13.5% of Culpeper, VA residents are foreign-born (9.9% born in Latin America, 1.8% born in Africa), which is 10.9% greater than the foreign-born rate of 12.0% across the entire state of Virginia.
Race distribution in Culpeper
2000 2022
4,965,637 70.2% White alone 1,376,378 19.4% Black alone 329,540 4.7% Hispanic 259,277 3.7% Asian alone 114,022 1.6% Two or more races 18,596 0.3% American Indian alone 11,685 0.2% Other race alone 3,380 0.05% Native Hawaiian and Other
5,095,130 58.7% White alone 1,594,785 18.4% Black alone 905,750 10.4% Hispanic 602,881 6.9% Asian alone 406,047 4.7% Two or more races 60,419 0.7% Other race alone 11,738 0.1% American Indian alone 6,869 0.08% Native Hawaiian and Other
Income and house value in Culpeper Median household income in 2022 $77,810 White non-Hispanic householders$100,888 Black householders$96,578 Asian householders$58,199 Some other race householders$65,552 Two or more races householders$100,971 Hispanic or Latino race householdersMedian 2022 house value $375,829 White Non-Hispanic householders$322,796 Black or African American householders $300,522 Asian householders$314,311 Hispanic or Latino householders
Median age by race in Culpeper
37.9 Median age for White residents34.4 40.8 37.9 Median age for Black or African American residents37.9 38.0 -682,215,742.8 Median age for American Indian / Alaska Native residents-682,352,940.5 -687,861,271.0 48.6 Median age for Asian residents57.6 43.5 -611,955,419.9 Median age for Native Hawaiian / Pacific Islander residents-541,531,822.5 -714,150,046.8 23.9 Median age for Other race residents24.4 24.1 15.8 Median age for Two or more races residents12.8 16.0 37.9 Median age for White alone residents34.6 40.5 22.5 Median age for Hispanic or Latino residents25.2 19.2
Owner/renter occupied households by race in Culpeper
House owners and renters - White residents 3,023 70.3% Owner occupied1,277 29.7% Renter occupiedHouse owners and renters - Black or African American residents 592 42.5% Owner occupied802 57.5% Renter occupiedHouse owners and renters - Asian residents 75 67.8% Owner occupied36 32.2% Renter occupiedHouse owners and renters - Other race residents 187 22.0% Owner occupied663 78.0% Renter occupiedHouse owners and renters - Two or more races residents 186 51.3% Owner occupied177 48.7% Renter occupiedHouse owners and renters - White alone residents 2,899 69.6% Owner occupied1,264 30.4% Renter occupiedHouse owners and renters - Hispanic or Latino residents 453 41.5% Owner occupied638 58.5% Renter occupied
Language usage in Culpeper
English speakers - Total 79.1% of residents of Culpeper speak English at home.
16.9% of residents speak Spanish at home 1,643 52.3% Speak English very well1,497 47.7% Speak English less than very well3.8% of residents speak other language at home 345 48.9% Speak English very well360 51.1% Speak English less than very well
English speakers - Born in the United States 92.3% of residents of Culpeper speak English at home.
6.2% of residents speak Spanish at home 290 78.6% Speak English very well79 21.4% Speak English less than very well1.7% of residents speak other language at home 104 100.0% Speak English very well
English speakers - Native, born elsewhere 50.0% of residents of Culpeper speak English at home.
50.4% of residents speak Spanish at home 100 82.6% Speak English very well21 17.4% Speak English less than very well
English speakers - Foreign-born 10.9% of residents of Culpeper speak English at home.
65.3% of residents speak Spanish at home 375 21.3% Speak English very well1,382 78.7% Speak English less than very well21.6% of residents speak other language at home 225 38.7% Speak English very well356 61.3% Speak English less than very well
White (Caucasian) - Speak only English Native:
96.2% (9,955)Foreign-born:
25.0% (55)
White (Caucasian) - Speak another language Native:
3.6% (371)Foreign-born:
74.0% (163)
Black or African American - Speak only English Native:
97.8% (3,079)Foreign-born:
34.6% (152)
Black or African American - Speak another language Native:
2.2% (69)Foreign-born:
63.9% (281)
Asian - Speak only English Native:
57.7% (15)Foreign-born:
9.2% (24)
Asian - Speak another language Native:
41.1% (11)Foreign-born:
90.4% (239)
Other race - Speak only English Native:
20.2% (178)Foreign-born:
3.4% (65)
Other race - Speak another language Native:
75.9% (667)Foreign-born:
95.7% (1,853)
Two or more races - Speak another language Native:
30.6% (512)Foreign-born:
100.0% (137)
White alone - Speak only English Native:
98.2% (9,782)Foreign-born:
42.9% (46)
White alone - Speak another language Native:
1.8% (183)Foreign-born:
56.2% (60)
Hispanic or Latino - Speak only English Native:
33.1% (571)Foreign-born:
3.3% (61)
Hispanic or Latino - Speak another language Native:
66.1% (1,140)Foreign-born:
96.5% (1,799)
Foreign-born residents in Culpeper 2,726 residents are foreign born (9.9% Latin America , 1.8% Africa ).
This city:
13.5%Virginia:
12.6%
Marital status for residents in Culpeper Marital status - White (Caucasian) population 15 years and over
Males 31.4% Never married54.3% Now married1.6% Separated3.8% Widowed8.9% DivorcedFemales 23.8% Never married49.4% Now married0.9% Separated7.6% Widowed18.3% DivorcedWomen who gave birth in the past 12 months Now married:
31.4% (31)Unmarried:
68.6% (68)
Women who did not give birth in the past 12 months Now married:
45.6% (1,086)Unmarried:
54.4% (1,294)
Marital status - Black or African American population 15 years and over
Males 51.2% Never married37.1% Now married2.6% Separated0.0% Widowed9.1% DivorcedFemales 38.5% Never married29.2% Now married9.6% Separated5.7% Widowed17.1% DivorcedWomen who did not give birth in the past 12 months Now married:
34.6% (327)Unmarried:
65.4% (618)
Marital status - Asian population 15 years and over
Males 0.0% Never married71.8% Now married0.0% Separated0.0% Widowed28.2% DivorcedFemales 21.3% Never married69.1% Now married0.0% Separated9.6% Widowed0.0% DivorcedWomen who did not give birth in the past 12 months Now married:
67.5% (82)Unmarried:
32.5% (39)
Marital status - Other race population 15 years and over
Males 59.4% Never married34.5% Now married3.1% Separated0.0% Widowed3.0% DivorcedFemales 63.1% Never married26.6% Now married0.0% Separated0.0% Widowed10.3% DivorcedWomen who gave birth in the past 12 months Now married:
0.0% (0)Unmarried:
100.0% (130)
Women who did not give birth in the past 12 months Now married:
33.4% (247)Unmarried:
66.6% (493)
Marital status - Two or more races population 15 years and over
Males 36.3% Never married57.7% Now married2.8% Separated0.0% Widowed3.2% DivorcedFemales 32.7% Never married52.0% Now married0.0% Separated0.0% Widowed15.2% DivorcedWomen who did not give birth in the past 12 months Now married:
55.5% (350)Unmarried:
44.5% (280)
Marital status - White alone, not Hispanic / Latino population 15 years and over
Males 31.6% Never married54.6% Now married1.8% Separated2.8% Widowed9.2% DivorcedFemales 22.7% Never married49.8% Now married1.0% Separated7.4% Widowed19.2% DivorcedWomen who gave birth in the past 12 months Now married:
31.4% (32)Unmarried:
68.6% (70)
Women who did not give birth in the past 12 months Now married:
45.1% (1,049)Unmarried:
54.9% (1,278)
Marital status - Hispanic or Latino population 15 years and over
Males 50.1% Never married40.9% Now married2.1% Separated3.5% Widowed3.4% DivorcedFemales 56.2% Never married26.9% Now married1.9% Separated2.1% Widowed12.9% DivorcedWomen who gave birth in the past 12 months Now married:
0.0% (0)Unmarried:
100.0% (105)
Women who did not give birth in the past 12 months Now married:
35.3% (327)Unmarried:
64.7% (599)
Ancestries in Culpeper
985 10.6% American627 6.8% English549 5.9% Irish454 4.9% European449 4.9% German134 1.4% French109 1.2% Italian96 1.0% Scottish85 0.9% Jamaican84 0.9% Liberian69 0.7% African66 0.7% Swedish63 0.7% Scotch-Irish45 0.5% Bahamian41 0.4% Polish36 0.4% Norwegian36 0.4% Ethiopian26 0.3% Russian25 0.3% Yugoslavian24 0.3% British20 0.2% Welsh14 0.2% Syrian14 0.2% Canadian13 0.1% French Canadian10 0.1% Haitian8 0.09% Greek7 0.08% Danish5 0.05% Trinidadian and Tobagonian4 0.04% West Indian
Geographical mobility in Culpeper Same house 1 year ago 9,741 88.0% White (Caucasian)3,266 87.7% Black or African American316 98.7% Asian46 95.3% Native Hawaiian / Pacific Islander2,840 82.8% Other race1,679 82.4% Two or more races9,263 87.4% White alone, not Hispanic / Latino3,564 84.4% Hispanic or LatinoMoved within same county 561 5.1% White / Caucasian141 3.8% Black or African American176 5.1% Other race62 3.1% Two or more races577 5.4% White alone, not Hispanic / Latino190 4.5% Hispanic or LatinoMoved within same state 699 6.3% White / Caucasian331 8.9% Black or African American14 94.3% American Indian / Alaska Native18 0.5% Other race244 12.0% Two or more races669 6.3% White alone, not Hispanic / Latino103 2.4% Hispanic or LatinoMoved from different state 70 0.6% White / Caucasian3 0.1% Black or African American319 9.3% Other race73 0.7% White alone, not Hispanic / Latino258 6.1% Hispanic or LatinoMoved from abroad 71 2.1% Other race58 2.9% Two or more races103 2.4% Hispanic or Latino
Children Nativity (place of birth) in Culpeper
Children under 6 years - Living with two parents Both parents native 713 100.0% NativeBoth parents foreign-born 153 100.0% NativeOne native, one foreign-born parent 45 100.0% NativeChildren under 6 years - Living with one parent Native parent 634 96.3% Native24 3.7% Foreign-bornForeign-born parent 286 94.8% Native16 5.2% Foreign-bornChildren 6 to 17 years - Living with two parents Both parents native 1,408 100.0% NativeBoth parents foreign-born 385 100.0% NativeOne native, one foreign-born parent 110 100.0% NativeChildren 6 to 17 years - Living with one parent Native parent 1,286 99.0% Native13 1.0% Foreign-bornForeign-born parent 236 68.6% Native108 31.4% Foreign-born
Grandparents responsible for own grandchildren in Culpeper
Grandparents (30 to 59 years) White / Caucasian 160 100.0% Not responsible for grandchildrenBlack or African American 54 58.5% Responsible for grandchildren38 41.5% Not responsible for grandchildrenAsian 8 100.0% Not responsible for grandchildrenOther race 104 100.0% Responsible for grandchildrenTwo or more races 53 100.0% Not responsible for grandchildrenWhite alone, not Hispanic / Latino 155 100.0% Not responsible for grandchildrenHispanic or Latino 88 78.6% Responsible for grandchildren24 21.4% Not responsible for grandchildrenGrandparents (60 years and over) White / Caucasian 15 24.0% Responsible for grandchildren48 76.0% Not responsible for grandchildrenBlack or African American 42 100.0% Not responsible for grandchildrenAsian 7 100.0% Not responsible for grandchildrenOther race 147 66.2% Responsible for grandchildren75 33.8% Not responsible for grandchildrenWhite alone, not Hispanic / Latino 15 37.3% Responsible for grandchildren26 62.7% Not responsible for grandchildrenHispanic or Latino 85 51.1% Responsible for grandchildren82 48.9% Not responsible for grandchildren