Races in Crest Hill, Illinois (IL) Detailed Stats
Data:
Races - White alone (%)
Races - White alone (% change since 2000)
Races - Black alone (%)
Races - Black alone (% change since 2000)
Races - American Indian alone (%)
Races - American Indian alone (% change since 2000)
Races - Asian alone (%)
Races - Asian alone (% change since 2000)
Races - Hispanic (%)
Races - Hispanic (% change since 2000)
Races - Native Hawaiian and Other Pacific Islander alone (%)
Races - Native Hawaiian and Other Pacific Islander alone (% change since 2000)
Races - Two or more races(%)
Races - Two or more races(% change since 2000)
Races - Other race alone (%)
Races - Other race alone (% change since 2000)
Racial diversity
Place of birth - Born in state of residence (%)
Place of birth - Born in state of residence (%) - White
Place of birth - Born in state of residence (%) - Black or African American
Place of birth - Born in state of residence (%) - Asian
Place of birth - Born in state of residence (%) - Hispanic or Latino
Place of birth - Born in state of residence (%) - American Indian and Alaska Native
Place of birth - Born in state of residence (%) - Multirace
Place of birth - Born in state of residence (%) - Other Race
Place of birth - Born in other state (%)
Place of birth - Born in other state (%) - White
Place of birth - Born in other state (%) - Black or African American
Place of birth - Born in other state (%) - Asian
Place of birth - Born in other state (%) - Hispanic or Latino
Place of birth - Born in other state (%) - American Indian and Alaska Native
Place of birth - Born in other state (%) - Multirace
Place of birth - Born in other state (%) - Other Race
Place of birth - Native, outside of US (%)
Place of birth - Native, outside of US (%) - White
Place of birth - Native, outside of US (%) - Black or African American
Place of birth - Native, outside of US (%) - Asian
Place of birth - Native, outside of US (%) - Hispanic or Latino
Place of birth - Native, outside of US (%) - American Indian and Alaska Native
Place of birth - Native, outside of US (%) - Multirace
Place of birth - Native, outside of US (%) - Other Race
Place of birth - Foreign born (%)
Place of birth - Foreign born (%) - White
Place of birth - Foreign born (%) - Black or African American
Place of birth - Foreign born (%) - Asian
Place of birth - Foreign born (%) - Hispanic or Latino
Place of birth - Foreign born (%) - American Indian and Alaska Native
Place of birth - Foreign born (%) - Multirace
Place of birth - Foreign born (%) - Other Race
Residents speaking English at home (%)
Residents speaking English at home - Born in the United States (%)
Residents speaking English at home - Native, born elsewhere (%)
Residents speaking English at home - Foreign born (%)
Residents speaking Spanish at home (%)
Residents speaking Spanish at home - Born in the United States (%)
Residents speaking Spanish at home - Native, born elsewhere (%)
Residents speaking Spanish at home - Foreign born (%)
Residents speaking other language at home (%)
Residents speaking other language at home - Born in the United States (%)
Residents speaking other language at home - Native, born elsewhere (%)
Residents speaking other language at home - Foreign born (%)
Marital status - Never married (%)
Marital status - Now married (%)
Marital status - Separated (%)
Marital status - Widowed (%)
Marital status - Divorced (%)
Ancestries Reported - Arab (%)
Ancestries Reported - Czech (%)
Ancestries Reported - Danish (%)
Ancestries Reported - Dutch (%)
Ancestries Reported - English (%)
Ancestries Reported - French (%)
Ancestries Reported - French Canadian (%)
Ancestries Reported - German (%)
Ancestries Reported - Greek (%)
Ancestries Reported - Hungarian (%)
Ancestries Reported - Irish (%)
Ancestries Reported - Italian (%)
Ancestries Reported - Lithuanian (%)
Ancestries Reported - Norwegian (%)
Ancestries Reported - Polish (%)
Ancestries Reported - Portuguese (%)
Ancestries Reported - Russian (%)
Ancestries Reported - Scotch-Irish (%)
Ancestries Reported - Scottish (%)
Ancestries Reported - Slovak (%)
Ancestries Reported - Subsaharan African (%)
Ancestries Reported - Swedish (%)
Ancestries Reported - Swiss (%)
Ancestries Reported - Ukrainian (%)
Ancestries Reported - United States (%)
Ancestries Reported - Welsh (%)
Ancestries Reported - West Indian (%)
Ancestries Reported - Other (%)
Geographical mobility - Same house 1 year ago (%)
Geographical mobility - Same house 1 year ago (%) - White
Geographical mobility - Same house 1 year ago (%) - Black or African American
Geographical mobility - Same house 1 year ago (%) - Asian
Geographical mobility - Same house 1 year ago (%) - Hispanic or Latino
Geographical mobility - Same house 1 year ago (%) - American Indian and Alaska Native
Geographical mobility - Same house 1 year ago (%) - Multirace
Geographical mobility - Same house 1 year ago (%) - Other Race
Geographical mobility - Moved within same county (%)
Geographical mobility - Moved within same county (%) - White
Geographical mobility - Moved within same county (%) - Black or African American
Geographical mobility - Moved within same county (%) - Asian
Geographical mobility - Moved within same county (%) - Hispanic or Latino
Geographical mobility - Moved within same county (%) - American Indian and Alaska Native
Geographical mobility - Moved within same county (%) - Multirace
Geographical mobility - Moved within same county (%) - Other Race
Geographical mobility - Moved from different county within same state (%)
Geographical mobility - Moved from different county within same state (%) - White
Geographical mobility - Moved from different county within same state (%) - Black or African American
Geographical mobility - Moved from different county within same state (%) - Asian
Geographical mobility - Moved from different county within same state (%) - Hispanic or Latino
Geographical mobility - Moved from different county within same state (%) - American Indian and Alaska Native
Geographical mobility - Moved from different county within same state (%) - Multirace
Geographical mobility - Moved from different county within same state (%) - Other Race
Geographical mobility - Moved from different state (%)
Geographical mobility - Moved from different state (%) - White
Geographical mobility - Moved from different state (%) - Black or African American
Geographical mobility - Moved from different state (%) - Asian
Geographical mobility - Moved from different state (%) - Hispanic or Latino
Geographical mobility - Moved from different state (%) - American Indian and Alaska Native
Geographical mobility - Moved from different state (%) - Multirace
Geographical mobility - Moved from different state (%) - Other Race
Geographical mobility - Moved from abroad (%)
Geographical mobility - Moved from abroad (%) - White
Geographical mobility - Moved from abroad (%) - Black or African American
Geographical mobility - Moved from abroad (%) - Asian
Geographical mobility - Moved from abroad (%) - Hispanic or Latino
Geographical mobility - Moved from abroad (%) - American Indian and Alaska Native
Geographical mobility - Moved from abroad (%) - Multirace
Geographical mobility - Moved from abroad (%) - Other Race
Place of birth for the foreign-born population - Ireland (%)
Place of birth for the foreign-born population - Denmark (%)
Place of birth for the foreign-born population - Norway (%)
Place of birth for the foreign-born population - Sweden (%)
Place of birth for the foreign-born population - United Kingdom (%)
Place of birth for the foreign-born population - England (%)
Place of birth for the foreign-born population - Scotland (%)
Place of birth for the foreign-born population - Other Northern Europe (%)
Place of birth for the foreign-born population - Austria (%)
Place of birth for the foreign-born population - Belgium (%)
Place of birth for the foreign-born population - France (%)
Place of birth for the foreign-born population - Germany (%)
Place of birth for the foreign-born population - Netherlands (%)
Place of birth for the foreign-born population - Switzerland (%)
Place of birth for the foreign-born population - Other Western Europe (%)
Place of birth for the foreign-born population - Greece (%)
Place of birth for the foreign-born population - Italy (%)
Place of birth for the foreign-born population - Portugal (%)
Place of birth for the foreign-born population - Spain (%)
Place of birth for the foreign-born population - Other Southern Europe (%)
Place of birth for the foreign-born population - Albania (%)
Place of birth for the foreign-born population - Belarus (%)
Place of birth for the foreign-born population - Bosnia and Herzegovina (%)
Place of birth for the foreign-born population - Bulgaria (%)
Place of birth for the foreign-born population - Croatia (%)
Place of birth for the foreign-born population - Czechoslovakia (%)
Place of birth for the foreign-born population - Hungary (%)
Place of birth for the foreign-born population - Latvia (%)
Place of birth for the foreign-born population - Lithuania (%)
Place of birth for the foreign-born population - North Macedonia (Macedonia) (%)
Place of birth for the foreign-born population - Moldova (%)
Place of birth for the foreign-born population - Poland (%)
Place of birth for the foreign-born population - Romania (%)
Place of birth for the foreign-born population - Russia (%)
Place of birth for the foreign-born population - Serbia (%)
Place of birth for the foreign-born population - Ukraine (%)
Place of birth for the foreign-born population - Other Eastern Europe (%)
Place of birth for the foreign-born population - China (%)
Place of birth for the foreign-born population - Hong Kong (%)
Place of birth for the foreign-born population - Taiwan (%)
Place of birth for the foreign-born population - Japan (%)
Place of birth for the foreign-born population - Korea (%)
Place of birth for the foreign-born population - Other Eastern Asia (%)
Place of birth for the foreign-born population - Afghanistan (%)
Place of birth for the foreign-born population - Bangladesh (%)
Place of birth for the foreign-born population - India (%)
Place of birth for the foreign-born population - Iran (%)
Place of birth for the foreign-born population - Kazakhstan (%)
Place of birth for the foreign-born population - Nepal (%)
Place of birth for the foreign-born population - Pakistan (%)
Place of birth for the foreign-born population - Sri Lanka (%)
Place of birth for the foreign-born population - Uzbekistan (%)
Place of birth for the foreign-born population - Other South Central Asia (%)
Place of birth for the foreign-born population - Burma (%)
Place of birth for the foreign-born population - Cambodia (%)
Place of birth for the foreign-born population - Indonesia (%)
Place of birth for the foreign-born population - Laos (%)
Place of birth for the foreign-born population - Malaysia (%)
Place of birth for the foreign-born population - Philippines (%)
Place of birth for the foreign-born population - Singapore (%)
Place of birth for the foreign-born population - Thailand (%)
Place of birth for the foreign-born population - Vietnam (%)
Place of birth for the foreign-born population - Other South Eastern Asia (%)
Place of birth for the foreign-born population - Armenia (%)
Place of birth for the foreign-born population - Iraq (%)
Place of birth for the foreign-born population - Israel (%)
Place of birth for the foreign-born population - Jordan (%)
Place of birth for the foreign-born population - Kuwait (%)
Place of birth for the foreign-born population - Lebanon (%)
Place of birth for the foreign-born population - Saudi Arabia (%)
Place of birth for the foreign-born population - Syria (%)
Place of birth for the foreign-born population - Turkey (%)
Place of birth for the foreign-born population - Yemen (%)
Place of birth for the foreign-born population - Other Western Asia (%)
Place of birth for the foreign-born population - Eritrea (%)
Place of birth for the foreign-born population - Ethiopia (%)
Place of birth for the foreign-born population - Kenya (%)
Place of birth for the foreign-born population - Somalia (%)
Place of birth for the foreign-born population - Uganda (%)
Place of birth for the foreign-born population - Zimbabwe (%)
Place of birth for the foreign-born population - Other Eastern Africa (%)
Place of birth for the foreign-born population - Cameroon (%)
Place of birth for the foreign-born population - Congo (%)
Place of birth for the foreign-born population - Democratic Republic of Congo (Zaire) (%)
Place of birth for the foreign-born population - Other Middle Africa (%)
Place of birth for the foreign-born population - Egypt (%)
Place of birth for the foreign-born population - Morocco (%)
Place of birth for the foreign-born population - Sudan (%)
Place of birth for the foreign-born population - Other Northern Africa (%)
Place of birth for the foreign-born population - South Africa (%)
Place of birth for the foreign-born population - Other Southern Africa (%)
Place of birth for the foreign-born population - Cabo Verde (%)
Place of birth for the foreign-born population - Ghana (%)
Place of birth for the foreign-born population - Liberia (%)
Place of birth for the foreign-born population - Nigeria (%)
Place of birth for the foreign-born population - Senegal (%)
Place of birth for the foreign-born population - Sierra Leone (%)
Place of birth for the foreign-born population - Other Western Africa (%)
Place of birth for the foreign-born population - Australia (%)
Place of birth for the foreign-born population - New Zealand (%)
Place of birth for the foreign-born population - Fiji (%)
Place of birth for the foreign-born population - Micronesia (%)
Place of birth for the foreign-born population - Bahamas (%)
Place of birth for the foreign-born population - Barbados (%)
Place of birth for the foreign-born population - Cuba (%)
Place of birth for the foreign-born population - Dominica (%)
Place of birth for the foreign-born population - Dominican Republic (%)
Place of birth for the foreign-born population - Grenada (%)
Place of birth for the foreign-born population - Haiti (%)
Place of birth for the foreign-born population - Jamaica (%)
Place of birth for the foreign-born population - St. Vincent and the Grenadines (%)
Place of birth for the foreign-born population - Trinidad and Tobago (%)
Place of birth for the foreign-born population - West Indies (%)
Place of birth for the foreign-born population - Other Caribbean (%)
Place of birth for the foreign-born population - Belize (%)
Place of birth for the foreign-born population - Costa Rica (%)
Place of birth for the foreign-born population - El Salvador (%)
Place of birth for the foreign-born population - Guatemala (%)
Place of birth for the foreign-born population - Honduras (%)
Place of birth for the foreign-born population - Mexico (%)
Place of birth for the foreign-born population - Nicaragua (%)
Place of birth for the foreign-born population - Panama (%)
Place of birth for the foreign-born population - Other Central America (%)
Place of birth for the foreign-born population - Argentina (%)
Place of birth for the foreign-born population - Bolivia (%)
Place of birth for the foreign-born population - Brazil (%)
Place of birth for the foreign-born population - Chile (%)
Place of birth for the foreign-born population - Colombia (%)
Place of birth for the foreign-born population - Ecuador (%)
Place of birth for the foreign-born population - Guyana (%)
Place of birth for the foreign-born population - Peru (%)
Place of birth for the foreign-born population - Uruguay (%)
Place of birth for the foreign-born population - Venezuela (%)
Place of birth for the foreign-born population - Other South America (%)
Place of birth for the foreign-born population - Canada (%)
Place of birth for the foreign-born population - Other Northern America (%)
Place of birth for the foreign-born population - Other (%)
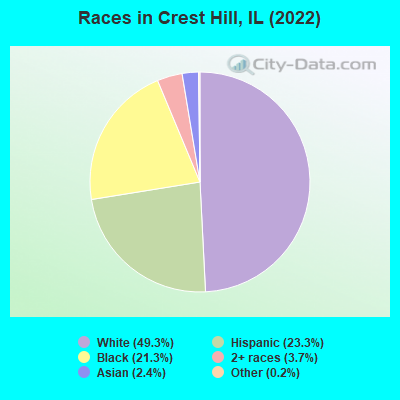
According to 2022 data, the most numerous races in Crest Hill, IL are White alone (9,795 residents), Hispanic (4,629 residents), and Black alone (4,226 residents). 77.9% of Crest Hill residents speak English at home. 9.8% of Crest Hill, IL residents are foreign-born (4.5% born in Latin America, 2.7% born in Europe, 1.7% born in Asia), which is 43.5% less than the foreign-born rate of 14.0% across the entire state of Illinois.
Race distribution in Crest Hill
2000 2022
8,424,140 67.8% White alone 1,856,152 14.9% Black alone 1,530,262 12.3% Hispanic 419,916 3.4% Asian alone 153,996 1.2% Two or more races 13,479 0.1% Other race alone 18,232 0.1% American Indian alone 3,116 0.03% Native Hawaiian and Other
7,356,301 58.5% White alone 2,299,726 18.3% Hispanic 1,660,423 13.2% Black alone 747,296 5.9% Asian alone 458,599 3.6% Two or more races 45,386 0.4% Other race alone 10,405 0.08% American Indian alone 3,896 0.03% Native Hawaiian and Other
Income and house value in Crest Hill Median household income in 2022 $65,034 White non-Hispanic householders$61,442 Black householders$66,390 Some other race householders$83,365 Two or more races householders$68,372 Hispanic or Latino race householdersMedian 2022 house value $226,104 White Non-Hispanic householders$230,405 Black or African American householders $209,924 Asian householders$191,492 Some other race householders$174,084 Two or more races householders$262,354 Hispanic or Latino householders
Median age by race in Crest Hill
48.8 Median age for White residents44.6 54.7 37.8 Median age for Black or African American residents38.7 37.8 28.6 Median age for American Indian / Alaska Native residents-764,890,281.4 -844,733,984.0 38.7 Median age for Asian residents24.5 39.2 -593,236,714.4 Median age for Native Hawaiian / Pacific Islander residents-658,536,584.7 -576,015,108.0 38.2 Median age for Other race residents38.5 40.9 27.0 Median age for Two or more races residents29.4 25.7 53.2 Median age for White alone residents47.9 58.6 28.2 Median age for Hispanic or Latino residents28.8 26.1
Owner/renter occupied households by race in Crest Hill
House owners and renters - White residents 4,089 77.1% Owner occupied1,214 22.9% Renter occupiedHouse owners and renters - Black or African American residents 407 32.8% Owner occupied835 67.2% Renter occupiedHouse owners and renters - Asian residents 143 94.5% Owner occupied8 5.5% Renter occupiedHouse owners and renters - Other race residents 396 84.4% Owner occupied73 15.6% Renter occupiedHouse owners and renters - Two or more races residents 350 50.1% Owner occupied349 49.9% Renter occupiedHouse owners and renters - White alone residents 3,942 79.5% Owner occupied1,015 20.5% Renter occupiedHouse owners and renters - Hispanic or Latino residents 803 62.6% Owner occupied480 37.4% Renter occupied
Language usage in Crest Hill
English speakers - Total 77.9% of residents of Crest Hill speak English at home.
13.7% of residents speak Spanish at home 1,739 66.7% Speak English very well869 33.3% Speak English less than very well8.0% of residents speak other language at home 962 63.3% Speak English very well557 36.7% Speak English less than very well
English speakers - Born in the United States 87.6% of residents of Crest Hill speak English at home.
7.4% of residents speak Spanish at home 121 65.1% Speak English very well65 34.9% Speak English less than very well5.0% of residents speak other language at home 95 75.4% Speak English very well31 24.6% Speak English less than very well
All residents speak only English at home
English speakers - Foreign-born 12.3% of residents of Crest Hill speak English at home.
39.1% of residents speak Spanish at home 276 33.1% Speak English very well557 66.9% Speak English less than very well47.2% of residents speak other language at home 500 49.7% Speak English very well506 50.3% Speak English less than very well
White (Caucasian) - Speak only English Native:
92.5% (9,187)Foreign-born:
26.9% (195)
White (Caucasian) - Speak another language Native:
6.6% (653)Foreign-born:
74.4% (541)
Black or African American - Speak only English Native:
97.0% (3,864)Foreign-born:
6.6% (24)
Black or African American - Speak another language Native:
3.1% (122)Foreign-born:
100.0% (371)
Asian - Speak only English Native:
39.5% (141)Foreign-born:
5.6% (16)
Asian - Speak another language Native:
65.5% (233)Foreign-born:
96.5% (272)
Other race - Speak another language Native:
68.2% (633)Foreign-born:
99.0% (383)
Two or more races - Speak only English Native:
64.9% (1,096)Foreign-born:
8.2% (31)
Two or more races - Speak another language Native:
36.4% (614)Foreign-born:
91.8% (350)
White alone - Speak only English Native:
97.7% (8,621)Foreign-born:
28.5% (177)
White alone - Speak another language Native:
2.2% (198)Foreign-born:
71.2% (441)
Hispanic or Latino - Speak only English Native:
50.2% (1,702)Foreign-born:
5.5% (48)
Hispanic or Latino - Speak another language Native:
50.0% (1,694)Foreign-born:
94.5% (815)
Foreign-born residents in Crest Hill 1,940 residents are foreign born (4.5% Latin America , 2.7% Europe , 1.7% Asia ).
This city:
9.8%Illinois:
14.1%
Marital status for residents in Crest Hill Marital status - White (Caucasian) population 15 years and over
Males 39.8% Never married42.6% Now married0.4% Separated3.4% Widowed13.9% DivorcedFemales 27.6% Never married41.8% Now married1.5% Separated15.3% Widowed13.8% DivorcedWomen who gave birth in the past 12 months Now married:
74.3% (72)Unmarried:
25.7% (25)
Women who did not give birth in the past 12 months Now married:
33.8% (622)Unmarried:
66.2% (1,219)
Marital status - Black or African American population 15 years and over
Males 72.3% Never married16.0% Now married2.4% Separated1.9% Widowed7.4% DivorcedFemales 64.0% Never married21.0% Now married0.7% Separated4.6% Widowed9.5% DivorcedWomen who gave birth in the past 12 months Now married:
100.0% (7)Unmarried:
0.0% (0)
Women who did not give birth in the past 12 months Now married:
13.7% (105)Unmarried:
86.3% (661)
Marital status - American Indian / Alaska Native population 15 years and over
Males 100.0% Never married0.0% Now married0.0% Separated0.0% Widowed0.0% DivorcedFemales 0.0% Never married33.3% Now married0.0% Separated66.7% Widowed0.0% DivorcedMarital status - Asian population 15 years and over
Males 41.3% Never married47.4% Now married3.5% Separated0.0% Widowed7.8% DivorcedFemales 26.3% Never married54.5% Now married0.0% Separated10.3% Widowed8.9% DivorcedWomen who did not give birth in the past 12 months Now married:
54.6% (103)Unmarried:
45.4% (85)
Marital status - Other race population 15 years and over
Males 46.2% Never married43.2% Now married2.2% Separated0.1% Widowed8.3% DivorcedFemales 48.2% Never married49.3% Now married0.0% Separated2.5% Widowed0.0% DivorcedWomen who did not give birth in the past 12 months Now married:
47.3% (154)Unmarried:
52.7% (172)
Marital status - Two or more races population 15 years and over
Males 48.2% Never married35.6% Now married0.3% Separated2.5% Widowed13.4% DivorcedFemales 42.4% Never married44.8% Now married0.8% Separated0.0% Widowed12.0% DivorcedWomen who gave birth in the past 12 months Now married:
51.7% (86)Unmarried:
48.3% (81)
Women who did not give birth in the past 12 months Now married:
38.3% (162)Unmarried:
61.7% (261)
Marital status - White alone, not Hispanic / Latino population 15 years and over
Males 38.8% Never married41.2% Now married0.1% Separated3.9% Widowed16.0% DivorcedFemales 23.7% Never married43.6% Now married1.5% Separated16.7% Widowed14.5% DivorcedWomen who gave birth in the past 12 months Now married:
86.5% (73)Unmarried:
13.5% (11)
Women who did not give birth in the past 12 months Now married:
34.9% (526)Unmarried:
65.1% (978)
Marital status - Hispanic or Latino population 15 years and over
Males 45.9% Never married46.6% Now married1.5% Separated0.5% Widowed5.5% DivorcedFemales 50.7% Never married40.0% Now married0.6% Separated2.9% Widowed5.8% DivorcedWomen who gave birth in the past 12 months Now married:
47.1% (69)Unmarried:
52.9% (77)
Women who did not give birth in the past 12 months Now married:
40.3% (432)Unmarried:
59.7% (641)
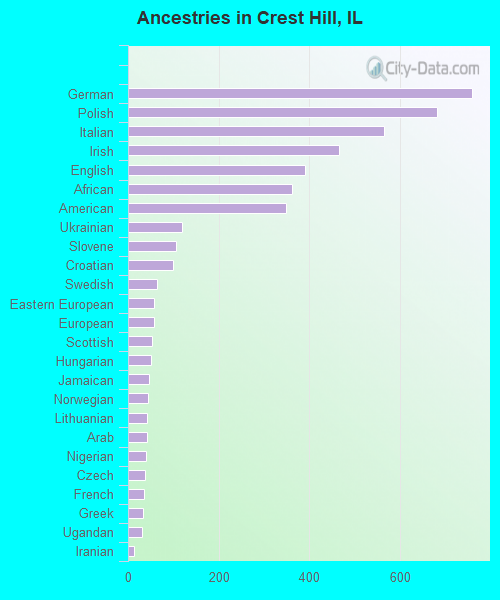
Ancestries in Crest Hill
759 7.6% German682 6.8% Polish566 5.7% Italian465 4.6% Irish391 3.9% English361 3.6% African349 3.5% American120 1.2% Ukrainian106 1.1% Slovene100 1.0% Croatian63 0.6% Swedish58 0.6% Eastern European58 0.6% European52 0.5% Scottish50 0.5% Hungarian46 0.5% Jamaican45 0.4% Norwegian43 0.4% Lithuanian41 0.4% Arab39 0.4% Nigerian37 0.4% Czech35 0.3% French34 0.3% Greek32 0.3% Ugandan14 0.1% Iranian13 0.1% Assyrian11 0.1% Scotch-Irish9 0.09% Ghanaian9 0.09% Belizean7 0.07% Romanian7 0.07% Slavic7 0.07% Welsh6 0.06% Slovak5 0.05% Lebanese5 0.05% Estonian3 0.03% Dutch
Geographical mobility in Crest Hill Same house 1 year ago 9,785 88.7% White (Caucasian)3,405 76.8% Black or African American20 99.7% American Indian / Alaska Native659 100.0% Asian1,228 91.5% Other race2,158 89.9% Two or more races8,429 87.3% White alone, not Hispanic / Latino4,331 93.7% Hispanic or LatinoMoved within same county 539 4.9% White / Caucasian325 7.3% Black or African American87 6.5% Other race135 5.6% Two or more races527 5.5% White alone, not Hispanic / Latino249 5.4% Hispanic or LatinoMoved within same state 512 4.6% White / Caucasian575 13.0% Black or African American30 2.3% Other race98 4.1% Two or more races524 5.4% White alone, not Hispanic / Latino56 1.2% Hispanic or LatinoMoved from different state 103 0.9% White / Caucasian137 3.1% Black or African American75 0.8% White alone, not Hispanic / Latino20 0.4% Hispanic or LatinoMoved from abroad 31 0.3% White32 0.3% White alone, not Hispanic / Latino
Children Nativity (place of birth) in Crest Hill
Children under 6 years - Living with two parents Both parents native 352 100.0% NativeBoth parents foreign-born 138 100.0% NativeOne native, one foreign-born parent 79 100.0% NativeChildren under 6 years - Living with one parent Native parent 385 100.0% NativeForeign-born parent 32 100.0% NativeChildren 6 to 17 years - Living with two parents Both parents native 564 88.4% Native74 11.6% Foreign-bornBoth parents foreign-born 208 82.4% Native44 17.6% Foreign-bornOne native, one foreign-born parent 168 100.0% NativeChildren 6 to 17 years - Living with one parent Native parent 759 100.0% NativeForeign-born parent 73 47.4% Native81 52.6% Foreign-born
Grandparents responsible for own grandchildren in Crest Hill
Grandparents (30 to 59 years) White / Caucasian 14 26.5% Responsible for grandchildren39 73.5% Not responsible for grandchildrenBlack or African American 5 100.0% Not responsible for grandchildrenTwo or more races 88 100.0% Not responsible for grandchildrenWhite alone, not Hispanic / Latino 19 60.6% Responsible for grandchildren13 39.4% Not responsible for grandchildrenHispanic or Latino 69 100.0% Not responsible for grandchildrenGrandparents (60 years and over) White / Caucasian 10 28.0% Responsible for grandchildren25 72.0% Not responsible for grandchildrenBlack or African American 91 91.1% Responsible for grandchildren9 8.9% Not responsible for grandchildrenWhite alone, not Hispanic / Latino 11 29.1% Responsible for grandchildren26 70.9% Not responsible for grandchildren