Races in Countryside, Illinois (IL) Detailed Stats
Data:
Races - White alone (%)
Races - White alone (% change since 2000)
Races - Black alone (%)
Races - Black alone (% change since 2000)
Races - American Indian alone (%)
Races - American Indian alone (% change since 2000)
Races - Asian alone (%)
Races - Asian alone (% change since 2000)
Races - Hispanic (%)
Races - Hispanic (% change since 2000)
Races - Native Hawaiian and Other Pacific Islander alone (%)
Races - Native Hawaiian and Other Pacific Islander alone (% change since 2000)
Races - Two or more races(%)
Races - Two or more races(% change since 2000)
Races - Other race alone (%)
Races - Other race alone (% change since 2000)
Racial diversity
Place of birth - Born in state of residence (%)
Place of birth - Born in state of residence (%) - White
Place of birth - Born in state of residence (%) - Black or African American
Place of birth - Born in state of residence (%) - Asian
Place of birth - Born in state of residence (%) - Hispanic or Latino
Place of birth - Born in state of residence (%) - American Indian and Alaska Native
Place of birth - Born in state of residence (%) - Multirace
Place of birth - Born in state of residence (%) - Other Race
Place of birth - Born in other state (%)
Place of birth - Born in other state (%) - White
Place of birth - Born in other state (%) - Black or African American
Place of birth - Born in other state (%) - Asian
Place of birth - Born in other state (%) - Hispanic or Latino
Place of birth - Born in other state (%) - American Indian and Alaska Native
Place of birth - Born in other state (%) - Multirace
Place of birth - Born in other state (%) - Other Race
Place of birth - Native, outside of US (%)
Place of birth - Native, outside of US (%) - White
Place of birth - Native, outside of US (%) - Black or African American
Place of birth - Native, outside of US (%) - Asian
Place of birth - Native, outside of US (%) - Hispanic or Latino
Place of birth - Native, outside of US (%) - American Indian and Alaska Native
Place of birth - Native, outside of US (%) - Multirace
Place of birth - Native, outside of US (%) - Other Race
Place of birth - Foreign born (%)
Place of birth - Foreign born (%) - White
Place of birth - Foreign born (%) - Black or African American
Place of birth - Foreign born (%) - Asian
Place of birth - Foreign born (%) - Hispanic or Latino
Place of birth - Foreign born (%) - American Indian and Alaska Native
Place of birth - Foreign born (%) - Multirace
Place of birth - Foreign born (%) - Other Race
Residents speaking English at home (%)
Residents speaking English at home - Born in the United States (%)
Residents speaking English at home - Native, born elsewhere (%)
Residents speaking English at home - Foreign born (%)
Residents speaking Spanish at home (%)
Residents speaking Spanish at home - Born in the United States (%)
Residents speaking Spanish at home - Native, born elsewhere (%)
Residents speaking Spanish at home - Foreign born (%)
Residents speaking other language at home (%)
Residents speaking other language at home - Born in the United States (%)
Residents speaking other language at home - Native, born elsewhere (%)
Residents speaking other language at home - Foreign born (%)
Marital status - Never married (%)
Marital status - Now married (%)
Marital status - Separated (%)
Marital status - Widowed (%)
Marital status - Divorced (%)
Ancestries Reported - Arab (%)
Ancestries Reported - Czech (%)
Ancestries Reported - Danish (%)
Ancestries Reported - Dutch (%)
Ancestries Reported - English (%)
Ancestries Reported - French (%)
Ancestries Reported - French Canadian (%)
Ancestries Reported - German (%)
Ancestries Reported - Greek (%)
Ancestries Reported - Hungarian (%)
Ancestries Reported - Irish (%)
Ancestries Reported - Italian (%)
Ancestries Reported - Lithuanian (%)
Ancestries Reported - Norwegian (%)
Ancestries Reported - Polish (%)
Ancestries Reported - Portuguese (%)
Ancestries Reported - Russian (%)
Ancestries Reported - Scotch-Irish (%)
Ancestries Reported - Scottish (%)
Ancestries Reported - Slovak (%)
Ancestries Reported - Subsaharan African (%)
Ancestries Reported - Swedish (%)
Ancestries Reported - Swiss (%)
Ancestries Reported - Ukrainian (%)
Ancestries Reported - United States (%)
Ancestries Reported - Welsh (%)
Ancestries Reported - West Indian (%)
Ancestries Reported - Other (%)
Geographical mobility - Same house 1 year ago (%)
Geographical mobility - Same house 1 year ago (%) - White
Geographical mobility - Same house 1 year ago (%) - Black or African American
Geographical mobility - Same house 1 year ago (%) - Asian
Geographical mobility - Same house 1 year ago (%) - Hispanic or Latino
Geographical mobility - Same house 1 year ago (%) - American Indian and Alaska Native
Geographical mobility - Same house 1 year ago (%) - Multirace
Geographical mobility - Same house 1 year ago (%) - Other Race
Geographical mobility - Moved within same county (%)
Geographical mobility - Moved within same county (%) - White
Geographical mobility - Moved within same county (%) - Black or African American
Geographical mobility - Moved within same county (%) - Asian
Geographical mobility - Moved within same county (%) - Hispanic or Latino
Geographical mobility - Moved within same county (%) - American Indian and Alaska Native
Geographical mobility - Moved within same county (%) - Multirace
Geographical mobility - Moved within same county (%) - Other Race
Geographical mobility - Moved from different county within same state (%)
Geographical mobility - Moved from different county within same state (%) - White
Geographical mobility - Moved from different county within same state (%) - Black or African American
Geographical mobility - Moved from different county within same state (%) - Asian
Geographical mobility - Moved from different county within same state (%) - Hispanic or Latino
Geographical mobility - Moved from different county within same state (%) - American Indian and Alaska Native
Geographical mobility - Moved from different county within same state (%) - Multirace
Geographical mobility - Moved from different county within same state (%) - Other Race
Geographical mobility - Moved from different state (%)
Geographical mobility - Moved from different state (%) - White
Geographical mobility - Moved from different state (%) - Black or African American
Geographical mobility - Moved from different state (%) - Asian
Geographical mobility - Moved from different state (%) - Hispanic or Latino
Geographical mobility - Moved from different state (%) - American Indian and Alaska Native
Geographical mobility - Moved from different state (%) - Multirace
Geographical mobility - Moved from different state (%) - Other Race
Geographical mobility - Moved from abroad (%)
Geographical mobility - Moved from abroad (%) - White
Geographical mobility - Moved from abroad (%) - Black or African American
Geographical mobility - Moved from abroad (%) - Asian
Geographical mobility - Moved from abroad (%) - Hispanic or Latino
Geographical mobility - Moved from abroad (%) - American Indian and Alaska Native
Geographical mobility - Moved from abroad (%) - Multirace
Geographical mobility - Moved from abroad (%) - Other Race
Place of birth for the foreign-born population - Ireland (%)
Place of birth for the foreign-born population - Denmark (%)
Place of birth for the foreign-born population - Norway (%)
Place of birth for the foreign-born population - Sweden (%)
Place of birth for the foreign-born population - United Kingdom (%)
Place of birth for the foreign-born population - England (%)
Place of birth for the foreign-born population - Scotland (%)
Place of birth for the foreign-born population - Other Northern Europe (%)
Place of birth for the foreign-born population - Austria (%)
Place of birth for the foreign-born population - Belgium (%)
Place of birth for the foreign-born population - France (%)
Place of birth for the foreign-born population - Germany (%)
Place of birth for the foreign-born population - Netherlands (%)
Place of birth for the foreign-born population - Switzerland (%)
Place of birth for the foreign-born population - Other Western Europe (%)
Place of birth for the foreign-born population - Greece (%)
Place of birth for the foreign-born population - Italy (%)
Place of birth for the foreign-born population - Portugal (%)
Place of birth for the foreign-born population - Spain (%)
Place of birth for the foreign-born population - Other Southern Europe (%)
Place of birth for the foreign-born population - Albania (%)
Place of birth for the foreign-born population - Belarus (%)
Place of birth for the foreign-born population - Bosnia and Herzegovina (%)
Place of birth for the foreign-born population - Bulgaria (%)
Place of birth for the foreign-born population - Croatia (%)
Place of birth for the foreign-born population - Czechoslovakia (%)
Place of birth for the foreign-born population - Hungary (%)
Place of birth for the foreign-born population - Latvia (%)
Place of birth for the foreign-born population - Lithuania (%)
Place of birth for the foreign-born population - North Macedonia (Macedonia) (%)
Place of birth for the foreign-born population - Moldova (%)
Place of birth for the foreign-born population - Poland (%)
Place of birth for the foreign-born population - Romania (%)
Place of birth for the foreign-born population - Russia (%)
Place of birth for the foreign-born population - Serbia (%)
Place of birth for the foreign-born population - Ukraine (%)
Place of birth for the foreign-born population - Other Eastern Europe (%)
Place of birth for the foreign-born population - China (%)
Place of birth for the foreign-born population - Hong Kong (%)
Place of birth for the foreign-born population - Taiwan (%)
Place of birth for the foreign-born population - Japan (%)
Place of birth for the foreign-born population - Korea (%)
Place of birth for the foreign-born population - Other Eastern Asia (%)
Place of birth for the foreign-born population - Afghanistan (%)
Place of birth for the foreign-born population - Bangladesh (%)
Place of birth for the foreign-born population - India (%)
Place of birth for the foreign-born population - Iran (%)
Place of birth for the foreign-born population - Kazakhstan (%)
Place of birth for the foreign-born population - Nepal (%)
Place of birth for the foreign-born population - Pakistan (%)
Place of birth for the foreign-born population - Sri Lanka (%)
Place of birth for the foreign-born population - Uzbekistan (%)
Place of birth for the foreign-born population - Other South Central Asia (%)
Place of birth for the foreign-born population - Burma (%)
Place of birth for the foreign-born population - Cambodia (%)
Place of birth for the foreign-born population - Indonesia (%)
Place of birth for the foreign-born population - Laos (%)
Place of birth for the foreign-born population - Malaysia (%)
Place of birth for the foreign-born population - Philippines (%)
Place of birth for the foreign-born population - Singapore (%)
Place of birth for the foreign-born population - Thailand (%)
Place of birth for the foreign-born population - Vietnam (%)
Place of birth for the foreign-born population - Other South Eastern Asia (%)
Place of birth for the foreign-born population - Armenia (%)
Place of birth for the foreign-born population - Iraq (%)
Place of birth for the foreign-born population - Israel (%)
Place of birth for the foreign-born population - Jordan (%)
Place of birth for the foreign-born population - Kuwait (%)
Place of birth for the foreign-born population - Lebanon (%)
Place of birth for the foreign-born population - Saudi Arabia (%)
Place of birth for the foreign-born population - Syria (%)
Place of birth for the foreign-born population - Turkey (%)
Place of birth for the foreign-born population - Yemen (%)
Place of birth for the foreign-born population - Other Western Asia (%)
Place of birth for the foreign-born population - Eritrea (%)
Place of birth for the foreign-born population - Ethiopia (%)
Place of birth for the foreign-born population - Kenya (%)
Place of birth for the foreign-born population - Somalia (%)
Place of birth for the foreign-born population - Uganda (%)
Place of birth for the foreign-born population - Zimbabwe (%)
Place of birth for the foreign-born population - Other Eastern Africa (%)
Place of birth for the foreign-born population - Cameroon (%)
Place of birth for the foreign-born population - Congo (%)
Place of birth for the foreign-born population - Democratic Republic of Congo (Zaire) (%)
Place of birth for the foreign-born population - Other Middle Africa (%)
Place of birth for the foreign-born population - Egypt (%)
Place of birth for the foreign-born population - Morocco (%)
Place of birth for the foreign-born population - Sudan (%)
Place of birth for the foreign-born population - Other Northern Africa (%)
Place of birth for the foreign-born population - South Africa (%)
Place of birth for the foreign-born population - Other Southern Africa (%)
Place of birth for the foreign-born population - Cabo Verde (%)
Place of birth for the foreign-born population - Ghana (%)
Place of birth for the foreign-born population - Liberia (%)
Place of birth for the foreign-born population - Nigeria (%)
Place of birth for the foreign-born population - Senegal (%)
Place of birth for the foreign-born population - Sierra Leone (%)
Place of birth for the foreign-born population - Other Western Africa (%)
Place of birth for the foreign-born population - Australia (%)
Place of birth for the foreign-born population - New Zealand (%)
Place of birth for the foreign-born population - Fiji (%)
Place of birth for the foreign-born population - Micronesia (%)
Place of birth for the foreign-born population - Bahamas (%)
Place of birth for the foreign-born population - Barbados (%)
Place of birth for the foreign-born population - Cuba (%)
Place of birth for the foreign-born population - Dominica (%)
Place of birth for the foreign-born population - Dominican Republic (%)
Place of birth for the foreign-born population - Grenada (%)
Place of birth for the foreign-born population - Haiti (%)
Place of birth for the foreign-born population - Jamaica (%)
Place of birth for the foreign-born population - St. Vincent and the Grenadines (%)
Place of birth for the foreign-born population - Trinidad and Tobago (%)
Place of birth for the foreign-born population - West Indies (%)
Place of birth for the foreign-born population - Other Caribbean (%)
Place of birth for the foreign-born population - Belize (%)
Place of birth for the foreign-born population - Costa Rica (%)
Place of birth for the foreign-born population - El Salvador (%)
Place of birth for the foreign-born population - Guatemala (%)
Place of birth for the foreign-born population - Honduras (%)
Place of birth for the foreign-born population - Mexico (%)
Place of birth for the foreign-born population - Nicaragua (%)
Place of birth for the foreign-born population - Panama (%)
Place of birth for the foreign-born population - Other Central America (%)
Place of birth for the foreign-born population - Argentina (%)
Place of birth for the foreign-born population - Bolivia (%)
Place of birth for the foreign-born population - Brazil (%)
Place of birth for the foreign-born population - Chile (%)
Place of birth for the foreign-born population - Colombia (%)
Place of birth for the foreign-born population - Ecuador (%)
Place of birth for the foreign-born population - Guyana (%)
Place of birth for the foreign-born population - Peru (%)
Place of birth for the foreign-born population - Uruguay (%)
Place of birth for the foreign-born population - Venezuela (%)
Place of birth for the foreign-born population - Other South America (%)
Place of birth for the foreign-born population - Canada (%)
Place of birth for the foreign-born population - Other Northern America (%)
Place of birth for the foreign-born population - Other (%)
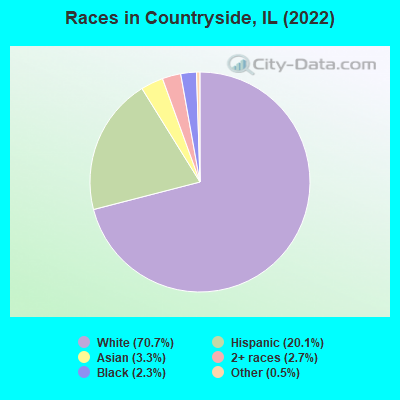
According to 2022 data, the most numerous races in Countryside, IL are White alone (4,372 residents), Hispanic (1,243 residents), and Black alone (140 residents). 71.2% of Countryside residents speak English at home. 21.2% of Countryside, IL residents are foreign-born (10.0% born in Europe, 8.7% born in Latin America), which is 33.9% greater than the foreign-born rate of 14.0% across the entire state of Illinois.
Race distribution in Countryside
2000 2022
8,424,140 67.8% White alone 1,856,152 14.9% Black alone 1,530,262 12.3% Hispanic 419,916 3.4% Asian alone 153,996 1.2% Two or more races 13,479 0.1% Other race alone 18,232 0.1% American Indian alone 3,116 0.03% Native Hawaiian and Other
7,356,301 58.5% White alone 2,299,726 18.3% Hispanic 1,660,423 13.2% Black alone 747,296 5.9% Asian alone 458,599 3.6% Two or more races 45,386 0.4% Other race alone 10,405 0.08% American Indian alone 3,896 0.03% Native Hawaiian and Other
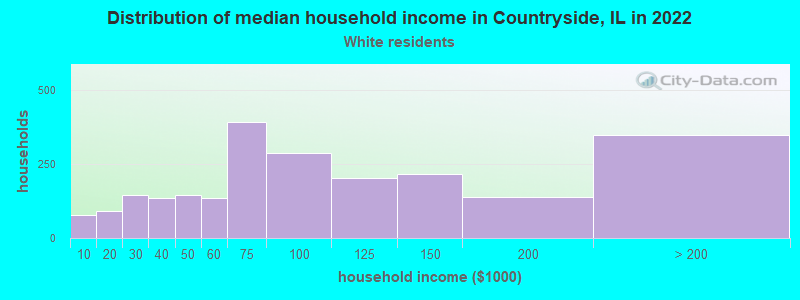
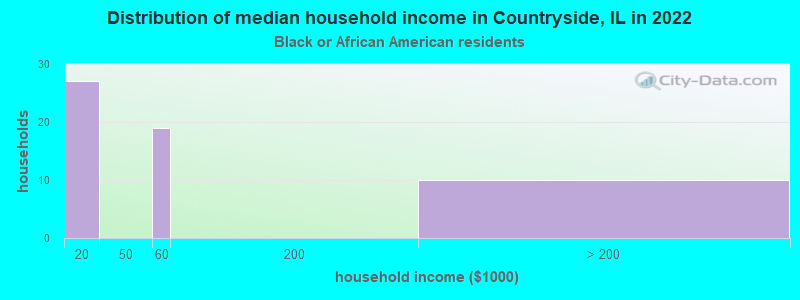
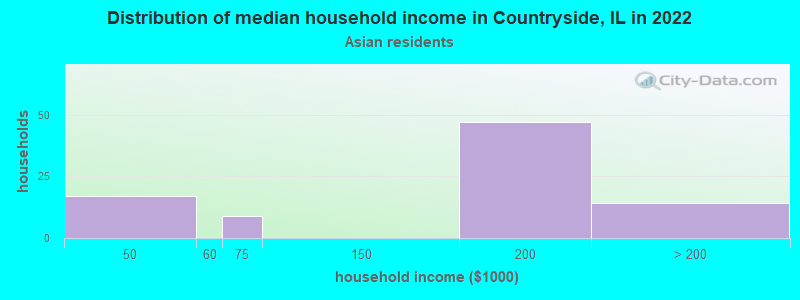
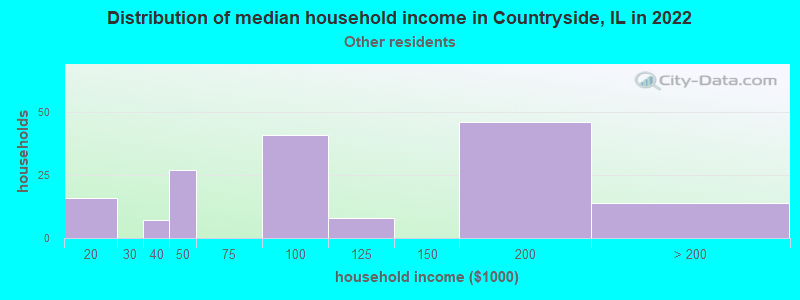
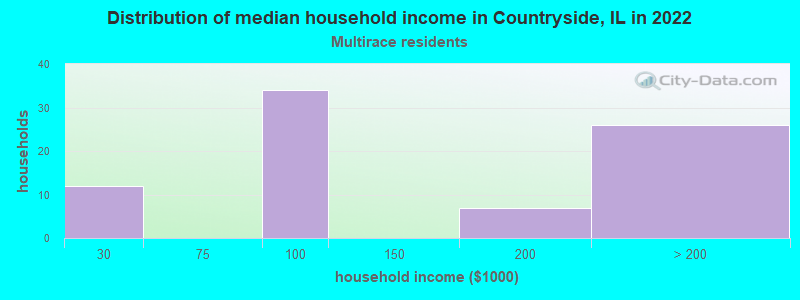
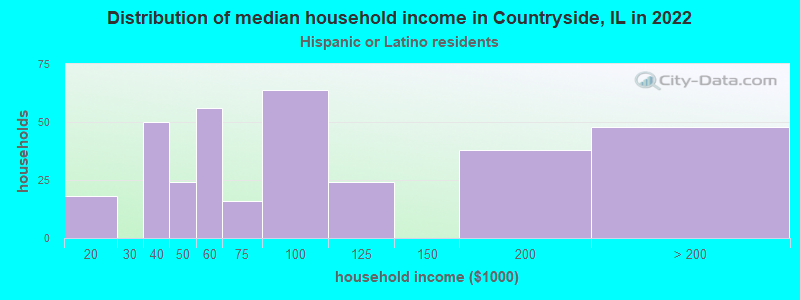
Income and house value in Countryside Median household income in 2022 $78,146 White non-Hispanic householders$157,822 Asian householders$82,250 Some other race householders$91,367 Two or more races householders$76,259 Hispanic or Latino race householdersMedian 2022 house value $364,091 White Non-Hispanic householders$406,553 American Indian or Alaska Native householders $293,622 Asian householders$632,416 Some other race householders$346,383 Two or more races householders$626,815 Hispanic or Latino householders
Median age by race in Countryside
54.1 Median age for White residents51.7 55.3 29.5 Median age for Black or African American residents29.5 31.9 -680,473,372.1 Median age for American Indian / Alaska Native residents-736,736,736.0 -641,399,416.3 43.9 Median age for Asian residents32.9 52.1 -687,999,999.3 Median age for Native Hawaiian / Pacific Islander residents-918,721,460.3 -610,229,276.3 34.7 Median age for Other race residents34.5 41.3 17.6 Median age for Two or more races residents13.5 18.8 54.6 Median age for White alone residents53.5 57.0 29.0 Median age for Hispanic or Latino residents34.6 22.3
Owner/renter occupied households by race in Countryside
House owners and renters - White residents 1,640 71.3% Owner occupied659 28.7% Renter occupiedHouse owners and renters - Black or African American residents 10 18.1% Owner occupied46 81.9% Renter occupiedHouse owners and renters - Asian residents 59 71.0% Owner occupied24 29.0% Renter occupiedHouse owners and renters - Other race residents 71 42.1% Owner occupied97 57.9% Renter occupiedHouse owners and renters - Two or more races residents 83 100.0% Owner occupiedHouse owners and renters - White alone residents 1,641 70.9% Owner occupied674 29.1% Renter occupiedHouse owners and renters - Hispanic or Latino residents 211 60.4% Owner occupied138 39.6% Renter occupied
Language usage in Countryside
English speakers - Total 71.2% of residents of Countryside speak English at home.
13.7% of residents speak Spanish at home 538 65.5% Speak English very well284 34.5% Speak English less than very well14.9% of residents speak other language at home 592 66.2% Speak English very well302 33.8% Speak English less than very well
English speakers - Born in the United States 94.5% of residents of Countryside speak English at home.
2.5% of residents speak Spanish at home 20 100.0% Speak English very well2.7% of residents speak other language at home 21 100.0% Speak English very well
English speakers - Native, born elsewhere 0.0% of residents of Countryside speak English at home.
88.9% of residents speak other language at home 8 100.0% Speak English very well
English speakers - Foreign-born 15.4% of residents of Countryside speak English at home.
33.9% of residents speak Spanish at home 192 43.2% Speak English very well252 56.8% Speak English less than very well50.1% of residents speak other language at home 352 53.7% Speak English very well304 46.3% Speak English less than very well
White (Caucasian) - Speak only English Native:
96.1% (3,373)Foreign-born:
23.1% (170)
White (Caucasian) - Speak another language Native:
6.0% (210)Foreign-born:
77.6% (571)
Asian - Speak only English Native:
66.9% (84)Foreign-born:
6.6% (5)
Asian - Speak another language Native:
33.2% (42)Foreign-born:
94.0% (76)
Other race - Speak another language Native:
92.2% (220)Foreign-born:
100.0% (265)
Two or more races - Speak another language Native:
17.2% (93)Foreign-born:
100.0% (46)
White alone - Speak only English Native:
93.0% (3,367)Foreign-born:
12.4% (83)
White alone - Speak another language Native:
6.9% (248)Foreign-born:
88.0% (588)
Hispanic or Latino - Speak only English Native:
49.1% (316)Foreign-born:
19.2% (106)
Hispanic or Latino - Speak another language Native:
51.9% (334)Foreign-born:
79.0% (437)
Foreign-born residents in Countryside 1,310 residents are foreign born (10.0% Europe , 8.7% Latin America ).
This city:
21.2%Illinois:
14.1%
Marital status for residents in Countryside Marital status - White (Caucasian) population 15 years and over
Males 39.5% Never married46.1% Now married2.0% Separated2.8% Widowed9.7% DivorcedFemales 27.1% Never married43.0% Now married1.3% Separated9.7% Widowed19.0% DivorcedWomen who gave birth in the past 12 months Now married:
73.5% (64)Unmarried:
26.5% (23)
Women who did not give birth in the past 12 months Now married:
33.9% (242)Unmarried:
66.1% (470)
Marital status - Black or African American population 15 years and over
Males 86.8% Never married13.2% Now married0.0% Separated0.0% Widowed0.0% DivorcedFemales 73.5% Never married20.4% Now married0.0% Separated0.0% Widowed6.1% DivorcedWomen who did not give birth in the past 12 months Now married:
0.0% (0)Unmarried:
100.0% (34)
Marital status - Asian population 15 years and over
Males 17.2% Never married82.8% Now married0.0% Separated0.0% Widowed0.0% DivorcedFemales 39.2% Never married60.8% Now married0.0% Separated0.0% Widowed0.0% DivorcedWomen who did not give birth in the past 12 months Now married:
17.5% (10)Unmarried:
82.5% (47)
Marital status - Other race population 15 years and over
Males 45.9% Never married54.1% Now married0.0% Separated0.0% Widowed0.0% DivorcedFemales 44.5% Never married50.7% Now married4.8% Separated0.0% Widowed0.0% DivorcedWomen who did not give birth in the past 12 months Now married:
46.3% (91)Unmarried:
53.7% (106)
Marital status - Two or more races population 15 years and over
Males 61.0% Never married25.4% Now married0.0% Separated0.0% Widowed13.6% DivorcedFemales 80.1% Never married8.2% Now married7.7% Separated0.0% Widowed4.1% DivorcedWomen who did not give birth in the past 12 months Now married:
12.8% (32)Unmarried:
87.2% (218)
Marital status - White alone, not Hispanic / Latino population 15 years and over
Males 35.4% Never married48.1% Now married2.3% Separated3.2% Widowed11.1% DivorcedFemales 24.8% Never married43.4% Now married1.3% Separated10.2% Widowed20.1% DivorcedWomen who gave birth in the past 12 months Now married:
73.5% (71)Unmarried:
26.5% (26)
Women who did not give birth in the past 12 months Now married:
35.6% (246)Unmarried:
64.4% (444)
Marital status - Hispanic or Latino population 15 years and over
Males 61.1% Never married37.2% Now married0.0% Separated0.0% Widowed1.7% DivorcedFemales 55.3% Never married39.0% Now married5.6% Separated0.0% Widowed0.0% DivorcedWomen who did not give birth in the past 12 months Now married:
34.7% (131)Unmarried:
65.3% (247)
Ancestries in Countryside
294 10.4% Polish235 8.3% Macedonian159 5.6% Italian138 4.9% Irish132 4.7% German94 3.3% Czech90 3.2% Serbian87 3.1% Croatian68 2.4% Yugoslavian60 2.1% English54 1.9% Northern European52 1.8% Austrian45 1.6% Swedish44 1.6% Lithuanian39 1.4% American38 1.3% European32 1.1% Dutch32 1.1% Turkish15 0.5% Eastern European15 0.5% Ukrainian14 0.5% Russian7 0.2% Greek6 0.2% Czechoslovakian
Children Nativity (place of birth) in Countryside
Children under 6 years - Living with two parents Both parents native 104 100.0% NativeBoth parents foreign-born 26 100.0% NativeOne native, one foreign-born parent 13 100.0% NativeChildren under 6 years - Living with one parent Native parent 47 100.0% NativeForeign-born parent 7 100.0% NativeChildren 6 to 17 years - Living with two parents Both parents native 361 100.0% NativeBoth parents foreign-born 45 67.6% Native22 32.4% Foreign-bornOne native, one foreign-born parent 77 100.0% NativeChildren 6 to 17 years - Living with one parent Native parent 279 100.0% NativeForeign-born parent 72 50.1% Native72 49.9% Foreign-born
Grandparents responsible for own grandchildren in Countryside
Grandparents (30 to 59 years) Black or African American 22 100.0% Responsible for grandchildren
Grandparents (60 years and over)