Races in Concord, North Carolina (NC) Detailed Stats
Data:
Races - White alone (%)
Races - White alone (% change since 2000)
Races - Black alone (%)
Races - Black alone (% change since 2000)
Races - American Indian alone (%)
Races - American Indian alone (% change since 2000)
Races - Asian alone (%)
Races - Asian alone (% change since 2000)
Races - Hispanic (%)
Races - Hispanic (% change since 2000)
Races - Native Hawaiian and Other Pacific Islander alone (%)
Races - Native Hawaiian and Other Pacific Islander alone (% change since 2000)
Races - Two or more races(%)
Races - Two or more races(% change since 2000)
Races - Other race alone (%)
Races - Other race alone (% change since 2000)
Racial diversity
Place of birth - Born in state of residence (%)
Place of birth - Born in state of residence (%) - White
Place of birth - Born in state of residence (%) - Black or African American
Place of birth - Born in state of residence (%) - Asian
Place of birth - Born in state of residence (%) - Hispanic or Latino
Place of birth - Born in state of residence (%) - American Indian and Alaska Native
Place of birth - Born in state of residence (%) - Multirace
Place of birth - Born in state of residence (%) - Other Race
Place of birth - Born in other state (%)
Place of birth - Born in other state (%) - White
Place of birth - Born in other state (%) - Black or African American
Place of birth - Born in other state (%) - Asian
Place of birth - Born in other state (%) - Hispanic or Latino
Place of birth - Born in other state (%) - American Indian and Alaska Native
Place of birth - Born in other state (%) - Multirace
Place of birth - Born in other state (%) - Other Race
Place of birth - Native, outside of US (%)
Place of birth - Native, outside of US (%) - White
Place of birth - Native, outside of US (%) - Black or African American
Place of birth - Native, outside of US (%) - Asian
Place of birth - Native, outside of US (%) - Hispanic or Latino
Place of birth - Native, outside of US (%) - American Indian and Alaska Native
Place of birth - Native, outside of US (%) - Multirace
Place of birth - Native, outside of US (%) - Other Race
Place of birth - Foreign born (%)
Place of birth - Foreign born (%) - White
Place of birth - Foreign born (%) - Black or African American
Place of birth - Foreign born (%) - Asian
Place of birth - Foreign born (%) - Hispanic or Latino
Place of birth - Foreign born (%) - American Indian and Alaska Native
Place of birth - Foreign born (%) - Multirace
Place of birth - Foreign born (%) - Other Race
Residents speaking English at home (%)
Residents speaking English at home - Born in the United States (%)
Residents speaking English at home - Native, born elsewhere (%)
Residents speaking English at home - Foreign born (%)
Residents speaking Spanish at home (%)
Residents speaking Spanish at home - Born in the United States (%)
Residents speaking Spanish at home - Native, born elsewhere (%)
Residents speaking Spanish at home - Foreign born (%)
Residents speaking other language at home (%)
Residents speaking other language at home - Born in the United States (%)
Residents speaking other language at home - Native, born elsewhere (%)
Residents speaking other language at home - Foreign born (%)
Marital status - Never married (%)
Marital status - Now married (%)
Marital status - Separated (%)
Marital status - Widowed (%)
Marital status - Divorced (%)
Ancestries Reported - Arab (%)
Ancestries Reported - Czech (%)
Ancestries Reported - Danish (%)
Ancestries Reported - Dutch (%)
Ancestries Reported - English (%)
Ancestries Reported - French (%)
Ancestries Reported - French Canadian (%)
Ancestries Reported - German (%)
Ancestries Reported - Greek (%)
Ancestries Reported - Hungarian (%)
Ancestries Reported - Irish (%)
Ancestries Reported - Italian (%)
Ancestries Reported - Lithuanian (%)
Ancestries Reported - Norwegian (%)
Ancestries Reported - Polish (%)
Ancestries Reported - Portuguese (%)
Ancestries Reported - Russian (%)
Ancestries Reported - Scotch-Irish (%)
Ancestries Reported - Scottish (%)
Ancestries Reported - Slovak (%)
Ancestries Reported - Subsaharan African (%)
Ancestries Reported - Swedish (%)
Ancestries Reported - Swiss (%)
Ancestries Reported - Ukrainian (%)
Ancestries Reported - United States (%)
Ancestries Reported - Welsh (%)
Ancestries Reported - West Indian (%)
Ancestries Reported - Other (%)
Geographical mobility - Same house 1 year ago (%)
Geographical mobility - Same house 1 year ago (%) - White
Geographical mobility - Same house 1 year ago (%) - Black or African American
Geographical mobility - Same house 1 year ago (%) - Asian
Geographical mobility - Same house 1 year ago (%) - Hispanic or Latino
Geographical mobility - Same house 1 year ago (%) - American Indian and Alaska Native
Geographical mobility - Same house 1 year ago (%) - Multirace
Geographical mobility - Same house 1 year ago (%) - Other Race
Geographical mobility - Moved within same county (%)
Geographical mobility - Moved within same county (%) - White
Geographical mobility - Moved within same county (%) - Black or African American
Geographical mobility - Moved within same county (%) - Asian
Geographical mobility - Moved within same county (%) - Hispanic or Latino
Geographical mobility - Moved within same county (%) - American Indian and Alaska Native
Geographical mobility - Moved within same county (%) - Multirace
Geographical mobility - Moved within same county (%) - Other Race
Geographical mobility - Moved from different county within same state (%)
Geographical mobility - Moved from different county within same state (%) - White
Geographical mobility - Moved from different county within same state (%) - Black or African American
Geographical mobility - Moved from different county within same state (%) - Asian
Geographical mobility - Moved from different county within same state (%) - Hispanic or Latino
Geographical mobility - Moved from different county within same state (%) - American Indian and Alaska Native
Geographical mobility - Moved from different county within same state (%) - Multirace
Geographical mobility - Moved from different county within same state (%) - Other Race
Geographical mobility - Moved from different state (%)
Geographical mobility - Moved from different state (%) - White
Geographical mobility - Moved from different state (%) - Black or African American
Geographical mobility - Moved from different state (%) - Asian
Geographical mobility - Moved from different state (%) - Hispanic or Latino
Geographical mobility - Moved from different state (%) - American Indian and Alaska Native
Geographical mobility - Moved from different state (%) - Multirace
Geographical mobility - Moved from different state (%) - Other Race
Geographical mobility - Moved from abroad (%)
Geographical mobility - Moved from abroad (%) - White
Geographical mobility - Moved from abroad (%) - Black or African American
Geographical mobility - Moved from abroad (%) - Asian
Geographical mobility - Moved from abroad (%) - Hispanic or Latino
Geographical mobility - Moved from abroad (%) - American Indian and Alaska Native
Geographical mobility - Moved from abroad (%) - Multirace
Geographical mobility - Moved from abroad (%) - Other Race
Place of birth for the foreign-born population - Ireland (%)
Place of birth for the foreign-born population - Denmark (%)
Place of birth for the foreign-born population - Norway (%)
Place of birth for the foreign-born population - Sweden (%)
Place of birth for the foreign-born population - United Kingdom (%)
Place of birth for the foreign-born population - England (%)
Place of birth for the foreign-born population - Scotland (%)
Place of birth for the foreign-born population - Other Northern Europe (%)
Place of birth for the foreign-born population - Austria (%)
Place of birth for the foreign-born population - Belgium (%)
Place of birth for the foreign-born population - France (%)
Place of birth for the foreign-born population - Germany (%)
Place of birth for the foreign-born population - Netherlands (%)
Place of birth for the foreign-born population - Switzerland (%)
Place of birth for the foreign-born population - Other Western Europe (%)
Place of birth for the foreign-born population - Greece (%)
Place of birth for the foreign-born population - Italy (%)
Place of birth for the foreign-born population - Portugal (%)
Place of birth for the foreign-born population - Spain (%)
Place of birth for the foreign-born population - Other Southern Europe (%)
Place of birth for the foreign-born population - Albania (%)
Place of birth for the foreign-born population - Belarus (%)
Place of birth for the foreign-born population - Bosnia and Herzegovina (%)
Place of birth for the foreign-born population - Bulgaria (%)
Place of birth for the foreign-born population - Croatia (%)
Place of birth for the foreign-born population - Czechoslovakia (%)
Place of birth for the foreign-born population - Hungary (%)
Place of birth for the foreign-born population - Latvia (%)
Place of birth for the foreign-born population - Lithuania (%)
Place of birth for the foreign-born population - North Macedonia (Macedonia) (%)
Place of birth for the foreign-born population - Moldova (%)
Place of birth for the foreign-born population - Poland (%)
Place of birth for the foreign-born population - Romania (%)
Place of birth for the foreign-born population - Russia (%)
Place of birth for the foreign-born population - Serbia (%)
Place of birth for the foreign-born population - Ukraine (%)
Place of birth for the foreign-born population - Other Eastern Europe (%)
Place of birth for the foreign-born population - China (%)
Place of birth for the foreign-born population - Hong Kong (%)
Place of birth for the foreign-born population - Taiwan (%)
Place of birth for the foreign-born population - Japan (%)
Place of birth for the foreign-born population - Korea (%)
Place of birth for the foreign-born population - Other Eastern Asia (%)
Place of birth for the foreign-born population - Afghanistan (%)
Place of birth for the foreign-born population - Bangladesh (%)
Place of birth for the foreign-born population - India (%)
Place of birth for the foreign-born population - Iran (%)
Place of birth for the foreign-born population - Kazakhstan (%)
Place of birth for the foreign-born population - Nepal (%)
Place of birth for the foreign-born population - Pakistan (%)
Place of birth for the foreign-born population - Sri Lanka (%)
Place of birth for the foreign-born population - Uzbekistan (%)
Place of birth for the foreign-born population - Other South Central Asia (%)
Place of birth for the foreign-born population - Burma (%)
Place of birth for the foreign-born population - Cambodia (%)
Place of birth for the foreign-born population - Indonesia (%)
Place of birth for the foreign-born population - Laos (%)
Place of birth for the foreign-born population - Malaysia (%)
Place of birth for the foreign-born population - Philippines (%)
Place of birth for the foreign-born population - Singapore (%)
Place of birth for the foreign-born population - Thailand (%)
Place of birth for the foreign-born population - Vietnam (%)
Place of birth for the foreign-born population - Other South Eastern Asia (%)
Place of birth for the foreign-born population - Armenia (%)
Place of birth for the foreign-born population - Iraq (%)
Place of birth for the foreign-born population - Israel (%)
Place of birth for the foreign-born population - Jordan (%)
Place of birth for the foreign-born population - Kuwait (%)
Place of birth for the foreign-born population - Lebanon (%)
Place of birth for the foreign-born population - Saudi Arabia (%)
Place of birth for the foreign-born population - Syria (%)
Place of birth for the foreign-born population - Turkey (%)
Place of birth for the foreign-born population - Yemen (%)
Place of birth for the foreign-born population - Other Western Asia (%)
Place of birth for the foreign-born population - Eritrea (%)
Place of birth for the foreign-born population - Ethiopia (%)
Place of birth for the foreign-born population - Kenya (%)
Place of birth for the foreign-born population - Somalia (%)
Place of birth for the foreign-born population - Uganda (%)
Place of birth for the foreign-born population - Zimbabwe (%)
Place of birth for the foreign-born population - Other Eastern Africa (%)
Place of birth for the foreign-born population - Cameroon (%)
Place of birth for the foreign-born population - Congo (%)
Place of birth for the foreign-born population - Democratic Republic of Congo (Zaire) (%)
Place of birth for the foreign-born population - Other Middle Africa (%)
Place of birth for the foreign-born population - Egypt (%)
Place of birth for the foreign-born population - Morocco (%)
Place of birth for the foreign-born population - Sudan (%)
Place of birth for the foreign-born population - Other Northern Africa (%)
Place of birth for the foreign-born population - South Africa (%)
Place of birth for the foreign-born population - Other Southern Africa (%)
Place of birth for the foreign-born population - Cabo Verde (%)
Place of birth for the foreign-born population - Ghana (%)
Place of birth for the foreign-born population - Liberia (%)
Place of birth for the foreign-born population - Nigeria (%)
Place of birth for the foreign-born population - Senegal (%)
Place of birth for the foreign-born population - Sierra Leone (%)
Place of birth for the foreign-born population - Other Western Africa (%)
Place of birth for the foreign-born population - Australia (%)
Place of birth for the foreign-born population - New Zealand (%)
Place of birth for the foreign-born population - Fiji (%)
Place of birth for the foreign-born population - Micronesia (%)
Place of birth for the foreign-born population - Bahamas (%)
Place of birth for the foreign-born population - Barbados (%)
Place of birth for the foreign-born population - Cuba (%)
Place of birth for the foreign-born population - Dominica (%)
Place of birth for the foreign-born population - Dominican Republic (%)
Place of birth for the foreign-born population - Grenada (%)
Place of birth for the foreign-born population - Haiti (%)
Place of birth for the foreign-born population - Jamaica (%)
Place of birth for the foreign-born population - St. Vincent and the Grenadines (%)
Place of birth for the foreign-born population - Trinidad and Tobago (%)
Place of birth for the foreign-born population - West Indies (%)
Place of birth for the foreign-born population - Other Caribbean (%)
Place of birth for the foreign-born population - Belize (%)
Place of birth for the foreign-born population - Costa Rica (%)
Place of birth for the foreign-born population - El Salvador (%)
Place of birth for the foreign-born population - Guatemala (%)
Place of birth for the foreign-born population - Honduras (%)
Place of birth for the foreign-born population - Mexico (%)
Place of birth for the foreign-born population - Nicaragua (%)
Place of birth for the foreign-born population - Panama (%)
Place of birth for the foreign-born population - Other Central America (%)
Place of birth for the foreign-born population - Argentina (%)
Place of birth for the foreign-born population - Bolivia (%)
Place of birth for the foreign-born population - Brazil (%)
Place of birth for the foreign-born population - Chile (%)
Place of birth for the foreign-born population - Colombia (%)
Place of birth for the foreign-born population - Ecuador (%)
Place of birth for the foreign-born population - Guyana (%)
Place of birth for the foreign-born population - Peru (%)
Place of birth for the foreign-born population - Uruguay (%)
Place of birth for the foreign-born population - Venezuela (%)
Place of birth for the foreign-born population - Other South America (%)
Place of birth for the foreign-born population - Canada (%)
Place of birth for the foreign-born population - Other Northern America (%)
Place of birth for the foreign-born population - Other (%)
Latest news about races in Concord, NC collected exclusively by city-data.com from local newspapers, TV, and radio stations
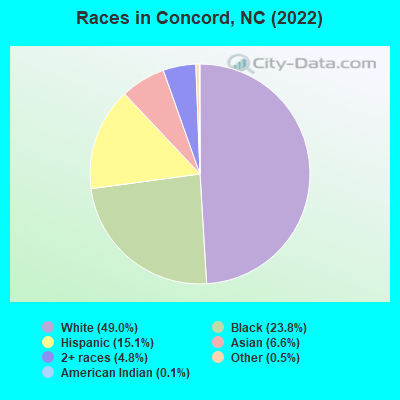
According to 2022 data, the most numerous races in Concord, NC are White alone (53,809 residents), Black alone (26,202 residents), and Hispanic (16,630 residents). 80.7% of Concord residents speak English at home. 11.3% of Concord, NC residents are foreign-born (5.4% born in Latin America, 4.4% born in Asia), which is 29.4% greater than the foreign-born rate of 8.0% across the entire state of North Carolina.
Race distribution in Concord
2000 2022
5,647,155 70.2% White alone 1,723,301 21.4% Black alone 378,963 4.7% Hispanic 112,416 1.4% Asian alone 95,333 1.2% American Indian alone 79,965 1.0% Two or more races 9,015 0.1% Other race alone 3,165 0.04% Native Hawaiian and Other
6,497,519 60.7% White alone 2,155,650 20.1% Black alone 1,114,799 10.4% Hispanic 438,061 4.1% Two or more races 341,052 3.2% Asian alone 91,758 0.9% American Indian alone 50,180 0.5% Other race alone 9,954 0.09% Native Hawaiian and Other
Income and house value in Concord Median household income in 2022 $78,770 White non-Hispanic householders$68,112 Black householders$194,677 Asian householders$83,057 Some other race householders$71,484 Two or more races householders$70,061 Hispanic or Latino race householdersMedian 2022 house value $382,105 White Non-Hispanic householders$261,229 Black or African American householders$301,109 American Indian or Alaska Native householders $523,385 Asian householders$314,093 Some other race householders$369,430 Two or more races householders$315,638 Hispanic or Latino householders
Median age by race in Concord
40.0 Median age for White residents38.0 41.8 32.4 Median age for Black or African American residents30.0 36.7 57.9 Median age for American Indian / Alaska Native residents-666,666,666.0 -666,666,666.0 33.8 Median age for Asian residents31.4 34.6 -666,666,666.0 Median age for Native Hawaiian / Pacific Islander residents-666,666,666.0 -666,666,666.0 22.4 Median age for Other race residents22.6 22.3 23.9 Median age for Two or more races residents18.6 30.0 40.7 Median age for White alone residents39.2 41.6 25.8 Median age for Hispanic or Latino residents24.8 26.0
Owner/renter occupied households by race in Concord
House owners and renters - White residents 16,436 74.0% Owner occupied5,761 26.0% Renter occupiedHouse owners and renters - Black or African American residents 2,888 30.9% Owner occupied6,467 69.1% Renter occupiedHouse owners and renters - American Indian / Alaska Native residents 31 18.5% Owner occupied138 81.5% Renter occupiedHouse owners and renters - Asian residents 1,966 92.8% Owner occupied152 7.2% Renter occupiedHouse owners and renters - Native Hawaiian / Pacific Islander residents 24 100.0% Owner occupiedHouse owners and renters - Other race residents 1,131 59.0% Owner occupied786 41.0% Renter occupiedHouse owners and renters - Two or more races residents 1,587 52.0% Owner occupied1,467 48.0% Renter occupiedHouse owners and renters - White alone residents 16,025 74.8% Owner occupied5,395 25.2% Renter occupiedHouse owners and renters - Hispanic or Latino residents 2,247 50.6% Owner occupied2,194 49.4% Renter occupied
Language usage in Concord
English speakers - Total 80.7% of residents of Concord speak English at home.
12.0% of residents speak Spanish at home 8,995 72.9% Speak English very well3,350 27.1% Speak English less than very well7.3% of residents speak other language at home 6,106 81.0% Speak English very well1,428 19.0% Speak English less than very well
English speakers - Born in the United States 93.7% of residents of Concord speak English at home.
5.7% of residents speak Spanish at home 2,148 96.6% Speak English very well75 3.4% Speak English less than very well0.6% of residents speak other language at home 234 100.0% Speak English very well
English speakers - Native, born elsewhere 51.9% of residents of Concord speak English at home.
34.5% of residents speak Spanish at home 87 19.1% Speak English very well368 80.9% Speak English less than very well13.6% of residents speak other language at home 179 100.0% Speak English very well
English speakers - Foreign-born 11.6% of residents of Concord speak English at home.
35.7% of residents speak Spanish at home 1,194 32.8% Speak English very well2,450 67.2% Speak English less than very well52.7% of residents speak other language at home 3,955 73.5% Speak English very well1,428 26.5% Speak English less than very well
White (Caucasian) - Speak only English Native:
98.0% (51,335)Foreign-born:
34.3% (318)
White (Caucasian) - Speak another language Native:
2.0% (1,060)Foreign-born:
65.7% (609)
Black or African American - Speak only English Native:
93.9% (20,467)Foreign-born:
39.7% (560)
Black or African American - Speak another language Native:
6.9% (1,507)Foreign-born:
60.7% (855)
American Indian / Alaska Native - Speak only English Native:
97.4% (25)Foreign-born:
47.7% (108)
Asian - Speak only English Native:
53.3% (1,213)Foreign-born:
5.0% (224)
Asian - Speak another language Native:
46.7% (1,064)Foreign-born:
95.0% (4,281)
Other race - Speak another language Native:
86.6% (4,053)Foreign-born:
100.0% (1,586)
Two or more races - Speak only English Native:
70.7% (6,275)Foreign-born:
4.1% (76)
Two or more races - Speak another language Native:
13.8% (1,223)Foreign-born:
96.0% (1,769)
White alone - Speak only English Native:
99.1% (51,972)Foreign-born:
29.8% (314)
White alone - Speak another language Native:
0.9% (479)Foreign-born:
65.3% (688)
Hispanic or Latino - Speak only English Native:
37.7% (4,431)Foreign-born:
4.2% (144)
Hispanic or Latino - Speak another language Native:
62.3% (7,333)Foreign-born:
95.8% (3,322)
Foreign-born residents in Concord 12,428 residents are foreign born (5.4% Latin America , 4.4% Asia ).
This city:
11.3%North Carolina:
8.3%
Marital status for residents in Concord Marital status - White (Caucasian) population 15 years and over
Males 30.4% Never married56.7% Now married1.8% Separated2.4% Widowed8.7% DivorcedFemales 23.6% Never married53.7% Now married1.1% Separated11.0% Widowed10.6% DivorcedWomen who gave birth in the past 12 months Now married:
64.0% (105)Unmarried:
36.0% (59)
Women who did not give birth in the past 12 months Now married:
52.7% (7,247)Unmarried:
47.3% (6,506)
Marital status - Black or African American population 15 years and over
Males 37.0% Never married55.8% Now married0.7% Separated1.0% Widowed5.4% DivorcedFemales 44.8% Never married22.8% Now married5.7% Separated5.3% Widowed21.4% DivorcedWomen who gave birth in the past 12 months Now married:
100.0% (57)Unmarried:
0.0% (0)
Women who did not give birth in the past 12 months Now married:
21.5% (1,733)Unmarried:
78.5% (6,326)
Marital status - American Indian / Alaska Native population 15 years and over
Males 88.7% Never married11.3% Now married0.0% Separated0.0% Widowed0.0% DivorcedFemales 48.0% Never married52.0% Now married0.0% Separated0.0% Widowed0.0% DivorcedWomen who did not give birth in the past 12 months Now married:
0.0% (0)Unmarried:
100.0% (13)
Marital status - Asian population 15 years and over
Males 12.3% Never married83.8% Now married2.1% Separated0.0% Widowed1.9% DivorcedFemales 13.4% Never married76.6% Now married3.0% Separated1.7% Widowed5.3% DivorcedWomen who gave birth in the past 12 months Now married:
100.0% (63)Unmarried:
0.0% (0)
Women who did not give birth in the past 12 months Now married:
79.7% (1,433)Unmarried:
20.3% (366)
Marital status - Other race population 15 years and over
Males 41.9% Never married53.4% Now married0.0% Separated2.2% Widowed2.5% DivorcedFemales 37.7% Never married45.4% Now married0.8% Separated5.5% Widowed10.6% DivorcedWomen who gave birth in the past 12 months Now married:
50.8% (89)Unmarried:
49.2% (86)
Women who did not give birth in the past 12 months Now married:
50.4% (1,222)Unmarried:
49.6% (1,203)
Marital status - Two or more races population 15 years and over
Males 51.7% Never married40.1% Now married0.0% Separated8.0% Widowed0.2% DivorcedFemales 42.9% Never married42.9% Now married2.6% Separated3.1% Widowed8.5% DivorcedWomen who gave birth in the past 12 months Now married:
100.0% (38)Unmarried:
0.0% (0)
Women who did not give birth in the past 12 months Now married:
29.4% (907)Unmarried:
70.6% (2,173)
Marital status - White alone, not Hispanic / Latino population 15 years and over
Males 30.5% Never married56.3% Now married1.9% Separated2.5% Widowed8.8% DivorcedFemales 22.4% Never married53.9% Now married1.2% Separated11.5% Widowed11.0% DivorcedWomen who gave birth in the past 12 months Now married:
64.0% (105)Unmarried:
36.0% (59)
Women who did not give birth in the past 12 months Now married:
53.6% (6,953)Unmarried:
46.4% (6,017)
Marital status - Hispanic or Latino population 15 years and over
Males 43.5% Never married51.5% Now married0.3% Separated2.7% Widowed2.1% DivorcedFemales 38.3% Never married44.2% Now married2.9% Separated5.4% Widowed9.2% DivorcedWomen who gave birth in the past 12 months Now married:
58.6% (101)Unmarried:
41.4% (72)
Women who did not give birth in the past 12 months Now married:
43.9% (1,831)Unmarried:
56.1% (2,343)
Ancestries in Concord
7,836 13.9% American3,505 6.2% German3,401 6.0% English2,822 5.0% Irish2,281 4.0% African1,244 2.2% European1,175 2.1% Italian935 1.7% Scotch-Irish481 0.9% Scottish436 0.8% French397 0.7% Polish264 0.5% Jamaican256 0.5% Haitian223 0.4% Swedish187 0.3% Nigerian151 0.3% Dutch141 0.3% British120 0.2% Trinidadian and Tobagonian108 0.2% Liberian102 0.2% Welsh94 0.2% Syrian78 0.1% Ghanaian74 0.1% Russian73 0.1% Slovak71 0.1% Iranian67 0.1% Ethiopian63 0.1% Czech55 0.10% Hungarian50 0.09% Greek50 0.09% West Indian47 0.08% Ukrainian45 0.08% Ugandan45 0.08% Czechoslovakian43 0.08% Romanian41 0.07% Norwegian39 0.07% French Canadian31 0.06% Scandinavian30 0.05% Eastern European18 0.03% Cajun18 0.03% Lebanese18 0.03% Northern European18 0.03% Swiss16 0.03% Danish15 0.03% Canadian13 0.02% Belgian13 0.02% South African12 0.02% Portuguese10 0.02% Croatian10 0.02% Arab9 0.02% Australian5 0.01% Basque
Geographical mobility in Concord Same house 1 year ago 49,995 89.5% White (Caucasian)22,688 94.1% Black or African American27 14.0% American Indian / Alaska Native6,134 92.1% Asian36 100.0% Native Hawaiian / Pacific Islander7,330 78.8% Other race8,525 93.1% Two or more races47,834 89.3% White alone, not Hispanic / Latino12,282 80.6% Hispanic or LatinoMoved within same county 2,871 5.1% White / Caucasian620 2.6% Black or African American105 55.5% American Indian / Alaska Native187 2.8% Asian1,206 13.0% Other race162 1.8% Two or more races2,871 5.4% White alone, not Hispanic / Latino1,629 10.7% Hispanic or LatinoMoved within same state 1,789 3.2% White / Caucasian1,475 6.1% Black or African American158 2.4% Asian420 4.5% Other race306 3.3% Two or more races1,656 3.1% White alone, not Hispanic / Latino849 5.6% Hispanic or LatinoMoved from different state 1,209 2.2% White / Caucasian527 2.2% Black or African American121 1.8% Asian175 1.9% Other race306 3.3% Two or more races1,209 2.3% White alone, not Hispanic / Latino286 1.9% Hispanic or LatinoMoved from abroad 14 0.1% Black or African American114 1.7% Asian69 0.7% Other race45 0.3% Hispanic or Latino
Children Nativity (place of birth) in Concord
Children under 6 years - Living with two parents Both parents native 2,922 100.0% NativeBoth parents foreign-born 653 96.9% Native21 3.1% Foreign-bornOne native, one foreign-born parent 658 100.0% NativeChildren under 6 years - Living with one parent Native parent 2,053 100.0% NativeForeign-born parent 843 100.0% NativeChildren 6 to 17 years - Living with two parents Both parents native 8,025 100.0% NativeBoth parents foreign-born 1,803 79.3% Native470 20.7% Foreign-bornOne native, one foreign-born parent 1,393 97.5% Native35 2.5% Foreign-bornChildren 6 to 17 years - Living with one parent Native parent 5,227 99.1% Native46 0.9% Foreign-bornForeign-born parent 562 58.3% Native402 41.7% Foreign-born
Grandparents responsible for own grandchildren in Concord
Grandparents (30 to 59 years) White / Caucasian 448 71.0% Responsible for grandchildren183 29.0% Not responsible for grandchildrenBlack or African American 132 29.0% Responsible for grandchildren322 71.0% Not responsible for grandchildrenAsian 28 100.0% Not responsible for grandchildrenOther race 67 15.7% Responsible for grandchildren359 84.3% Not responsible for grandchildrenTwo or more races 56 45.4% Responsible for grandchildren67 54.6% Not responsible for grandchildrenWhite alone, not Hispanic / Latino 448 70.7% Responsible for grandchildren185 29.3% Not responsible for grandchildrenHispanic or Latino 52 10.9% Responsible for grandchildren427 89.1% Not responsible for grandchildrenGrandparents (60 years and over) White / Caucasian 442 58.5% Responsible for grandchildren314 41.5% Not responsible for grandchildrenBlack or African American 109 40.6% Responsible for grandchildren159 59.4% Not responsible for grandchildrenAsian 9 8.9% Responsible for grandchildren91 91.1% Not responsible for grandchildrenTwo or more races 87 100.0% Not responsible for grandchildrenWhite alone, not Hispanic / Latino 442 59.0% Responsible for grandchildren307 41.0% Not responsible for grandchildrenHispanic or Latino 56 100.0% Not responsible for grandchildren