Races in Colonial Heights, Virginia (VA) Detailed Stats
Data:
Races - White alone (%)
Races - White alone (% change since 2000)
Races - Black alone (%)
Races - Black alone (% change since 2000)
Races - American Indian alone (%)
Races - American Indian alone (% change since 2000)
Races - Asian alone (%)
Races - Asian alone (% change since 2000)
Races - Hispanic (%)
Races - Hispanic (% change since 2000)
Races - Native Hawaiian and Other Pacific Islander alone (%)
Races - Native Hawaiian and Other Pacific Islander alone (% change since 2000)
Races - Two or more races(%)
Races - Two or more races(% change since 2000)
Races - Other race alone (%)
Races - Other race alone (% change since 2000)
Racial diversity
Place of birth - Born in state of residence (%)
Place of birth - Born in state of residence (%) - White
Place of birth - Born in state of residence (%) - Black or African American
Place of birth - Born in state of residence (%) - Asian
Place of birth - Born in state of residence (%) - Hispanic or Latino
Place of birth - Born in state of residence (%) - American Indian and Alaska Native
Place of birth - Born in state of residence (%) - Multirace
Place of birth - Born in state of residence (%) - Other Race
Place of birth - Born in other state (%)
Place of birth - Born in other state (%) - White
Place of birth - Born in other state (%) - Black or African American
Place of birth - Born in other state (%) - Asian
Place of birth - Born in other state (%) - Hispanic or Latino
Place of birth - Born in other state (%) - American Indian and Alaska Native
Place of birth - Born in other state (%) - Multirace
Place of birth - Born in other state (%) - Other Race
Place of birth - Native, outside of US (%)
Place of birth - Native, outside of US (%) - White
Place of birth - Native, outside of US (%) - Black or African American
Place of birth - Native, outside of US (%) - Asian
Place of birth - Native, outside of US (%) - Hispanic or Latino
Place of birth - Native, outside of US (%) - American Indian and Alaska Native
Place of birth - Native, outside of US (%) - Multirace
Place of birth - Native, outside of US (%) - Other Race
Place of birth - Foreign born (%)
Place of birth - Foreign born (%) - White
Place of birth - Foreign born (%) - Black or African American
Place of birth - Foreign born (%) - Asian
Place of birth - Foreign born (%) - Hispanic or Latino
Place of birth - Foreign born (%) - American Indian and Alaska Native
Place of birth - Foreign born (%) - Multirace
Place of birth - Foreign born (%) - Other Race
Residents speaking English at home (%)
Residents speaking English at home - Born in the United States (%)
Residents speaking English at home - Native, born elsewhere (%)
Residents speaking English at home - Foreign born (%)
Residents speaking Spanish at home (%)
Residents speaking Spanish at home - Born in the United States (%)
Residents speaking Spanish at home - Native, born elsewhere (%)
Residents speaking Spanish at home - Foreign born (%)
Residents speaking other language at home (%)
Residents speaking other language at home - Born in the United States (%)
Residents speaking other language at home - Native, born elsewhere (%)
Residents speaking other language at home - Foreign born (%)
Marital status - Never married (%)
Marital status - Now married (%)
Marital status - Separated (%)
Marital status - Widowed (%)
Marital status - Divorced (%)
Ancestries Reported - Arab (%)
Ancestries Reported - Czech (%)
Ancestries Reported - Danish (%)
Ancestries Reported - Dutch (%)
Ancestries Reported - English (%)
Ancestries Reported - French (%)
Ancestries Reported - French Canadian (%)
Ancestries Reported - German (%)
Ancestries Reported - Greek (%)
Ancestries Reported - Hungarian (%)
Ancestries Reported - Irish (%)
Ancestries Reported - Italian (%)
Ancestries Reported - Lithuanian (%)
Ancestries Reported - Norwegian (%)
Ancestries Reported - Polish (%)
Ancestries Reported - Portuguese (%)
Ancestries Reported - Russian (%)
Ancestries Reported - Scotch-Irish (%)
Ancestries Reported - Scottish (%)
Ancestries Reported - Slovak (%)
Ancestries Reported - Subsaharan African (%)
Ancestries Reported - Swedish (%)
Ancestries Reported - Swiss (%)
Ancestries Reported - Ukrainian (%)
Ancestries Reported - United States (%)
Ancestries Reported - Welsh (%)
Ancestries Reported - West Indian (%)
Ancestries Reported - Other (%)
Geographical mobility - Same house 1 year ago (%)
Geographical mobility - Same house 1 year ago (%) - White
Geographical mobility - Same house 1 year ago (%) - Black or African American
Geographical mobility - Same house 1 year ago (%) - Asian
Geographical mobility - Same house 1 year ago (%) - Hispanic or Latino
Geographical mobility - Same house 1 year ago (%) - American Indian and Alaska Native
Geographical mobility - Same house 1 year ago (%) - Multirace
Geographical mobility - Same house 1 year ago (%) - Other Race
Geographical mobility - Moved within same county (%)
Geographical mobility - Moved within same county (%) - White
Geographical mobility - Moved within same county (%) - Black or African American
Geographical mobility - Moved within same county (%) - Asian
Geographical mobility - Moved within same county (%) - Hispanic or Latino
Geographical mobility - Moved within same county (%) - American Indian and Alaska Native
Geographical mobility - Moved within same county (%) - Multirace
Geographical mobility - Moved within same county (%) - Other Race
Geographical mobility - Moved from different county within same state (%)
Geographical mobility - Moved from different county within same state (%) - White
Geographical mobility - Moved from different county within same state (%) - Black or African American
Geographical mobility - Moved from different county within same state (%) - Asian
Geographical mobility - Moved from different county within same state (%) - Hispanic or Latino
Geographical mobility - Moved from different county within same state (%) - American Indian and Alaska Native
Geographical mobility - Moved from different county within same state (%) - Multirace
Geographical mobility - Moved from different county within same state (%) - Other Race
Geographical mobility - Moved from different state (%)
Geographical mobility - Moved from different state (%) - White
Geographical mobility - Moved from different state (%) - Black or African American
Geographical mobility - Moved from different state (%) - Asian
Geographical mobility - Moved from different state (%) - Hispanic or Latino
Geographical mobility - Moved from different state (%) - American Indian and Alaska Native
Geographical mobility - Moved from different state (%) - Multirace
Geographical mobility - Moved from different state (%) - Other Race
Geographical mobility - Moved from abroad (%)
Geographical mobility - Moved from abroad (%) - White
Geographical mobility - Moved from abroad (%) - Black or African American
Geographical mobility - Moved from abroad (%) - Asian
Geographical mobility - Moved from abroad (%) - Hispanic or Latino
Geographical mobility - Moved from abroad (%) - American Indian and Alaska Native
Geographical mobility - Moved from abroad (%) - Multirace
Geographical mobility - Moved from abroad (%) - Other Race
Place of birth for the foreign-born population - Ireland (%)
Place of birth for the foreign-born population - Denmark (%)
Place of birth for the foreign-born population - Norway (%)
Place of birth for the foreign-born population - Sweden (%)
Place of birth for the foreign-born population - United Kingdom (%)
Place of birth for the foreign-born population - England (%)
Place of birth for the foreign-born population - Scotland (%)
Place of birth for the foreign-born population - Other Northern Europe (%)
Place of birth for the foreign-born population - Austria (%)
Place of birth for the foreign-born population - Belgium (%)
Place of birth for the foreign-born population - France (%)
Place of birth for the foreign-born population - Germany (%)
Place of birth for the foreign-born population - Netherlands (%)
Place of birth for the foreign-born population - Switzerland (%)
Place of birth for the foreign-born population - Other Western Europe (%)
Place of birth for the foreign-born population - Greece (%)
Place of birth for the foreign-born population - Italy (%)
Place of birth for the foreign-born population - Portugal (%)
Place of birth for the foreign-born population - Spain (%)
Place of birth for the foreign-born population - Other Southern Europe (%)
Place of birth for the foreign-born population - Albania (%)
Place of birth for the foreign-born population - Belarus (%)
Place of birth for the foreign-born population - Bosnia and Herzegovina (%)
Place of birth for the foreign-born population - Bulgaria (%)
Place of birth for the foreign-born population - Croatia (%)
Place of birth for the foreign-born population - Czechoslovakia (%)
Place of birth for the foreign-born population - Hungary (%)
Place of birth for the foreign-born population - Latvia (%)
Place of birth for the foreign-born population - Lithuania (%)
Place of birth for the foreign-born population - North Macedonia (Macedonia) (%)
Place of birth for the foreign-born population - Moldova (%)
Place of birth for the foreign-born population - Poland (%)
Place of birth for the foreign-born population - Romania (%)
Place of birth for the foreign-born population - Russia (%)
Place of birth for the foreign-born population - Serbia (%)
Place of birth for the foreign-born population - Ukraine (%)
Place of birth for the foreign-born population - Other Eastern Europe (%)
Place of birth for the foreign-born population - China (%)
Place of birth for the foreign-born population - Hong Kong (%)
Place of birth for the foreign-born population - Taiwan (%)
Place of birth for the foreign-born population - Japan (%)
Place of birth for the foreign-born population - Korea (%)
Place of birth for the foreign-born population - Other Eastern Asia (%)
Place of birth for the foreign-born population - Afghanistan (%)
Place of birth for the foreign-born population - Bangladesh (%)
Place of birth for the foreign-born population - India (%)
Place of birth for the foreign-born population - Iran (%)
Place of birth for the foreign-born population - Kazakhstan (%)
Place of birth for the foreign-born population - Nepal (%)
Place of birth for the foreign-born population - Pakistan (%)
Place of birth for the foreign-born population - Sri Lanka (%)
Place of birth for the foreign-born population - Uzbekistan (%)
Place of birth for the foreign-born population - Other South Central Asia (%)
Place of birth for the foreign-born population - Burma (%)
Place of birth for the foreign-born population - Cambodia (%)
Place of birth for the foreign-born population - Indonesia (%)
Place of birth for the foreign-born population - Laos (%)
Place of birth for the foreign-born population - Malaysia (%)
Place of birth for the foreign-born population - Philippines (%)
Place of birth for the foreign-born population - Singapore (%)
Place of birth for the foreign-born population - Thailand (%)
Place of birth for the foreign-born population - Vietnam (%)
Place of birth for the foreign-born population - Other South Eastern Asia (%)
Place of birth for the foreign-born population - Armenia (%)
Place of birth for the foreign-born population - Iraq (%)
Place of birth for the foreign-born population - Israel (%)
Place of birth for the foreign-born population - Jordan (%)
Place of birth for the foreign-born population - Kuwait (%)
Place of birth for the foreign-born population - Lebanon (%)
Place of birth for the foreign-born population - Saudi Arabia (%)
Place of birth for the foreign-born population - Syria (%)
Place of birth for the foreign-born population - Turkey (%)
Place of birth for the foreign-born population - Yemen (%)
Place of birth for the foreign-born population - Other Western Asia (%)
Place of birth for the foreign-born population - Eritrea (%)
Place of birth for the foreign-born population - Ethiopia (%)
Place of birth for the foreign-born population - Kenya (%)
Place of birth for the foreign-born population - Somalia (%)
Place of birth for the foreign-born population - Uganda (%)
Place of birth for the foreign-born population - Zimbabwe (%)
Place of birth for the foreign-born population - Other Eastern Africa (%)
Place of birth for the foreign-born population - Cameroon (%)
Place of birth for the foreign-born population - Congo (%)
Place of birth for the foreign-born population - Democratic Republic of Congo (Zaire) (%)
Place of birth for the foreign-born population - Other Middle Africa (%)
Place of birth for the foreign-born population - Egypt (%)
Place of birth for the foreign-born population - Morocco (%)
Place of birth for the foreign-born population - Sudan (%)
Place of birth for the foreign-born population - Other Northern Africa (%)
Place of birth for the foreign-born population - South Africa (%)
Place of birth for the foreign-born population - Other Southern Africa (%)
Place of birth for the foreign-born population - Cabo Verde (%)
Place of birth for the foreign-born population - Ghana (%)
Place of birth for the foreign-born population - Liberia (%)
Place of birth for the foreign-born population - Nigeria (%)
Place of birth for the foreign-born population - Senegal (%)
Place of birth for the foreign-born population - Sierra Leone (%)
Place of birth for the foreign-born population - Other Western Africa (%)
Place of birth for the foreign-born population - Australia (%)
Place of birth for the foreign-born population - New Zealand (%)
Place of birth for the foreign-born population - Fiji (%)
Place of birth for the foreign-born population - Micronesia (%)
Place of birth for the foreign-born population - Bahamas (%)
Place of birth for the foreign-born population - Barbados (%)
Place of birth for the foreign-born population - Cuba (%)
Place of birth for the foreign-born population - Dominica (%)
Place of birth for the foreign-born population - Dominican Republic (%)
Place of birth for the foreign-born population - Grenada (%)
Place of birth for the foreign-born population - Haiti (%)
Place of birth for the foreign-born population - Jamaica (%)
Place of birth for the foreign-born population - St. Vincent and the Grenadines (%)
Place of birth for the foreign-born population - Trinidad and Tobago (%)
Place of birth for the foreign-born population - West Indies (%)
Place of birth for the foreign-born population - Other Caribbean (%)
Place of birth for the foreign-born population - Belize (%)
Place of birth for the foreign-born population - Costa Rica (%)
Place of birth for the foreign-born population - El Salvador (%)
Place of birth for the foreign-born population - Guatemala (%)
Place of birth for the foreign-born population - Honduras (%)
Place of birth for the foreign-born population - Mexico (%)
Place of birth for the foreign-born population - Nicaragua (%)
Place of birth for the foreign-born population - Panama (%)
Place of birth for the foreign-born population - Other Central America (%)
Place of birth for the foreign-born population - Argentina (%)
Place of birth for the foreign-born population - Bolivia (%)
Place of birth for the foreign-born population - Brazil (%)
Place of birth for the foreign-born population - Chile (%)
Place of birth for the foreign-born population - Colombia (%)
Place of birth for the foreign-born population - Ecuador (%)
Place of birth for the foreign-born population - Guyana (%)
Place of birth for the foreign-born population - Peru (%)
Place of birth for the foreign-born population - Uruguay (%)
Place of birth for the foreign-born population - Venezuela (%)
Place of birth for the foreign-born population - Other South America (%)
Place of birth for the foreign-born population - Canada (%)
Place of birth for the foreign-born population - Other Northern America (%)
Place of birth for the foreign-born population - Other (%)
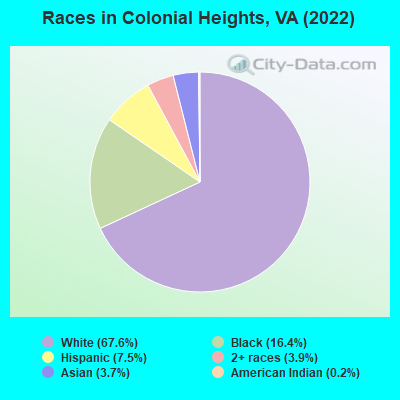
According to 2022 data, the most numerous races in Colonial Heights, VA are White alone (12,350 residents), Black alone (2,996 residents), and Hispanic (1,377 residents). 91.3% of Colonial Heights residents speak English at home. 5.7% of Colonial Heights, VA residents are foreign-born (2.7% born in Asia, 1.4% born in Europe, 1.0% born in Latin America), which is 110.5% less than the foreign-born rate of 12.0% across the entire state of Virginia.
Race distribution in Colonial Heights
2000 2022
4,965,637 70.2% White alone 1,376,378 19.4% Black alone 329,540 4.7% Hispanic 259,277 3.7% Asian alone 114,022 1.6% Two or more races 18,596 0.3% American Indian alone 11,685 0.2% Other race alone 3,380 0.05% Native Hawaiian and Other
5,095,130 58.7% White alone 1,594,785 18.4% Black alone 905,750 10.4% Hispanic 602,881 6.9% Asian alone 406,047 4.7% Two or more races 60,419 0.7% Other race alone 11,738 0.1% American Indian alone 6,869 0.08% Native Hawaiian and Other
Income and house value in Colonial Heights Median household income in 2022 $77,936 White non-Hispanic householders$47,832 Black householders$72,361 Asian householders$52,010 Two or more races householders$45,876 Hispanic or Latino race householdersMedian 2022 house value $237,772 White Non-Hispanic householders$239,785 Black or African American householders$228,210 American Indian or Alaska Native householders $335,397 Asian householders$241,546 Some other race householders$113,224 Two or more races householders$228,965 Hispanic or Latino householders
Median age by race in Colonial Heights
46.1 Median age for White residents43.1 48.3 32.8 Median age for Black or African American residents35.0 32.0 -682,215,742.8 Median age for American Indian / Alaska Native residents-682,352,940.5 -687,861,271.0 39.0 Median age for Asian residents33.6 51.3 -611,955,419.9 Median age for Native Hawaiian / Pacific Islander residents-541,531,822.5 -714,150,046.8 30.8 Median age for Other race residents32.9 30.2 34.3 Median age for Two or more races residents36.4 34.2 47.4 Median age for White alone residents44.2 48.4 29.5 Median age for Hispanic or Latino residents31.8 26.9
Owner/renter occupied households by race in Colonial Heights
House owners and renters - White residents 4,361 75.3% Owner occupied1,428 24.7% Renter occupiedHouse owners and renters - Black or African American residents 320 26.5% Owner occupied888 73.5% Renter occupiedHouse owners and renters - American Indian / Alaska Native residents 21 100.0% Owner occupiedHouse owners and renters - Asian residents 132 84.6% Owner occupied24 15.4% Renter occupiedHouse owners and renters - Other race residents 193 73.4% Owner occupied70 26.6% Renter occupiedHouse owners and renters - Two or more races residents 154 56.1% Owner occupied121 43.9% Renter occupiedHouse owners and renters - White alone residents 4,361 76.5% Owner occupied1,343 23.5% Renter occupiedHouse owners and renters - Hispanic or Latino residents 249 47.0% Owner occupied281 53.0% Renter occupied
Language usage in Colonial Heights
English speakers - Total 91.3% of residents of Colonial Heights speak English at home.
4.0% of residents speak Spanish at home 489 70.7% Speak English very well203 29.3% Speak English less than very well4.5% of residents speak other language at home 351 45.3% Speak English very well423 54.7% Speak English less than very well
English speakers - Born in the United States 95.5% of residents of Colonial Heights speak English at home.
4.0% of residents speak Spanish at home 143 66.8% Speak English very well71 33.2% Speak English less than very well0.5% of residents speak other language at home 28 100.0% Speak English very well
English speakers - Native, born elsewhere 83.9% of residents of Colonial Heights speak English at home.
13.6% of residents speak Spanish at home 42 77.8% Speak English very well12 22.2% Speak English less than very well
English speakers - Foreign-born 22.1% of residents of Colonial Heights speak English at home.
13.9% of residents speak Spanish at home 28 19.3% Speak English very well117 80.7% Speak English less than very well65.1% of residents speak other language at home 272 40.0% Speak English very well408 60.0% Speak English less than very well
White (Caucasian) - Speak only English Native:
98.2% (11,491)Foreign-born:
31.4% (92)
White (Caucasian) - Speak another language Native:
2.1% (245)Foreign-born:
69.2% (202)
Black or African American - Speak only English Native:
97.9% (2,622)Foreign-born:
49.0% (26)
Black or African American - Speak another language Native:
2.1% (55)Foreign-born:
46.9% (25)
Asian - Speak only English Native:
71.7% (126)Foreign-born:
16.8% (85)
Asian - Speak another language Native:
24.6% (43)Foreign-born:
83.4% (421)
Other race - Speak another language Native:
46.6% (202)Foreign-born:
98.4% (56)
Two or more races - Speak only English Native:
96.3% (900)Foreign-born:
67.1% (24)
Two or more races - Speak another language Native:
1.0% (9)Foreign-born:
29.4% (10)
White alone - Speak only English Native:
98.9% (11,389)Foreign-born:
32.8% (98)
White alone - Speak another language Native:
1.2% (135)Foreign-born:
67.2% (200)
Hispanic or Latino - Speak another language Native:
40.0% (416)Foreign-born:
99.6% (149)
Foreign-born residents in Colonial Heights 1,042 residents are foreign born (2.7% Asia , 1.4% Europe , 1.0% Latin America ).
This city:
5.7%Virginia:
12.6%
Marital status for residents in Colonial Heights Marital status - White (Caucasian) population 15 years and over
Males 32.2% Never married51.0% Now married2.2% Separated3.1% Widowed11.4% DivorcedFemales 26.9% Never married42.0% Now married3.3% Separated12.0% Widowed15.8% DivorcedWomen who gave birth in the past 12 months Now married:
33.3% (36)Unmarried:
66.7% (71)
Women who did not give birth in the past 12 months Now married:
34.2% (866)Unmarried:
65.8% (1,666)
Marital status - Black or African American population 15 years and over
Males 30.4% Never married41.4% Now married2.1% Separated3.4% Widowed22.6% DivorcedFemales 51.1% Never married19.8% Now married3.6% Separated6.3% Widowed19.1% DivorcedWomen who did not give birth in the past 12 months Now married:
20.2% (163)Unmarried:
79.8% (642)
Marital status - American Indian / Alaska Native population 15 years and over
Males 0.0% Never married100.0% Now married0.0% Separated0.0% Widowed0.0% DivorcedFemales 100.0% Never married0.0% Now married0.0% Separated0.0% Widowed0.0% DivorcedWomen who did not give birth in the past 12 months Now married:
0.0% (0)Unmarried:
100.0% (22)
Marital status - Asian population 15 years and over
Males 25.7% Never married60.0% Now married0.0% Separated5.7% Widowed8.6% DivorcedFemales 0.0% Never married91.6% Now married0.0% Separated8.4% Widowed0.0% DivorcedWomen who gave birth in the past 12 months Now married:
100.0% (61)Unmarried:
0.0% (0)
Women who did not give birth in the past 12 months Now married:
100.0% (80)Unmarried:
0.0% (0)
Marital status - Other race population 15 years and over
Males 0.0% Never married100.0% Now married0.0% Separated0.0% Widowed0.0% DivorcedFemales 35.2% Never married64.8% Now married0.0% Separated0.0% Widowed0.0% DivorcedWomen who did not give birth in the past 12 months Now married:
64.8% (164)Unmarried:
35.2% (89)
Marital status - Two or more races population 15 years and over
Males 52.9% Never married30.0% Now married0.0% Separated10.3% Widowed6.8% DivorcedFemales 59.3% Never married24.7% Now married0.0% Separated0.0% Widowed16.0% DivorcedWomen who gave birth in the past 12 months Now married:
100.0% (89)Unmarried:
0.0% (0)
Women who did not give birth in the past 12 months Now married:
11.0% (40)Unmarried:
89.0% (320)
Marital status - White alone, not Hispanic / Latino population 15 years and over
Males 31.0% Never married51.9% Now married2.2% Separated3.0% Widowed11.8% DivorcedFemales 24.7% Never married43.5% Now married3.5% Separated12.5% Widowed15.8% DivorcedWomen who gave birth in the past 12 months Now married:
43.7% (37)Unmarried:
56.3% (48)
Women who did not give birth in the past 12 months Now married:
35.9% (882)Unmarried:
64.1% (1,572)
Marital status - Hispanic or Latino population 15 years and over
Males 34.2% Never married62.6% Now married0.0% Separated3.3% Widowed0.0% DivorcedFemales 53.2% Never married30.4% Now married2.7% Separated0.0% Widowed13.7% DivorcedWomen who gave birth in the past 12 months Now married:
0.0% (0)Unmarried:
100.0% (29)
Women who did not give birth in the past 12 months Now married:
40.6% (196)Unmarried:
59.4% (288)
Ancestries in Colonial Heights
1,356 16.3% English1,177 14.1% American721 8.6% Irish473 5.7% German297 3.6% Italian145 1.7% Polish87 1.0% Scottish79 0.9% Scotch-Irish70 0.8% European65 0.8% Portuguese60 0.7% Palestinian51 0.6% French45 0.5% British37 0.4% African36 0.4% Dutch34 0.4% Czechoslovakian30 0.4% Celtic25 0.3% Egyptian24 0.3% French Canadian21 0.3% Norwegian15 0.2% Lebanese14 0.2% Czech10 0.1% Swiss9 0.1% Belgian9 0.1% Welsh6 0.07% Arab
Children Nativity (place of birth) in Colonial Heights
Children under 6 years - Living with two parents Both parents native 574 100.0% NativeBoth parents foreign-born 11 100.0% NativeOne native, one foreign-born parent 35 100.0% NativeChildren under 6 years - Living with one parent Native parent 744 100.0% NativeForeign-born parent 30 100.0% NativeChildren 6 to 17 years - Living with two parents Both parents native 1,096 100.0% NativeBoth parents foreign-born 89 78.8% Native24 21.2% Foreign-bornOne native, one foreign-born parent 115 100.0% NativeChildren 6 to 17 years - Living with one parent Native parent 1,207 100.0% Native
Grandparents responsible for own grandchildren in Colonial Heights
Grandparents (30 to 59 years) White / Caucasian 75 42.7% Responsible for grandchildren101 57.3% Not responsible for grandchildrenBlack or African American 37 57.4% Responsible for grandchildren28 42.6% Not responsible for grandchildrenAsian 26 100.0% Not responsible for grandchildrenWhite alone, not Hispanic / Latino 76 40.5% Responsible for grandchildren112 59.5% Not responsible for grandchildrenGrandparents (60 years and over) White / Caucasian 35 17.7% Responsible for grandchildren163 82.3% Not responsible for grandchildrenBlack or African American 11 100.0% Not responsible for grandchildrenAsian 14 100.0% Not responsible for grandchildrenWhite alone, not Hispanic / Latino 36 20.9% Responsible for grandchildren134 79.1% Not responsible for grandchildren