Races in Collinsville, Illinois (IL) Detailed Stats
Data:
Races - White alone (%)
Races - White alone (% change since 2000)
Races - Black alone (%)
Races - Black alone (% change since 2000)
Races - American Indian alone (%)
Races - American Indian alone (% change since 2000)
Races - Asian alone (%)
Races - Asian alone (% change since 2000)
Races - Hispanic (%)
Races - Hispanic (% change since 2000)
Races - Native Hawaiian and Other Pacific Islander alone (%)
Races - Native Hawaiian and Other Pacific Islander alone (% change since 2000)
Races - Two or more races(%)
Races - Two or more races(% change since 2000)
Races - Other race alone (%)
Races - Other race alone (% change since 2000)
Racial diversity
Place of birth - Born in state of residence (%)
Place of birth - Born in state of residence (%) - White
Place of birth - Born in state of residence (%) - Black or African American
Place of birth - Born in state of residence (%) - Asian
Place of birth - Born in state of residence (%) - Hispanic or Latino
Place of birth - Born in state of residence (%) - American Indian and Alaska Native
Place of birth - Born in state of residence (%) - Multirace
Place of birth - Born in state of residence (%) - Other Race
Place of birth - Born in other state (%)
Place of birth - Born in other state (%) - White
Place of birth - Born in other state (%) - Black or African American
Place of birth - Born in other state (%) - Asian
Place of birth - Born in other state (%) - Hispanic or Latino
Place of birth - Born in other state (%) - American Indian and Alaska Native
Place of birth - Born in other state (%) - Multirace
Place of birth - Born in other state (%) - Other Race
Place of birth - Native, outside of US (%)
Place of birth - Native, outside of US (%) - White
Place of birth - Native, outside of US (%) - Black or African American
Place of birth - Native, outside of US (%) - Asian
Place of birth - Native, outside of US (%) - Hispanic or Latino
Place of birth - Native, outside of US (%) - American Indian and Alaska Native
Place of birth - Native, outside of US (%) - Multirace
Place of birth - Native, outside of US (%) - Other Race
Place of birth - Foreign born (%)
Place of birth - Foreign born (%) - White
Place of birth - Foreign born (%) - Black or African American
Place of birth - Foreign born (%) - Asian
Place of birth - Foreign born (%) - Hispanic or Latino
Place of birth - Foreign born (%) - American Indian and Alaska Native
Place of birth - Foreign born (%) - Multirace
Place of birth - Foreign born (%) - Other Race
Residents speaking English at home (%)
Residents speaking English at home - Born in the United States (%)
Residents speaking English at home - Native, born elsewhere (%)
Residents speaking English at home - Foreign born (%)
Residents speaking Spanish at home (%)
Residents speaking Spanish at home - Born in the United States (%)
Residents speaking Spanish at home - Native, born elsewhere (%)
Residents speaking Spanish at home - Foreign born (%)
Residents speaking other language at home (%)
Residents speaking other language at home - Born in the United States (%)
Residents speaking other language at home - Native, born elsewhere (%)
Residents speaking other language at home - Foreign born (%)
Marital status - Never married (%)
Marital status - Now married (%)
Marital status - Separated (%)
Marital status - Widowed (%)
Marital status - Divorced (%)
Ancestries Reported - Arab (%)
Ancestries Reported - Czech (%)
Ancestries Reported - Danish (%)
Ancestries Reported - Dutch (%)
Ancestries Reported - English (%)
Ancestries Reported - French (%)
Ancestries Reported - French Canadian (%)
Ancestries Reported - German (%)
Ancestries Reported - Greek (%)
Ancestries Reported - Hungarian (%)
Ancestries Reported - Irish (%)
Ancestries Reported - Italian (%)
Ancestries Reported - Lithuanian (%)
Ancestries Reported - Norwegian (%)
Ancestries Reported - Polish (%)
Ancestries Reported - Portuguese (%)
Ancestries Reported - Russian (%)
Ancestries Reported - Scotch-Irish (%)
Ancestries Reported - Scottish (%)
Ancestries Reported - Slovak (%)
Ancestries Reported - Subsaharan African (%)
Ancestries Reported - Swedish (%)
Ancestries Reported - Swiss (%)
Ancestries Reported - Ukrainian (%)
Ancestries Reported - United States (%)
Ancestries Reported - Welsh (%)
Ancestries Reported - West Indian (%)
Ancestries Reported - Other (%)
Geographical mobility - Same house 1 year ago (%)
Geographical mobility - Same house 1 year ago (%) - White
Geographical mobility - Same house 1 year ago (%) - Black or African American
Geographical mobility - Same house 1 year ago (%) - Asian
Geographical mobility - Same house 1 year ago (%) - Hispanic or Latino
Geographical mobility - Same house 1 year ago (%) - American Indian and Alaska Native
Geographical mobility - Same house 1 year ago (%) - Multirace
Geographical mobility - Same house 1 year ago (%) - Other Race
Geographical mobility - Moved within same county (%)
Geographical mobility - Moved within same county (%) - White
Geographical mobility - Moved within same county (%) - Black or African American
Geographical mobility - Moved within same county (%) - Asian
Geographical mobility - Moved within same county (%) - Hispanic or Latino
Geographical mobility - Moved within same county (%) - American Indian and Alaska Native
Geographical mobility - Moved within same county (%) - Multirace
Geographical mobility - Moved within same county (%) - Other Race
Geographical mobility - Moved from different county within same state (%)
Geographical mobility - Moved from different county within same state (%) - White
Geographical mobility - Moved from different county within same state (%) - Black or African American
Geographical mobility - Moved from different county within same state (%) - Asian
Geographical mobility - Moved from different county within same state (%) - Hispanic or Latino
Geographical mobility - Moved from different county within same state (%) - American Indian and Alaska Native
Geographical mobility - Moved from different county within same state (%) - Multirace
Geographical mobility - Moved from different county within same state (%) - Other Race
Geographical mobility - Moved from different state (%)
Geographical mobility - Moved from different state (%) - White
Geographical mobility - Moved from different state (%) - Black or African American
Geographical mobility - Moved from different state (%) - Asian
Geographical mobility - Moved from different state (%) - Hispanic or Latino
Geographical mobility - Moved from different state (%) - American Indian and Alaska Native
Geographical mobility - Moved from different state (%) - Multirace
Geographical mobility - Moved from different state (%) - Other Race
Geographical mobility - Moved from abroad (%)
Geographical mobility - Moved from abroad (%) - White
Geographical mobility - Moved from abroad (%) - Black or African American
Geographical mobility - Moved from abroad (%) - Asian
Geographical mobility - Moved from abroad (%) - Hispanic or Latino
Geographical mobility - Moved from abroad (%) - American Indian and Alaska Native
Geographical mobility - Moved from abroad (%) - Multirace
Geographical mobility - Moved from abroad (%) - Other Race
Place of birth for the foreign-born population - Ireland (%)
Place of birth for the foreign-born population - Denmark (%)
Place of birth for the foreign-born population - Norway (%)
Place of birth for the foreign-born population - Sweden (%)
Place of birth for the foreign-born population - United Kingdom (%)
Place of birth for the foreign-born population - England (%)
Place of birth for the foreign-born population - Scotland (%)
Place of birth for the foreign-born population - Other Northern Europe (%)
Place of birth for the foreign-born population - Austria (%)
Place of birth for the foreign-born population - Belgium (%)
Place of birth for the foreign-born population - France (%)
Place of birth for the foreign-born population - Germany (%)
Place of birth for the foreign-born population - Netherlands (%)
Place of birth for the foreign-born population - Switzerland (%)
Place of birth for the foreign-born population - Other Western Europe (%)
Place of birth for the foreign-born population - Greece (%)
Place of birth for the foreign-born population - Italy (%)
Place of birth for the foreign-born population - Portugal (%)
Place of birth for the foreign-born population - Spain (%)
Place of birth for the foreign-born population - Other Southern Europe (%)
Place of birth for the foreign-born population - Albania (%)
Place of birth for the foreign-born population - Belarus (%)
Place of birth for the foreign-born population - Bosnia and Herzegovina (%)
Place of birth for the foreign-born population - Bulgaria (%)
Place of birth for the foreign-born population - Croatia (%)
Place of birth for the foreign-born population - Czechoslovakia (%)
Place of birth for the foreign-born population - Hungary (%)
Place of birth for the foreign-born population - Latvia (%)
Place of birth for the foreign-born population - Lithuania (%)
Place of birth for the foreign-born population - North Macedonia (Macedonia) (%)
Place of birth for the foreign-born population - Moldova (%)
Place of birth for the foreign-born population - Poland (%)
Place of birth for the foreign-born population - Romania (%)
Place of birth for the foreign-born population - Russia (%)
Place of birth for the foreign-born population - Serbia (%)
Place of birth for the foreign-born population - Ukraine (%)
Place of birth for the foreign-born population - Other Eastern Europe (%)
Place of birth for the foreign-born population - China (%)
Place of birth for the foreign-born population - Hong Kong (%)
Place of birth for the foreign-born population - Taiwan (%)
Place of birth for the foreign-born population - Japan (%)
Place of birth for the foreign-born population - Korea (%)
Place of birth for the foreign-born population - Other Eastern Asia (%)
Place of birth for the foreign-born population - Afghanistan (%)
Place of birth for the foreign-born population - Bangladesh (%)
Place of birth for the foreign-born population - India (%)
Place of birth for the foreign-born population - Iran (%)
Place of birth for the foreign-born population - Kazakhstan (%)
Place of birth for the foreign-born population - Nepal (%)
Place of birth for the foreign-born population - Pakistan (%)
Place of birth for the foreign-born population - Sri Lanka (%)
Place of birth for the foreign-born population - Uzbekistan (%)
Place of birth for the foreign-born population - Other South Central Asia (%)
Place of birth for the foreign-born population - Burma (%)
Place of birth for the foreign-born population - Cambodia (%)
Place of birth for the foreign-born population - Indonesia (%)
Place of birth for the foreign-born population - Laos (%)
Place of birth for the foreign-born population - Malaysia (%)
Place of birth for the foreign-born population - Philippines (%)
Place of birth for the foreign-born population - Singapore (%)
Place of birth for the foreign-born population - Thailand (%)
Place of birth for the foreign-born population - Vietnam (%)
Place of birth for the foreign-born population - Other South Eastern Asia (%)
Place of birth for the foreign-born population - Armenia (%)
Place of birth for the foreign-born population - Iraq (%)
Place of birth for the foreign-born population - Israel (%)
Place of birth for the foreign-born population - Jordan (%)
Place of birth for the foreign-born population - Kuwait (%)
Place of birth for the foreign-born population - Lebanon (%)
Place of birth for the foreign-born population - Saudi Arabia (%)
Place of birth for the foreign-born population - Syria (%)
Place of birth for the foreign-born population - Turkey (%)
Place of birth for the foreign-born population - Yemen (%)
Place of birth for the foreign-born population - Other Western Asia (%)
Place of birth for the foreign-born population - Eritrea (%)
Place of birth for the foreign-born population - Ethiopia (%)
Place of birth for the foreign-born population - Kenya (%)
Place of birth for the foreign-born population - Somalia (%)
Place of birth for the foreign-born population - Uganda (%)
Place of birth for the foreign-born population - Zimbabwe (%)
Place of birth for the foreign-born population - Other Eastern Africa (%)
Place of birth for the foreign-born population - Cameroon (%)
Place of birth for the foreign-born population - Congo (%)
Place of birth for the foreign-born population - Democratic Republic of Congo (Zaire) (%)
Place of birth for the foreign-born population - Other Middle Africa (%)
Place of birth for the foreign-born population - Egypt (%)
Place of birth for the foreign-born population - Morocco (%)
Place of birth for the foreign-born population - Sudan (%)
Place of birth for the foreign-born population - Other Northern Africa (%)
Place of birth for the foreign-born population - South Africa (%)
Place of birth for the foreign-born population - Other Southern Africa (%)
Place of birth for the foreign-born population - Cabo Verde (%)
Place of birth for the foreign-born population - Ghana (%)
Place of birth for the foreign-born population - Liberia (%)
Place of birth for the foreign-born population - Nigeria (%)
Place of birth for the foreign-born population - Senegal (%)
Place of birth for the foreign-born population - Sierra Leone (%)
Place of birth for the foreign-born population - Other Western Africa (%)
Place of birth for the foreign-born population - Australia (%)
Place of birth for the foreign-born population - New Zealand (%)
Place of birth for the foreign-born population - Fiji (%)
Place of birth for the foreign-born population - Micronesia (%)
Place of birth for the foreign-born population - Bahamas (%)
Place of birth for the foreign-born population - Barbados (%)
Place of birth for the foreign-born population - Cuba (%)
Place of birth for the foreign-born population - Dominica (%)
Place of birth for the foreign-born population - Dominican Republic (%)
Place of birth for the foreign-born population - Grenada (%)
Place of birth for the foreign-born population - Haiti (%)
Place of birth for the foreign-born population - Jamaica (%)
Place of birth for the foreign-born population - St. Vincent and the Grenadines (%)
Place of birth for the foreign-born population - Trinidad and Tobago (%)
Place of birth for the foreign-born population - West Indies (%)
Place of birth for the foreign-born population - Other Caribbean (%)
Place of birth for the foreign-born population - Belize (%)
Place of birth for the foreign-born population - Costa Rica (%)
Place of birth for the foreign-born population - El Salvador (%)
Place of birth for the foreign-born population - Guatemala (%)
Place of birth for the foreign-born population - Honduras (%)
Place of birth for the foreign-born population - Mexico (%)
Place of birth for the foreign-born population - Nicaragua (%)
Place of birth for the foreign-born population - Panama (%)
Place of birth for the foreign-born population - Other Central America (%)
Place of birth for the foreign-born population - Argentina (%)
Place of birth for the foreign-born population - Bolivia (%)
Place of birth for the foreign-born population - Brazil (%)
Place of birth for the foreign-born population - Chile (%)
Place of birth for the foreign-born population - Colombia (%)
Place of birth for the foreign-born population - Ecuador (%)
Place of birth for the foreign-born population - Guyana (%)
Place of birth for the foreign-born population - Peru (%)
Place of birth for the foreign-born population - Uruguay (%)
Place of birth for the foreign-born population - Venezuela (%)
Place of birth for the foreign-born population - Other South America (%)
Place of birth for the foreign-born population - Canada (%)
Place of birth for the foreign-born population - Other Northern America (%)
Place of birth for the foreign-born population - Other (%)
Latest news about races in Collinsville, IL collected exclusively by city-data.com from local newspapers, TV, and radio stations
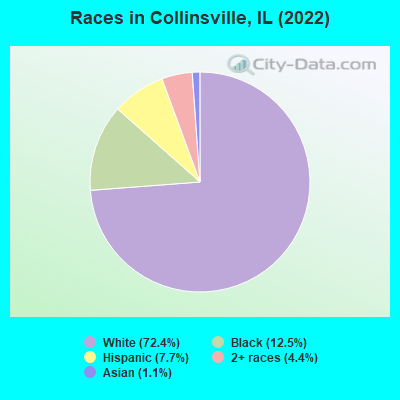
According to 2022 data, the most numerous races in Collinsville, IL are White alone (17,488 residents), Hispanic (1,861 residents), and Black alone (3,006 residents). 94.0% of Collinsville residents speak English at home. 3.8% of Collinsville, IL residents are foreign-born (1.8% born in Latin America, 0.7% born in Europe, 0.7% born in Asia, 0.5% born in Africa), which is 267.4% less than the foreign-born rate of 14.0% across the entire state of Illinois.
Race distribution in Collinsville
2000 2022
8,424,140 67.8% White alone 1,856,152 14.9% Black alone 1,530,262 12.3% Hispanic 419,916 3.4% Asian alone 153,996 1.2% Two or more races 13,479 0.1% Other race alone 18,232 0.1% American Indian alone 3,116 0.03% Native Hawaiian and Other
7,356,301 58.5% White alone 2,299,726 18.3% Hispanic 1,660,423 13.2% Black alone 747,296 5.9% Asian alone 458,599 3.6% Two or more races 45,386 0.4% Other race alone 10,405 0.08% American Indian alone 3,896 0.03% Native Hawaiian and Other
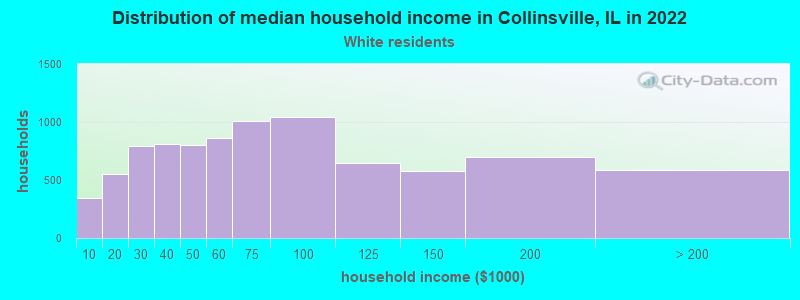
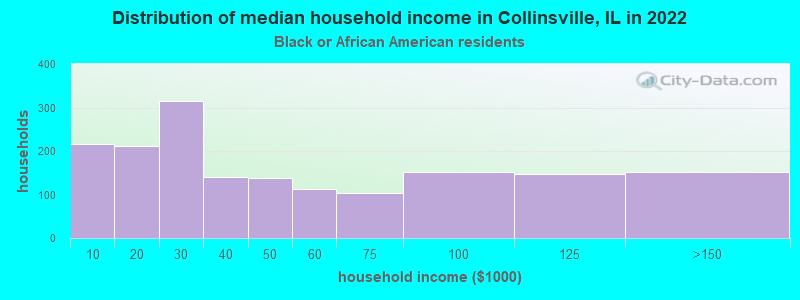
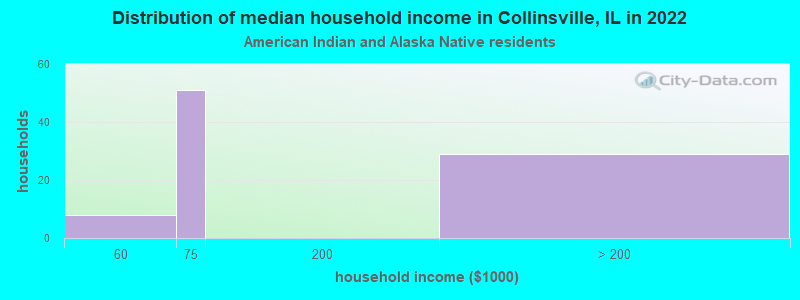
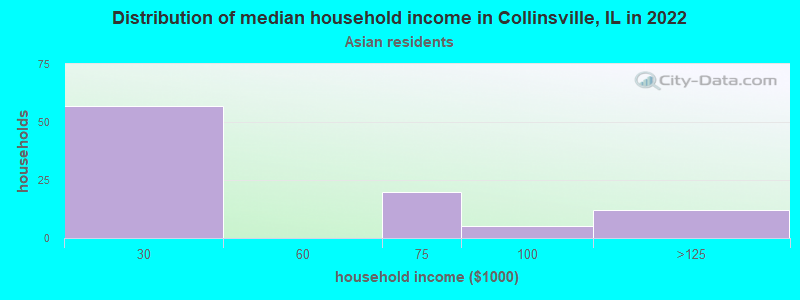
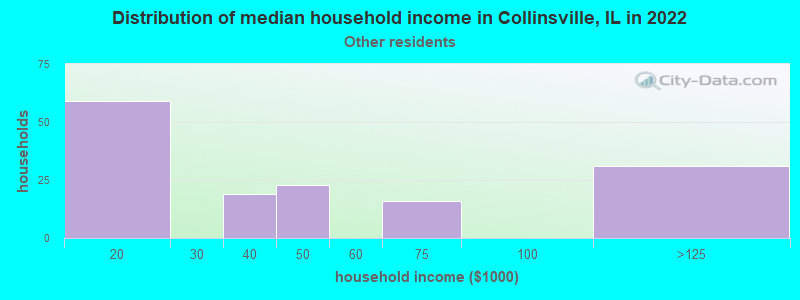
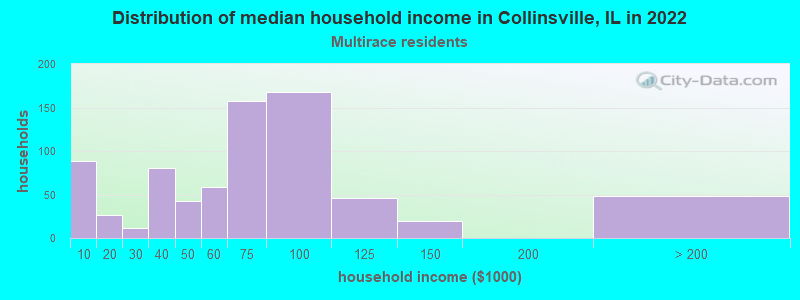
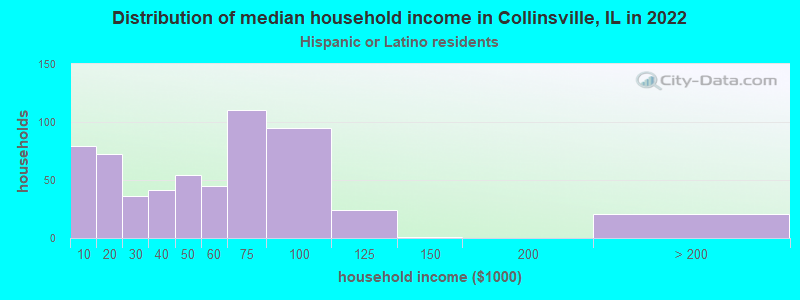
Income and house value in Collinsville Median household income in 2022 $62,337 White non-Hispanic householders$40,794 Black householders$59,587 Two or more races householders$49,918 Hispanic or Latino race householdersMedian 2022 house value $166,354 White Non-Hispanic householders$149,521 Black or African American householders$142,985 American Indian or Alaska Native householders$222,796 Native Hawaiian and other Pacific Islander householders$222,796 Some other race householders$106,744 Two or more races householders$159,621 Hispanic or Latino householders
Median age by race in Collinsville
45.1 Median age for White residents44.3 46.0 26.8 Median age for Black or African American residents23.6 31.0 39.5 Median age for American Indian / Alaska Native residents44.8 38.3 28.0 Median age for Asian residents23.7 38.3 -593,236,714.4 Median age for Native Hawaiian / Pacific Islander residents-666,666,666.0 -666,666,666.0 40.0 Median age for Other race residents41.2 33.4 44.7 Median age for Two or more races residents42.5 46.6 45.0 Median age for White alone residents44.4 46.0 36.1 Median age for Hispanic or Latino residents35.8 35.1
Owner/renter occupied households by race in Collinsville
House owners and renters - White residents 6,305 72.5% Owner occupied2,389 27.5% Renter occupiedHouse owners and renters - Black or African American residents 100 7.6% Owner occupied1,219 92.4% Renter occupiedHouse owners and renters - American Indian / Alaska Native residents 88 90.6% Owner occupied9 9.4% Renter occupiedHouse owners and renters - Asian residents 85 81.6% Owner occupied19 18.4% Renter occupiedHouse owners and renters - Other race residents 96 69.2% Owner occupied42 30.8% Renter occupiedHouse owners and renters - Two or more races residents 574 58.5% Owner occupied408 41.5% Renter occupiedHouse owners and renters - White alone residents 6,269 72.8% Owner occupied2,345 27.2% Renter occupiedHouse owners and renters - Hispanic or Latino residents 341 70.9% Owner occupied140 29.1% Renter occupied
Language usage in Collinsville
English speakers - Total 94.0% of residents of Collinsville speak English at home.
3.4% of residents speak Spanish at home 464 60.0% Speak English very well309 40.0% Speak English less than very well2.0% of residents speak other language at home 370 82.4% Speak English very well79 17.6% Speak English less than very well
English speakers - Born in the United States 97.7% of residents of Collinsville speak English at home.
1.7% of residents speak Spanish at home 76 61.8% Speak English very well47 38.2% Speak English less than very well0.3% of residents speak other language at home 24 100.0% Speak English very well
English speakers - Native, born elsewhere 85.6% of residents of Collinsville speak English at home.
7.1% of residents speak Spanish at home 28 100.0% Speak English very well
English speakers - Foreign-born 12.2% of residents of Collinsville speak English at home.
34.9% of residents speak Spanish at home 121 39.8% Speak English very well183 60.2% Speak English less than very well54.4% of residents speak other language at home 387 81.8% Speak English very well86 18.2% Speak English less than very well
White (Caucasian) - Speak only English Native:
98.9% (16,805)Foreign-born:
11.4% (30)
White (Caucasian) - Speak another language Native:
1.0% (164)Foreign-born:
88.4% (232)
Black or African American - Speak only English Native:
100.0% (3,232)Foreign-born:
11.4% (10)
American Indian / Alaska Native - Speak another language Native:
21.5% (45)Foreign-born:
100.0% (19)
Asian - Speak only English Native:
71.8% (36)Foreign-born:
28.2% (47)
Other race - Speak only English Native:
18.2% (35)Foreign-born:
9.3% (17)
Other race - Speak another language Native:
80.6% (154)Foreign-born:
90.7% (162)
Two or more races - Speak only English Native:
73.4% (1,438)Foreign-born:
12.6% (40)
Two or more races - Speak another language Native:
14.0% (275)Foreign-born:
88.2% (277)
White alone - Speak only English Native:
99.3% (16,540)Foreign-born:
9.4% (25)
White alone - Speak another language Native:
0.7% (118)Foreign-born:
100.0% (264)
Hispanic or Latino - Speak only English Native:
64.0% (902)Foreign-born:
10.1% (35)
Hispanic or Latino - Speak another language Native:
25.4% (358)Foreign-born:
90.2% (310)
Foreign-born residents in Collinsville 920 residents are foreign born (1.8% Latin America , 0.7% Europe , 0.7% Asia , 0.5% Africa ).
This city:
3.8%Illinois:
14.1%
Marital status for residents in Collinsville Marital status - White (Caucasian) population 15 years and over
Males 32.3% Never married50.2% Now married1.0% Separated3.6% Widowed12.9% DivorcedFemales 24.0% Never married50.5% Now married1.7% Separated10.3% Widowed13.4% DivorcedWomen who gave birth in the past 12 months Now married:
100.0% (134)Unmarried:
0.0% (0)
Women who did not give birth in the past 12 months Now married:
46.0% (1,694)Unmarried:
54.0% (1,992)
Marital status - Black or African American population 15 years and over
Males 62.8% Never married27.8% Now married1.3% Separated0.5% Widowed7.6% DivorcedFemales 54.6% Never married29.3% Now married3.3% Separated5.3% Widowed7.6% DivorcedWomen who gave birth in the past 12 months Now married:
23.3% (34)Unmarried:
76.7% (111)
Women who did not give birth in the past 12 months Now married:
31.0% (320)Unmarried:
69.0% (713)
Marital status - American Indian / Alaska Native population 15 years and over
Males 37.8% Never married34.4% Now married0.0% Separated0.0% Widowed27.8% DivorcedFemales 48.1% Never married51.9% Now married0.0% Separated0.0% Widowed0.0% DivorcedWomen who did not give birth in the past 12 months Now married:
51.9% (45)Unmarried:
48.1% (42)
Marital status - Asian population 15 years and over
Males 58.9% Never married41.1% Now married0.0% Separated0.0% Widowed0.0% DivorcedFemales 17.4% Never married82.6% Now married0.0% Separated0.0% Widowed0.0% DivorcedWomen who did not give birth in the past 12 months Now married:
81.6% (72)Unmarried:
18.4% (16)
Marital status - Other race population 15 years and over
Males 41.9% Never married58.1% Now married0.0% Separated0.0% Widowed0.0% DivorcedFemales 25.5% Never married57.9% Now married0.0% Separated16.6% Widowed0.0% DivorcedWomen who did not give birth in the past 12 months Now married:
69.4% (98)Unmarried:
30.6% (43)
Marital status - Two or more races population 15 years and over
Males 39.4% Never married36.4% Now married0.0% Separated0.0% Widowed24.3% DivorcedFemales 39.5% Never married31.1% Now married1.4% Separated2.3% Widowed25.6% DivorcedWomen who gave birth in the past 12 months Now married:
0.0% (0)Unmarried:
100.0% (41)
Women who did not give birth in the past 12 months Now married:
28.2% (176)Unmarried:
71.8% (448)
Marital status - White alone, not Hispanic / Latino population 15 years and over
Males 32.0% Never married50.2% Now married1.0% Separated3.7% Widowed13.2% DivorcedFemales 23.5% Never married51.1% Now married1.8% Separated10.2% Widowed13.4% DivorcedWomen who gave birth in the past 12 months Now married:
100.0% (129)Unmarried:
0.0% (0)
Women who did not give birth in the past 12 months Now married:
47.2% (1,701)Unmarried:
52.8% (1,905)
Marital status - Hispanic or Latino population 15 years and over
Males 45.6% Never married44.7% Now married0.0% Separated0.0% Widowed9.8% DivorcedFemales 36.2% Never married41.7% Now married1.2% Separated11.1% Widowed9.8% DivorcedWomen who gave birth in the past 12 months Now married:
46.7% (7)Unmarried:
53.3% (8)
Women who did not give birth in the past 12 months Now married:
45.1% (200)Unmarried:
54.9% (243)
Ancestries in Collinsville
1,864 18.9% German841 8.5% Irish801 8.1% American599 6.1% English518 5.2% Italian333 3.4% Polish203 2.1% French174 1.8% European88 0.9% African80 0.8% Romanian77 0.8% Scotch-Irish67 0.7% Ghanaian56 0.6% Dutch50 0.5% Scottish43 0.4% Portuguese43 0.4% Scandinavian40 0.4% Eastern European33 0.3% Bulgarian29 0.3% Iranian25 0.3% French Canadian24 0.2% British24 0.2% Swedish24 0.2% Welsh17 0.2% West Indian14 0.1% Canadian10 0.1% Czech10 0.1% Lithuanian10 0.1% Austrian9 0.09% Slovene9 0.09% Croatian7 0.07% German Russian7 0.07% Danish6 0.06% Hungarian
Geographical mobility in Collinsville Same house 1 year ago 16,559 93.1% White (Caucasian)2,538 85.5% Black or African American203 87.1% American Indian / Alaska Native277 93.9% Asian418 100.0% Other race2,051 90.6% Two or more races16,242 93.2% White alone, not Hispanic / Latino1,587 86.4% Hispanic or LatinoMoved within same county 436 2.4% White / Caucasian237 8.0% Black or African American16 5.5% Asian8 0.4% Two or more races390 2.2% White alone, not Hispanic / Latino74 4.0% Hispanic or LatinoMoved within same state 490 2.8% White / Caucasian73 2.5% Black or African American28 1.3% Two or more races479 2.7% White alone, not Hispanic / Latino60 3.3% Hispanic or LatinoMoved from different state 565 3.2% White / Caucasian247 8.3% Black or African American29 12.5% American Indian / Alaska Native158 7.0% Two or more races588 3.4% White alone, not Hispanic / Latino135 7.4% Hispanic or LatinoMoved from abroad 4 0.0% White45 1.5% Black or African American5 0.0% White alone, not Hispanic / Latino
Children Nativity (place of birth) in Collinsville
Children under 6 years - Living with two parents Both parents native 849 100.0% NativeBoth parents foreign-born 24 51.9% Native22 48.1% Foreign-bornOne native, one foreign-born parent 41 100.0% NativeChildren under 6 years - Living with one parent Native parent 382 100.0% NativeForeign-born parent 33 100.0% Foreign-bornChildren 6 to 17 years - Living with two parents Both parents native 1,795 100.0% NativeBoth parents foreign-born 68 100.0% NativeOne native, one foreign-born parent 111 100.0% NativeChildren 6 to 17 years - Living with one parent Native parent 917 100.0% NativeForeign-born parent 80 49.8% Native80 50.2% Foreign-born
Grandparents responsible for own grandchildren in Collinsville
Grandparents (30 to 59 years) White / Caucasian 12 54.2% Responsible for grandchildren11 45.8% Not responsible for grandchildrenAsian 17 100.0% Responsible for grandchildrenOther race 32 100.0% Responsible for grandchildrenWhite alone, not Hispanic / Latino 11 100.0% Not responsible for grandchildrenHispanic or Latino 34 100.0% Responsible for grandchildren
Grandparents (60 years and over) White / Caucasian 35 100.0% Not responsible for grandchildrenWhite alone, not Hispanic / Latino 35 100.0% Not responsible for grandchildrenHispanic or Latino 10 100.0% Not responsible for grandchildren