Races in College Park, Maryland (MD) Detailed Stats
Data:
Races - White alone (%)
Races - White alone (% change since 2000)
Races - Black alone (%)
Races - Black alone (% change since 2000)
Races - American Indian alone (%)
Races - American Indian alone (% change since 2000)
Races - Asian alone (%)
Races - Asian alone (% change since 2000)
Races - Hispanic (%)
Races - Hispanic (% change since 2000)
Races - Native Hawaiian and Other Pacific Islander alone (%)
Races - Native Hawaiian and Other Pacific Islander alone (% change since 2000)
Races - Two or more races(%)
Races - Two or more races(% change since 2000)
Races - Other race alone (%)
Races - Other race alone (% change since 2000)
Racial diversity
Place of birth - Born in state of residence (%)
Place of birth - Born in state of residence (%) - White
Place of birth - Born in state of residence (%) - Black or African American
Place of birth - Born in state of residence (%) - Asian
Place of birth - Born in state of residence (%) - Hispanic or Latino
Place of birth - Born in state of residence (%) - American Indian and Alaska Native
Place of birth - Born in state of residence (%) - Multirace
Place of birth - Born in state of residence (%) - Other Race
Place of birth - Born in other state (%)
Place of birth - Born in other state (%) - White
Place of birth - Born in other state (%) - Black or African American
Place of birth - Born in other state (%) - Asian
Place of birth - Born in other state (%) - Hispanic or Latino
Place of birth - Born in other state (%) - American Indian and Alaska Native
Place of birth - Born in other state (%) - Multirace
Place of birth - Born in other state (%) - Other Race
Place of birth - Native, outside of US (%)
Place of birth - Native, outside of US (%) - White
Place of birth - Native, outside of US (%) - Black or African American
Place of birth - Native, outside of US (%) - Asian
Place of birth - Native, outside of US (%) - Hispanic or Latino
Place of birth - Native, outside of US (%) - American Indian and Alaska Native
Place of birth - Native, outside of US (%) - Multirace
Place of birth - Native, outside of US (%) - Other Race
Place of birth - Foreign born (%)
Place of birth - Foreign born (%) - White
Place of birth - Foreign born (%) - Black or African American
Place of birth - Foreign born (%) - Asian
Place of birth - Foreign born (%) - Hispanic or Latino
Place of birth - Foreign born (%) - American Indian and Alaska Native
Place of birth - Foreign born (%) - Multirace
Place of birth - Foreign born (%) - Other Race
Residents speaking English at home (%)
Residents speaking English at home - Born in the United States (%)
Residents speaking English at home - Native, born elsewhere (%)
Residents speaking English at home - Foreign born (%)
Residents speaking Spanish at home (%)
Residents speaking Spanish at home - Born in the United States (%)
Residents speaking Spanish at home - Native, born elsewhere (%)
Residents speaking Spanish at home - Foreign born (%)
Residents speaking other language at home (%)
Residents speaking other language at home - Born in the United States (%)
Residents speaking other language at home - Native, born elsewhere (%)
Residents speaking other language at home - Foreign born (%)
Marital status - Never married (%)
Marital status - Now married (%)
Marital status - Separated (%)
Marital status - Widowed (%)
Marital status - Divorced (%)
Ancestries Reported - Arab (%)
Ancestries Reported - Czech (%)
Ancestries Reported - Danish (%)
Ancestries Reported - Dutch (%)
Ancestries Reported - English (%)
Ancestries Reported - French (%)
Ancestries Reported - French Canadian (%)
Ancestries Reported - German (%)
Ancestries Reported - Greek (%)
Ancestries Reported - Hungarian (%)
Ancestries Reported - Irish (%)
Ancestries Reported - Italian (%)
Ancestries Reported - Lithuanian (%)
Ancestries Reported - Norwegian (%)
Ancestries Reported - Polish (%)
Ancestries Reported - Portuguese (%)
Ancestries Reported - Russian (%)
Ancestries Reported - Scotch-Irish (%)
Ancestries Reported - Scottish (%)
Ancestries Reported - Slovak (%)
Ancestries Reported - Subsaharan African (%)
Ancestries Reported - Swedish (%)
Ancestries Reported - Swiss (%)
Ancestries Reported - Ukrainian (%)
Ancestries Reported - United States (%)
Ancestries Reported - Welsh (%)
Ancestries Reported - West Indian (%)
Ancestries Reported - Other (%)
Geographical mobility - Same house 1 year ago (%)
Geographical mobility - Same house 1 year ago (%) - White
Geographical mobility - Same house 1 year ago (%) - Black or African American
Geographical mobility - Same house 1 year ago (%) - Asian
Geographical mobility - Same house 1 year ago (%) - Hispanic or Latino
Geographical mobility - Same house 1 year ago (%) - American Indian and Alaska Native
Geographical mobility - Same house 1 year ago (%) - Multirace
Geographical mobility - Same house 1 year ago (%) - Other Race
Geographical mobility - Moved within same county (%)
Geographical mobility - Moved within same county (%) - White
Geographical mobility - Moved within same county (%) - Black or African American
Geographical mobility - Moved within same county (%) - Asian
Geographical mobility - Moved within same county (%) - Hispanic or Latino
Geographical mobility - Moved within same county (%) - American Indian and Alaska Native
Geographical mobility - Moved within same county (%) - Multirace
Geographical mobility - Moved within same county (%) - Other Race
Geographical mobility - Moved from different county within same state (%)
Geographical mobility - Moved from different county within same state (%) - White
Geographical mobility - Moved from different county within same state (%) - Black or African American
Geographical mobility - Moved from different county within same state (%) - Asian
Geographical mobility - Moved from different county within same state (%) - Hispanic or Latino
Geographical mobility - Moved from different county within same state (%) - American Indian and Alaska Native
Geographical mobility - Moved from different county within same state (%) - Multirace
Geographical mobility - Moved from different county within same state (%) - Other Race
Geographical mobility - Moved from different state (%)
Geographical mobility - Moved from different state (%) - White
Geographical mobility - Moved from different state (%) - Black or African American
Geographical mobility - Moved from different state (%) - Asian
Geographical mobility - Moved from different state (%) - Hispanic or Latino
Geographical mobility - Moved from different state (%) - American Indian and Alaska Native
Geographical mobility - Moved from different state (%) - Multirace
Geographical mobility - Moved from different state (%) - Other Race
Geographical mobility - Moved from abroad (%)
Geographical mobility - Moved from abroad (%) - White
Geographical mobility - Moved from abroad (%) - Black or African American
Geographical mobility - Moved from abroad (%) - Asian
Geographical mobility - Moved from abroad (%) - Hispanic or Latino
Geographical mobility - Moved from abroad (%) - American Indian and Alaska Native
Geographical mobility - Moved from abroad (%) - Multirace
Geographical mobility - Moved from abroad (%) - Other Race
Place of birth for the foreign-born population - Ireland (%)
Place of birth for the foreign-born population - Denmark (%)
Place of birth for the foreign-born population - Norway (%)
Place of birth for the foreign-born population - Sweden (%)
Place of birth for the foreign-born population - United Kingdom (%)
Place of birth for the foreign-born population - England (%)
Place of birth for the foreign-born population - Scotland (%)
Place of birth for the foreign-born population - Other Northern Europe (%)
Place of birth for the foreign-born population - Austria (%)
Place of birth for the foreign-born population - Belgium (%)
Place of birth for the foreign-born population - France (%)
Place of birth for the foreign-born population - Germany (%)
Place of birth for the foreign-born population - Netherlands (%)
Place of birth for the foreign-born population - Switzerland (%)
Place of birth for the foreign-born population - Other Western Europe (%)
Place of birth for the foreign-born population - Greece (%)
Place of birth for the foreign-born population - Italy (%)
Place of birth for the foreign-born population - Portugal (%)
Place of birth for the foreign-born population - Spain (%)
Place of birth for the foreign-born population - Other Southern Europe (%)
Place of birth for the foreign-born population - Albania (%)
Place of birth for the foreign-born population - Belarus (%)
Place of birth for the foreign-born population - Bosnia and Herzegovina (%)
Place of birth for the foreign-born population - Bulgaria (%)
Place of birth for the foreign-born population - Croatia (%)
Place of birth for the foreign-born population - Czechoslovakia (%)
Place of birth for the foreign-born population - Hungary (%)
Place of birth for the foreign-born population - Latvia (%)
Place of birth for the foreign-born population - Lithuania (%)
Place of birth for the foreign-born population - North Macedonia (Macedonia) (%)
Place of birth for the foreign-born population - Moldova (%)
Place of birth for the foreign-born population - Poland (%)
Place of birth for the foreign-born population - Romania (%)
Place of birth for the foreign-born population - Russia (%)
Place of birth for the foreign-born population - Serbia (%)
Place of birth for the foreign-born population - Ukraine (%)
Place of birth for the foreign-born population - Other Eastern Europe (%)
Place of birth for the foreign-born population - China (%)
Place of birth for the foreign-born population - Hong Kong (%)
Place of birth for the foreign-born population - Taiwan (%)
Place of birth for the foreign-born population - Japan (%)
Place of birth for the foreign-born population - Korea (%)
Place of birth for the foreign-born population - Other Eastern Asia (%)
Place of birth for the foreign-born population - Afghanistan (%)
Place of birth for the foreign-born population - Bangladesh (%)
Place of birth for the foreign-born population - India (%)
Place of birth for the foreign-born population - Iran (%)
Place of birth for the foreign-born population - Kazakhstan (%)
Place of birth for the foreign-born population - Nepal (%)
Place of birth for the foreign-born population - Pakistan (%)
Place of birth for the foreign-born population - Sri Lanka (%)
Place of birth for the foreign-born population - Uzbekistan (%)
Place of birth for the foreign-born population - Other South Central Asia (%)
Place of birth for the foreign-born population - Burma (%)
Place of birth for the foreign-born population - Cambodia (%)
Place of birth for the foreign-born population - Indonesia (%)
Place of birth for the foreign-born population - Laos (%)
Place of birth for the foreign-born population - Malaysia (%)
Place of birth for the foreign-born population - Philippines (%)
Place of birth for the foreign-born population - Singapore (%)
Place of birth for the foreign-born population - Thailand (%)
Place of birth for the foreign-born population - Vietnam (%)
Place of birth for the foreign-born population - Other South Eastern Asia (%)
Place of birth for the foreign-born population - Armenia (%)
Place of birth for the foreign-born population - Iraq (%)
Place of birth for the foreign-born population - Israel (%)
Place of birth for the foreign-born population - Jordan (%)
Place of birth for the foreign-born population - Kuwait (%)
Place of birth for the foreign-born population - Lebanon (%)
Place of birth for the foreign-born population - Saudi Arabia (%)
Place of birth for the foreign-born population - Syria (%)
Place of birth for the foreign-born population - Turkey (%)
Place of birth for the foreign-born population - Yemen (%)
Place of birth for the foreign-born population - Other Western Asia (%)
Place of birth for the foreign-born population - Eritrea (%)
Place of birth for the foreign-born population - Ethiopia (%)
Place of birth for the foreign-born population - Kenya (%)
Place of birth for the foreign-born population - Somalia (%)
Place of birth for the foreign-born population - Uganda (%)
Place of birth for the foreign-born population - Zimbabwe (%)
Place of birth for the foreign-born population - Other Eastern Africa (%)
Place of birth for the foreign-born population - Cameroon (%)
Place of birth for the foreign-born population - Congo (%)
Place of birth for the foreign-born population - Democratic Republic of Congo (Zaire) (%)
Place of birth for the foreign-born population - Other Middle Africa (%)
Place of birth for the foreign-born population - Egypt (%)
Place of birth for the foreign-born population - Morocco (%)
Place of birth for the foreign-born population - Sudan (%)
Place of birth for the foreign-born population - Other Northern Africa (%)
Place of birth for the foreign-born population - South Africa (%)
Place of birth for the foreign-born population - Other Southern Africa (%)
Place of birth for the foreign-born population - Cabo Verde (%)
Place of birth for the foreign-born population - Ghana (%)
Place of birth for the foreign-born population - Liberia (%)
Place of birth for the foreign-born population - Nigeria (%)
Place of birth for the foreign-born population - Senegal (%)
Place of birth for the foreign-born population - Sierra Leone (%)
Place of birth for the foreign-born population - Other Western Africa (%)
Place of birth for the foreign-born population - Australia (%)
Place of birth for the foreign-born population - New Zealand (%)
Place of birth for the foreign-born population - Fiji (%)
Place of birth for the foreign-born population - Micronesia (%)
Place of birth for the foreign-born population - Bahamas (%)
Place of birth for the foreign-born population - Barbados (%)
Place of birth for the foreign-born population - Cuba (%)
Place of birth for the foreign-born population - Dominica (%)
Place of birth for the foreign-born population - Dominican Republic (%)
Place of birth for the foreign-born population - Grenada (%)
Place of birth for the foreign-born population - Haiti (%)
Place of birth for the foreign-born population - Jamaica (%)
Place of birth for the foreign-born population - St. Vincent and the Grenadines (%)
Place of birth for the foreign-born population - Trinidad and Tobago (%)
Place of birth for the foreign-born population - West Indies (%)
Place of birth for the foreign-born population - Other Caribbean (%)
Place of birth for the foreign-born population - Belize (%)
Place of birth for the foreign-born population - Costa Rica (%)
Place of birth for the foreign-born population - El Salvador (%)
Place of birth for the foreign-born population - Guatemala (%)
Place of birth for the foreign-born population - Honduras (%)
Place of birth for the foreign-born population - Mexico (%)
Place of birth for the foreign-born population - Nicaragua (%)
Place of birth for the foreign-born population - Panama (%)
Place of birth for the foreign-born population - Other Central America (%)
Place of birth for the foreign-born population - Argentina (%)
Place of birth for the foreign-born population - Bolivia (%)
Place of birth for the foreign-born population - Brazil (%)
Place of birth for the foreign-born population - Chile (%)
Place of birth for the foreign-born population - Colombia (%)
Place of birth for the foreign-born population - Ecuador (%)
Place of birth for the foreign-born population - Guyana (%)
Place of birth for the foreign-born population - Peru (%)
Place of birth for the foreign-born population - Uruguay (%)
Place of birth for the foreign-born population - Venezuela (%)
Place of birth for the foreign-born population - Other South America (%)
Place of birth for the foreign-born population - Canada (%)
Place of birth for the foreign-born population - Other Northern America (%)
Place of birth for the foreign-born population - Other (%)
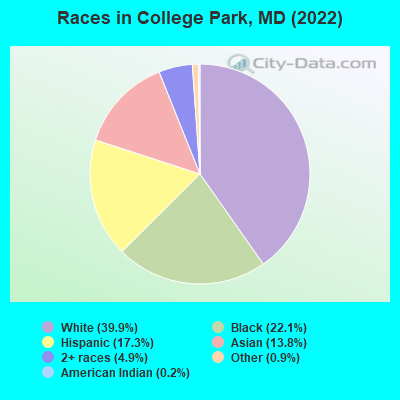
According to 2022 data, the most numerous races in College Park, MD are White alone (13,582 residents), Black alone (7,533 residents), and Hispanic (5,879 residents). 68.6% of College Park residents speak English at home. 24.9% of College Park, MD residents are foreign-born (10.7% born in Latin America, 8.9% born in Asia), which is 35.7% greater than the foreign-born rate of 16.0% across the entire state of Maryland.
Race distribution in College Park
2000 2022
3,286,547 62.1% White alone 1,464,735 27.7% Black alone 227,916 4.3% Hispanic 209,738 4.0% Asian alone 82,946 1.6% Two or more races 13,312 0.3% American Indian alone 9,379 0.2% Other race alone 1,913 0.04% Native Hawaiian and Other
2,906,492 47.1% White alone 1,800,914 29.2% Black alone 705,842 11.4% Hispanic 401,818 6.5% Asian alone 291,317 4.7% Two or more races 46,930 0.8% Other race alone 8,930 0.1% American Indian alone 2,417 0.04% Native Hawaiian and Other
Income and house value in College Park Median household income in 2022 $78,683 White non-Hispanic householders$56,751 Black householders$45,085 Asian householders$102,435 Some other race householders$60,274 Two or more races householders$88,111 Hispanic or Latino race householdersMedian 2022 house value $429,537 White Non-Hispanic householders$474,184 Black or African American householders$435,387 American Indian or Alaska Native householders $435,079 Asian householders$445,240 Some other race householders$482,190 Two or more races householders$419,068 Hispanic or Latino householders
Median age by race in College Park
21.2 Median age for White residents21.9 20.9 22.5 Median age for Black or African American residents23.7 21.8 -780,410,741.7 Median age for American Indian / Alaska Native residents-888,297,871.5 -689,905,591.2 25.7 Median age for Asian residents23.3 27.2 -571,600,480.8 Median age for Native Hawaiian / Pacific Islander residents-720,061,021.4 -760,942,760.2 34.3 Median age for Other race residents35.5 22.4 21.0 Median age for Two or more races residents20.8 21.4 20.8 Median age for White alone residents20.9 20.3 29.9 Median age for Hispanic or Latino residents35.0 21.1
Owner/renter occupied households by race in College Park
House owners and renters - White residents 1,804 45.0% Owner occupied2,202 55.0% Renter occupiedHouse owners and renters - Black or African American residents 517 27.1% Owner occupied1,392 72.9% Renter occupiedHouse owners and renters - American Indian / Alaska Native residents 62 100.0% Renter occupiedHouse owners and renters - Asian residents 630 46.3% Owner occupied731 53.7% Renter occupiedHouse owners and renters - Native Hawaiian / Pacific Islander residents 8 100.0% Owner occupiedHouse owners and renters - Other race residents 349 34.3% Owner occupied668 65.7% Renter occupiedHouse owners and renters - Two or more races residents 227 46.1% Owner occupied266 53.9% Renter occupiedHouse owners and renters - White alone residents 1,760 45.2% Owner occupied2,129 54.8% Renter occupiedHouse owners and renters - Hispanic or Latino residents 539 38.6% Owner occupied860 61.4% Renter occupied
Language usage in College Park
English speakers - Total 68.6% of residents of College Park speak English at home.
13.5% of residents speak Spanish at home 1,880 42.6% Speak English very well2,538 57.4% Speak English less than very well18.4% of residents speak other language at home 4,391 72.8% Speak English very well1,637 27.2% Speak English less than very well
English speakers - Born in the United States 90.2% of residents of College Park speak English at home.
3.0% of residents speak Spanish at home 331 86.2% Speak English very well53 13.8% Speak English less than very well7.9% of residents speak other language at home 935 93.2% Speak English very well68 6.8% Speak English less than very well
English speakers - Native, born elsewhere 78.6% of residents of College Park speak English at home.
7.0% of residents speak Spanish at home 54 100.0% Speak English very well9.9% of residents speak other language at home 34 44.7% Speak English very well42 55.3% Speak English less than very well
English speakers - Foreign-born 14.4% of residents of College Park speak English at home.
36.8% of residents speak Spanish at home 768 24.7% Speak English very well2,346 75.3% Speak English less than very well48.6% of residents speak other language at home 2,639 64.2% Speak English very well1,472 35.8% Speak English less than very well
White (Caucasian) - Speak only English Native:
96.0% (12,166)Foreign-born:
36.5% (295)
White (Caucasian) - Speak another language Native:
4.5% (570)Foreign-born:
68.1% (551)
Black or African American - Speak only English Native:
96.9% (6,213)Foreign-born:
60.2% (609)
Black or African American - Speak another language Native:
2.9% (188)Foreign-born:
36.9% (374)
Asian - Speak only English Native:
36.1% (766)Foreign-born:
9.4% (250)
Asian - Speak another language Native:
66.0% (1,400)Foreign-born:
89.6% (2,371)
Other race - Speak another language Native:
75.8% (666)Foreign-born:
100.0% (2,545)
Two or more races - Speak only English Native:
84.6% (1,884)Foreign-born:
5.2% (38)
Two or more races - Speak another language Native:
14.7% (328)Foreign-born:
98.7% (718)
White alone - Speak only English Native:
96.5% (11,842)Foreign-born:
33.4% (305)
White alone - Speak another language Native:
3.0% (369)Foreign-born:
66.7% (610)
Hispanic or Latino - Speak only English Native:
44.6% (922)Foreign-born:
1.2% (37)
Hispanic or Latino - Speak another language Native:
57.2% (1,181)Foreign-born:
99.4% (3,152)
Foreign-born residents in College Park 8,470 residents are foreign born (10.7% Latin America , 8.9% Asia ).
This city:
24.9%Maryland:
15.7%
Marital status for residents in College Park Marital status - White (Caucasian) population 15 years and over
Males 77.1% Never married18.9% Now married0.3% Separated1.0% Widowed2.7% DivorcedFemales 74.6% Never married18.1% Now married0.0% Separated3.0% Widowed4.3% DivorcedWomen who gave birth in the past 12 months Now married:
100.0% (35)Unmarried:
0.0% (0)
Women who did not give birth in the past 12 months Now married:
10.3% (515)Unmarried:
89.7% (4,463)
Marital status - Black or African American population 15 years and over
Males 76.5% Never married12.0% Now married1.4% Separated0.5% Widowed9.5% DivorcedFemales 80.1% Never married7.4% Now married2.6% Separated5.0% Widowed4.8% DivorcedWomen who gave birth in the past 12 months Now married:
33.3% (19)Unmarried:
66.7% (38)
Women who did not give birth in the past 12 months Now married:
4.2% (130)Unmarried:
95.8% (2,935)
Marital status - American Indian / Alaska Native population 15 years and over
Males 100.0% Never married0.0% Now married0.0% Separated0.0% Widowed0.0% DivorcedFemales 0.0% Never married0.0% Now married0.0% Separated0.0% Widowed100.0% DivorcedMarital status - Asian population 15 years and over
Males 75.6% Never married21.9% Now married1.1% Separated0.5% Widowed1.0% DivorcedFemales 69.9% Never married26.2% Now married0.0% Separated1.9% Widowed2.0% DivorcedWomen who did not give birth in the past 12 months Now married:
15.6% (292)Unmarried:
84.4% (1,579)
Marital status - Other race population 15 years and over
Males 63.9% Never married21.3% Now married5.2% Separated3.1% Widowed6.5% DivorcedFemales 53.9% Never married32.8% Now married4.8% Separated3.4% Widowed5.2% DivorcedWomen who gave birth in the past 12 months Now married:
100.0% (28)Unmarried:
0.0% (0)
Women who did not give birth in the past 12 months Now married:
30.1% (295)Unmarried:
69.9% (685)
Marital status - Two or more races population 15 years and over
Males 79.5% Never married20.5% Now married0.0% Separated0.0% Widowed0.0% DivorcedFemales 73.6% Never married18.5% Now married0.0% Separated2.4% Widowed5.4% DivorcedWomen who gave birth in the past 12 months Now married:
100.0% (56)Unmarried:
0.0% (0)
Women who did not give birth in the past 12 months Now married:
11.4% (112)Unmarried:
88.6% (869)
Marital status - White alone, not Hispanic / Latino population 15 years and over
Males 77.6% Never married18.3% Now married0.1% Separated1.1% Widowed2.8% DivorcedFemales 74.9% Never married17.7% Now married0.0% Separated3.2% Widowed4.3% DivorcedWomen who gave birth in the past 12 months Now married:
100.0% (39)Unmarried:
0.0% (0)
Women who did not give birth in the past 12 months Now married:
10.1% (527)Unmarried:
89.9% (4,679)
Marital status - Hispanic or Latino population 15 years and over
Males 67.1% Never married22.3% Now married4.0% Separated2.1% Widowed4.5% DivorcedFemales 61.0% Never married27.7% Now married3.0% Separated2.3% Widowed6.1% DivorcedWomen who gave birth in the past 12 months Now married:
100.0% (8)Unmarried:
0.0% (0)
Women who did not give birth in the past 12 months Now married:
22.5% (339)Unmarried:
77.5% (1,165)
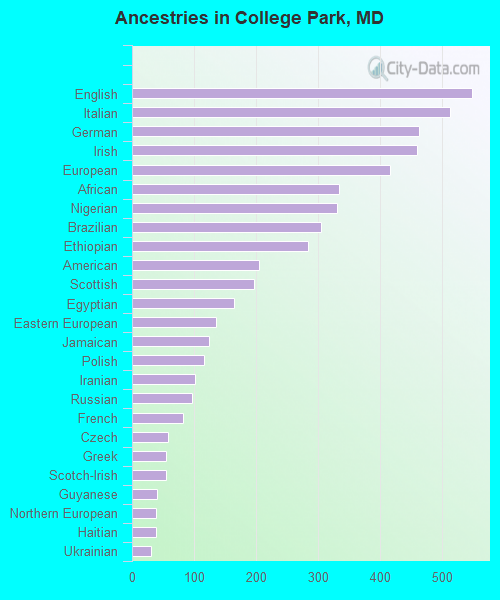
Ancestries in College Park
548 3.5% English513 3.2% Italian462 2.9% German459 2.9% Irish416 2.6% European334 2.1% African331 2.1% Nigerian304 1.9% Brazilian283 1.8% Ethiopian205 1.3% American196 1.2% Scottish164 1.0% Egyptian135 0.9% Eastern European124 0.8% Jamaican116 0.7% Polish102 0.6% Iranian97 0.6% Russian82 0.5% French58 0.4% Czech55 0.3% Greek54 0.3% Scotch-Irish41 0.3% Guyanese39 0.2% Northern European39 0.2% Haitian30 0.2% Ukrainian28 0.2% Liberian25 0.2% Portuguese24 0.2% Romanian22 0.1% Ghanaian20 0.1% British15 0.09% Kenyan13 0.08% Bermudan12 0.08% Dutch9 0.06% Sierra Leonean8 0.05% British West Indian7 0.04% Lebanese6 0.04% Arab6 0.04% Slovene6 0.04% Turkish6 0.04% Israeli5 0.03% Welsh4 0.03% Pennsylvania German3 0.02% Sudanese3 0.02% French Canadian1 0.01% Moroccan1 0.01% Danish1 0.01% Latvian
Geographical mobility in College Park Same house 1 year ago 7,845 57.5% White (Caucasian)4,652 61.8% Black or African American2,889 60.8% Asian9 100.0% Native Hawaiian / Pacific Islander3,251 85.8% Other race1,977 62.3% Two or more races7,890 58.2% White alone, not Hispanic / Latino4,448 75.8% Hispanic or LatinoMoved within same county 2,195 16.1% White / Caucasian871 11.6% Black or African American451 9.5% Asian117 3.1% Other race379 11.9% Two or more races2,173 16.0% White alone, not Hispanic / Latino352 6.0% Hispanic or LatinoMoved within same state 2,139 15.7% White / Caucasian987 13.1% Black or African American724 15.2% Asian394 10.4% Other race744 23.4% Two or more races2,080 15.3% White alone, not Hispanic / Latino867 14.8% Hispanic or LatinoMoved from different state 901 6.6% White / Caucasian539 7.2% Black or African American255 5.4% Asian36 1.0% Other race343 10.8% Two or more races922 6.8% White alone, not Hispanic / Latino179 3.1% Hispanic or LatinoMoved from abroad 127 0.9% White27 0.4% Black or African American122 100.0% American Indian / Alaska Native308 6.5% Asian102 2.7% Other race114 0.8% White alone, not Hispanic / Latino139 2.4% Hispanic or Latino
Children Nativity (place of birth) in College Park
Children under 6 years - Living with two parents Both parents native 440 100.0% NativeBoth parents foreign-born 426 84.4% Native79 15.6% Foreign-bornOne native, one foreign-born parent 83 100.0% NativeChildren under 6 years - Living with one parent Native parent 183 99.9% Native0 0.1% Foreign-bornForeign-born parent 77 53.5% Native67 46.5% Foreign-bornChildren 6 to 17 years - Living with two parents Both parents native 391 99.9% Native0 0.1% Foreign-bornBoth parents foreign-born 470 81.6% Native106 18.4% Foreign-bornOne native, one foreign-born parent 118 100.0% NativeChildren 6 to 17 years - Living with one parent Native parent 155 100.0% NativeForeign-born parent 185 58.1% Native133 41.9% Foreign-born
Grandparents responsible for own grandchildren in College Park
Grandparents (30 to 59 years) Black or African American 1 100.0% Not responsible for grandchildrenAsian 20 100.0% Responsible for grandchildrenOther race 28 100.0% Not responsible for grandchildrenHispanic or Latino 31 100.0% Not responsible for grandchildrenGrandparents (60 years and over) Black or African American 90 71.9% Responsible for grandchildren35 28.1% Not responsible for grandchildrenOther race 7 100.0% Not responsible for grandchildrenHispanic or Latino 7 25.8% Responsible for grandchildren21 74.2% Not responsible for grandchildren