Races in Cockeysville, Maryland (MD) Detailed Stats
Data:
Races - White alone (%)
Races - White alone (% change since 2000)
Races - Black alone (%)
Races - Black alone (% change since 2000)
Races - American Indian alone (%)
Races - American Indian alone (% change since 2000)
Races - Asian alone (%)
Races - Asian alone (% change since 2000)
Races - Hispanic (%)
Races - Hispanic (% change since 2000)
Races - Native Hawaiian and Other Pacific Islander alone (%)
Races - Native Hawaiian and Other Pacific Islander alone (% change since 2000)
Races - Two or more races(%)
Races - Two or more races(% change since 2000)
Races - Other race alone (%)
Races - Other race alone (% change since 2000)
Racial diversity
Place of birth - Born in state of residence (%)
Place of birth - Born in state of residence (%) - White
Place of birth - Born in state of residence (%) - Black or African American
Place of birth - Born in state of residence (%) - Asian
Place of birth - Born in state of residence (%) - Hispanic or Latino
Place of birth - Born in state of residence (%) - American Indian and Alaska Native
Place of birth - Born in state of residence (%) - Multirace
Place of birth - Born in state of residence (%) - Other Race
Place of birth - Born in other state (%)
Place of birth - Born in other state (%) - White
Place of birth - Born in other state (%) - Black or African American
Place of birth - Born in other state (%) - Asian
Place of birth - Born in other state (%) - Hispanic or Latino
Place of birth - Born in other state (%) - American Indian and Alaska Native
Place of birth - Born in other state (%) - Multirace
Place of birth - Born in other state (%) - Other Race
Place of birth - Native, outside of US (%)
Place of birth - Native, outside of US (%) - White
Place of birth - Native, outside of US (%) - Black or African American
Place of birth - Native, outside of US (%) - Asian
Place of birth - Native, outside of US (%) - Hispanic or Latino
Place of birth - Native, outside of US (%) - American Indian and Alaska Native
Place of birth - Native, outside of US (%) - Multirace
Place of birth - Native, outside of US (%) - Other Race
Place of birth - Foreign born (%)
Place of birth - Foreign born (%) - White
Place of birth - Foreign born (%) - Black or African American
Place of birth - Foreign born (%) - Asian
Place of birth - Foreign born (%) - Hispanic or Latino
Place of birth - Foreign born (%) - American Indian and Alaska Native
Place of birth - Foreign born (%) - Multirace
Place of birth - Foreign born (%) - Other Race
Residents speaking English at home (%)
Residents speaking English at home - Born in the United States (%)
Residents speaking English at home - Native, born elsewhere (%)
Residents speaking English at home - Foreign born (%)
Residents speaking Spanish at home (%)
Residents speaking Spanish at home - Born in the United States (%)
Residents speaking Spanish at home - Native, born elsewhere (%)
Residents speaking Spanish at home - Foreign born (%)
Residents speaking other language at home (%)
Residents speaking other language at home - Born in the United States (%)
Residents speaking other language at home - Native, born elsewhere (%)
Residents speaking other language at home - Foreign born (%)
Marital status - Never married (%)
Marital status - Now married (%)
Marital status - Separated (%)
Marital status - Widowed (%)
Marital status - Divorced (%)
Ancestries Reported - Arab (%)
Ancestries Reported - Czech (%)
Ancestries Reported - Danish (%)
Ancestries Reported - Dutch (%)
Ancestries Reported - English (%)
Ancestries Reported - French (%)
Ancestries Reported - French Canadian (%)
Ancestries Reported - German (%)
Ancestries Reported - Greek (%)
Ancestries Reported - Hungarian (%)
Ancestries Reported - Irish (%)
Ancestries Reported - Italian (%)
Ancestries Reported - Lithuanian (%)
Ancestries Reported - Norwegian (%)
Ancestries Reported - Polish (%)
Ancestries Reported - Portuguese (%)
Ancestries Reported - Russian (%)
Ancestries Reported - Scotch-Irish (%)
Ancestries Reported - Scottish (%)
Ancestries Reported - Slovak (%)
Ancestries Reported - Subsaharan African (%)
Ancestries Reported - Swedish (%)
Ancestries Reported - Swiss (%)
Ancestries Reported - Ukrainian (%)
Ancestries Reported - United States (%)
Ancestries Reported - Welsh (%)
Ancestries Reported - West Indian (%)
Ancestries Reported - Other (%)
Geographical mobility - Same house 1 year ago (%)
Geographical mobility - Same house 1 year ago (%) - White
Geographical mobility - Same house 1 year ago (%) - Black or African American
Geographical mobility - Same house 1 year ago (%) - Asian
Geographical mobility - Same house 1 year ago (%) - Hispanic or Latino
Geographical mobility - Same house 1 year ago (%) - American Indian and Alaska Native
Geographical mobility - Same house 1 year ago (%) - Multirace
Geographical mobility - Same house 1 year ago (%) - Other Race
Geographical mobility - Moved within same county (%)
Geographical mobility - Moved within same county (%) - White
Geographical mobility - Moved within same county (%) - Black or African American
Geographical mobility - Moved within same county (%) - Asian
Geographical mobility - Moved within same county (%) - Hispanic or Latino
Geographical mobility - Moved within same county (%) - American Indian and Alaska Native
Geographical mobility - Moved within same county (%) - Multirace
Geographical mobility - Moved within same county (%) - Other Race
Geographical mobility - Moved from different county within same state (%)
Geographical mobility - Moved from different county within same state (%) - White
Geographical mobility - Moved from different county within same state (%) - Black or African American
Geographical mobility - Moved from different county within same state (%) - Asian
Geographical mobility - Moved from different county within same state (%) - Hispanic or Latino
Geographical mobility - Moved from different county within same state (%) - American Indian and Alaska Native
Geographical mobility - Moved from different county within same state (%) - Multirace
Geographical mobility - Moved from different county within same state (%) - Other Race
Geographical mobility - Moved from different state (%)
Geographical mobility - Moved from different state (%) - White
Geographical mobility - Moved from different state (%) - Black or African American
Geographical mobility - Moved from different state (%) - Asian
Geographical mobility - Moved from different state (%) - Hispanic or Latino
Geographical mobility - Moved from different state (%) - American Indian and Alaska Native
Geographical mobility - Moved from different state (%) - Multirace
Geographical mobility - Moved from different state (%) - Other Race
Geographical mobility - Moved from abroad (%)
Geographical mobility - Moved from abroad (%) - White
Geographical mobility - Moved from abroad (%) - Black or African American
Geographical mobility - Moved from abroad (%) - Asian
Geographical mobility - Moved from abroad (%) - Hispanic or Latino
Geographical mobility - Moved from abroad (%) - American Indian and Alaska Native
Geographical mobility - Moved from abroad (%) - Multirace
Geographical mobility - Moved from abroad (%) - Other Race
Place of birth for the foreign-born population - Ireland (%)
Place of birth for the foreign-born population - Denmark (%)
Place of birth for the foreign-born population - Norway (%)
Place of birth for the foreign-born population - Sweden (%)
Place of birth for the foreign-born population - United Kingdom (%)
Place of birth for the foreign-born population - England (%)
Place of birth for the foreign-born population - Scotland (%)
Place of birth for the foreign-born population - Other Northern Europe (%)
Place of birth for the foreign-born population - Austria (%)
Place of birth for the foreign-born population - Belgium (%)
Place of birth for the foreign-born population - France (%)
Place of birth for the foreign-born population - Germany (%)
Place of birth for the foreign-born population - Netherlands (%)
Place of birth for the foreign-born population - Switzerland (%)
Place of birth for the foreign-born population - Other Western Europe (%)
Place of birth for the foreign-born population - Greece (%)
Place of birth for the foreign-born population - Italy (%)
Place of birth for the foreign-born population - Portugal (%)
Place of birth for the foreign-born population - Spain (%)
Place of birth for the foreign-born population - Other Southern Europe (%)
Place of birth for the foreign-born population - Albania (%)
Place of birth for the foreign-born population - Belarus (%)
Place of birth for the foreign-born population - Bosnia and Herzegovina (%)
Place of birth for the foreign-born population - Bulgaria (%)
Place of birth for the foreign-born population - Croatia (%)
Place of birth for the foreign-born population - Czechoslovakia (%)
Place of birth for the foreign-born population - Hungary (%)
Place of birth for the foreign-born population - Latvia (%)
Place of birth for the foreign-born population - Lithuania (%)
Place of birth for the foreign-born population - North Macedonia (Macedonia) (%)
Place of birth for the foreign-born population - Moldova (%)
Place of birth for the foreign-born population - Poland (%)
Place of birth for the foreign-born population - Romania (%)
Place of birth for the foreign-born population - Russia (%)
Place of birth for the foreign-born population - Serbia (%)
Place of birth for the foreign-born population - Ukraine (%)
Place of birth for the foreign-born population - Other Eastern Europe (%)
Place of birth for the foreign-born population - China (%)
Place of birth for the foreign-born population - Hong Kong (%)
Place of birth for the foreign-born population - Taiwan (%)
Place of birth for the foreign-born population - Japan (%)
Place of birth for the foreign-born population - Korea (%)
Place of birth for the foreign-born population - Other Eastern Asia (%)
Place of birth for the foreign-born population - Afghanistan (%)
Place of birth for the foreign-born population - Bangladesh (%)
Place of birth for the foreign-born population - India (%)
Place of birth for the foreign-born population - Iran (%)
Place of birth for the foreign-born population - Kazakhstan (%)
Place of birth for the foreign-born population - Nepal (%)
Place of birth for the foreign-born population - Pakistan (%)
Place of birth for the foreign-born population - Sri Lanka (%)
Place of birth for the foreign-born population - Uzbekistan (%)
Place of birth for the foreign-born population - Other South Central Asia (%)
Place of birth for the foreign-born population - Burma (%)
Place of birth for the foreign-born population - Cambodia (%)
Place of birth for the foreign-born population - Indonesia (%)
Place of birth for the foreign-born population - Laos (%)
Place of birth for the foreign-born population - Malaysia (%)
Place of birth for the foreign-born population - Philippines (%)
Place of birth for the foreign-born population - Singapore (%)
Place of birth for the foreign-born population - Thailand (%)
Place of birth for the foreign-born population - Vietnam (%)
Place of birth for the foreign-born population - Other South Eastern Asia (%)
Place of birth for the foreign-born population - Armenia (%)
Place of birth for the foreign-born population - Iraq (%)
Place of birth for the foreign-born population - Israel (%)
Place of birth for the foreign-born population - Jordan (%)
Place of birth for the foreign-born population - Kuwait (%)
Place of birth for the foreign-born population - Lebanon (%)
Place of birth for the foreign-born population - Saudi Arabia (%)
Place of birth for the foreign-born population - Syria (%)
Place of birth for the foreign-born population - Turkey (%)
Place of birth for the foreign-born population - Yemen (%)
Place of birth for the foreign-born population - Other Western Asia (%)
Place of birth for the foreign-born population - Eritrea (%)
Place of birth for the foreign-born population - Ethiopia (%)
Place of birth for the foreign-born population - Kenya (%)
Place of birth for the foreign-born population - Somalia (%)
Place of birth for the foreign-born population - Uganda (%)
Place of birth for the foreign-born population - Zimbabwe (%)
Place of birth for the foreign-born population - Other Eastern Africa (%)
Place of birth for the foreign-born population - Cameroon (%)
Place of birth for the foreign-born population - Congo (%)
Place of birth for the foreign-born population - Democratic Republic of Congo (Zaire) (%)
Place of birth for the foreign-born population - Other Middle Africa (%)
Place of birth for the foreign-born population - Egypt (%)
Place of birth for the foreign-born population - Morocco (%)
Place of birth for the foreign-born population - Sudan (%)
Place of birth for the foreign-born population - Other Northern Africa (%)
Place of birth for the foreign-born population - South Africa (%)
Place of birth for the foreign-born population - Other Southern Africa (%)
Place of birth for the foreign-born population - Cabo Verde (%)
Place of birth for the foreign-born population - Ghana (%)
Place of birth for the foreign-born population - Liberia (%)
Place of birth for the foreign-born population - Nigeria (%)
Place of birth for the foreign-born population - Senegal (%)
Place of birth for the foreign-born population - Sierra Leone (%)
Place of birth for the foreign-born population - Other Western Africa (%)
Place of birth for the foreign-born population - Australia (%)
Place of birth for the foreign-born population - New Zealand (%)
Place of birth for the foreign-born population - Fiji (%)
Place of birth for the foreign-born population - Micronesia (%)
Place of birth for the foreign-born population - Bahamas (%)
Place of birth for the foreign-born population - Barbados (%)
Place of birth for the foreign-born population - Cuba (%)
Place of birth for the foreign-born population - Dominica (%)
Place of birth for the foreign-born population - Dominican Republic (%)
Place of birth for the foreign-born population - Grenada (%)
Place of birth for the foreign-born population - Haiti (%)
Place of birth for the foreign-born population - Jamaica (%)
Place of birth for the foreign-born population - St. Vincent and the Grenadines (%)
Place of birth for the foreign-born population - Trinidad and Tobago (%)
Place of birth for the foreign-born population - West Indies (%)
Place of birth for the foreign-born population - Other Caribbean (%)
Place of birth for the foreign-born population - Belize (%)
Place of birth for the foreign-born population - Costa Rica (%)
Place of birth for the foreign-born population - El Salvador (%)
Place of birth for the foreign-born population - Guatemala (%)
Place of birth for the foreign-born population - Honduras (%)
Place of birth for the foreign-born population - Mexico (%)
Place of birth for the foreign-born population - Nicaragua (%)
Place of birth for the foreign-born population - Panama (%)
Place of birth for the foreign-born population - Other Central America (%)
Place of birth for the foreign-born population - Argentina (%)
Place of birth for the foreign-born population - Bolivia (%)
Place of birth for the foreign-born population - Brazil (%)
Place of birth for the foreign-born population - Chile (%)
Place of birth for the foreign-born population - Colombia (%)
Place of birth for the foreign-born population - Ecuador (%)
Place of birth for the foreign-born population - Guyana (%)
Place of birth for the foreign-born population - Peru (%)
Place of birth for the foreign-born population - Uruguay (%)
Place of birth for the foreign-born population - Venezuela (%)
Place of birth for the foreign-born population - Other South America (%)
Place of birth for the foreign-born population - Canada (%)
Place of birth for the foreign-born population - Other Northern America (%)
Place of birth for the foreign-born population - Other (%)
Latest news about races in Cockeysville, MD collected exclusively by city-data.com from local newspapers, TV, and radio stations
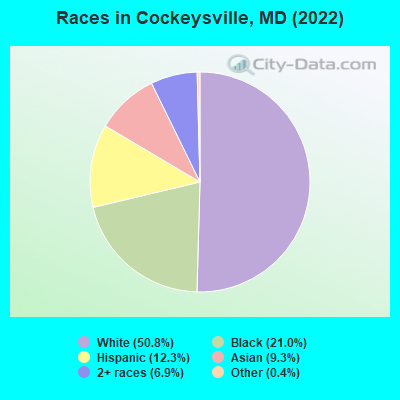
According to 2022 data, the most numerous races in Cockeysville, MD are White alone (11,738 residents), Black alone (4,853 residents), and Hispanic (2,833 residents). 79.9% of Cockeysville residents speak English at home. 18.5% of Cockeysville, MD residents are foreign-born (10.0% born in Asia, 4.7% born in Latin America), which is 13.7% greater than the foreign-born rate of 16.0% across the entire state of Maryland.
Race distribution in Cockeysville
2000 2022
3,286,547 62.1% White alone 1,464,735 27.7% Black alone 227,916 4.3% Hispanic 209,738 4.0% Asian alone 82,946 1.6% Two or more races 13,312 0.3% American Indian alone 9,379 0.2% Other race alone 1,913 0.04% Native Hawaiian and Other
2,906,492 47.1% White alone 1,800,914 29.2% Black alone 705,842 11.4% Hispanic 401,818 6.5% Asian alone 291,317 4.7% Two or more races 46,930 0.8% Other race alone 8,930 0.1% American Indian alone 2,417 0.04% Native Hawaiian and Other
Income and house value in Cockeysville Median household income in 2022 $92,913 White non-Hispanic householders$54,099 Black householders$89,271 Asian householders$46,808 Some other race householders$131,955 Two or more races householders$72,641 Hispanic or Latino race householdersMedian 2022 house value $413,633 White Non-Hispanic householders$418,109 Black or African American householders$41,222 American Indian or Alaska Native householders $448,024 Asian householders$332,838 Two or more races householders$372,882 Hispanic or Latino householders
Median age by race in Cockeysville
42.7 Median age for White residents41.3 44.1 30.4 Median age for Black or African American residents29.3 30.4 -768,041,236.3 Median age for American Indian / Alaska Native residents-867,632,849.4 -677,419,354.2 36.5 Median age for Asian residents34.5 44.8 -1,541,125,539.6 Median age for Native Hawaiian / Pacific Islander residents-790,901,136.6 -760,942,760.2 29.6 Median age for Other race residents41.8 30.0 30.9 Median age for Two or more races residents35.6 26.2 43.7 Median age for White alone residents42.0 45.9 28.6 Median age for Hispanic or Latino residents32.4 23.2
Owner/renter occupied households by race in Cockeysville
House owners and renters - White residents 3,051 49.2% Owner occupied3,152 50.8% Renter occupiedHouse owners and renters - Black or African American residents 103 5.4% Owner occupied1,808 94.6% Renter occupiedHouse owners and renters - American Indian / Alaska Native residents 9 32.6% Owner occupied19 67.4% Renter occupiedHouse owners and renters - Asian residents 299 33.2% Owner occupied603 66.8% Renter occupiedHouse owners and renters - Other race residents 152 43.9% Owner occupied194 56.1% Renter occupiedHouse owners and renters - Two or more races residents 87 7.7% Owner occupied1,041 92.3% Renter occupiedHouse owners and renters - White alone residents 3,026 50.7% Owner occupied2,939 49.3% Renter occupiedHouse owners and renters - Hispanic or Latino residents 165 16.9% Owner occupied808 83.1% Renter occupied
Language usage in Cockeysville
English speakers - Total 79.9% of residents of Cockeysville speak English at home.
6.8% of residents speak Spanish at home 770 51.5% Speak English very well725 48.5% Speak English less than very well13.1% of residents speak other language at home 1,683 58.8% Speak English very well1,177 41.2% Speak English less than very well
English speakers - Born in the United States 94.9% of residents of Cockeysville speak English at home.
3.2% of residents speak Spanish at home 151 79.9% Speak English very well38 20.1% Speak English less than very well2.4% of residents speak other language at home 102 72.9% Speak English very well38 27.1% Speak English less than very well
English speakers - Native, born elsewhere 79.9% of residents of Cockeysville speak English at home.
22.2% of residents speak Spanish at home 50 53.2% Speak English very well44 46.8% Speak English less than very well3.5% of residents speak other language at home 15 100.0% Speak English very well
English speakers - Foreign-born 18.4% of residents of Cockeysville speak English at home.
22.5% of residents speak Spanish at home 350 36.6% Speak English very well606 63.4% Speak English less than very well58.1% of residents speak other language at home 1,391 56.2% Speak English very well1,083 43.8% Speak English less than very well
White (Caucasian) - Speak only English Native:
98.1% (11,155)Foreign-born:
21.3% (127)
White (Caucasian) - Speak another language Native:
2.1% (238)Foreign-born:
78.1% (465)
Black or African American - Speak only English Native:
98.7% (4,040)Foreign-born:
81.3% (358)
Black or African American - Speak another language Native:
1.6% (65)Foreign-born:
30.1% (133)
Asian - Speak only English Native:
34.7% (92)Foreign-born:
12.3% (230)
Asian - Speak another language Native:
65.2% (174)Foreign-born:
87.6% (1,639)
Other race - Speak only English Native:
13.4% (40)Foreign-born:
5.3% (36)
Other race - Speak another language Native:
85.6% (257)Foreign-born:
96.3% (647)
Two or more races - Speak only English Native:
80.2% (1,462)Foreign-born:
1.1% (9)
Two or more races - Speak another language Native:
15.0% (272)Foreign-born:
81.2% (665)
White alone - Speak only English Native:
98.0% (10,757)Foreign-born:
16.9% (75)
White alone - Speak another language Native:
2.0% (218)Foreign-born:
83.8% (370)
Hispanic or Latino - Speak only English Native:
64.2% (865)Foreign-born:
8.3% (90)
Hispanic or Latino - Speak another language Native:
37.5% (505)Foreign-born:
91.7% (996)
Foreign-born residents in Cockeysville 4,285 residents are foreign born (10.0% Asia , 4.7% Latin America ).
This city:
18.5%Maryland:
15.7%
Marital status for residents in Cockeysville Marital status - White (Caucasian) population 15 years and over
Males 39.3% Never married47.2% Now married1.9% Separated1.7% Widowed9.9% DivorcedFemales 32.9% Never married44.8% Now married0.5% Separated10.6% Widowed11.2% DivorcedWomen who gave birth in the past 12 months Now married:
33.3% (55)Unmarried:
66.7% (110)
Women who did not give birth in the past 12 months Now married:
39.4% (1,078)Unmarried:
60.6% (1,656)
Marital status - Black or African American population 15 years and over
Males 59.6% Never married23.0% Now married9.7% Separated0.8% Widowed6.9% DivorcedFemales 60.3% Never married16.8% Now married10.2% Separated1.8% Widowed10.8% DivorcedWomen who gave birth in the past 12 months Now married:
27.3% (15)Unmarried:
72.7% (40)
Women who did not give birth in the past 12 months Now married:
22.2% (407)Unmarried:
77.8% (1,429)
Marital status - American Indian / Alaska Native population 15 years and over
Males 0.0% Never married100.0% Now married0.0% Separated0.0% Widowed0.0% DivorcedFemales 100.0% Never married0.0% Now married0.0% Separated0.0% Widowed0.0% DivorcedWomen who did not give birth in the past 12 months Now married:
0.0% (0)Unmarried:
100.0% (21)
Marital status - Asian population 15 years and over
Males 39.1% Never married56.1% Now married0.0% Separated1.8% Widowed3.0% DivorcedFemales 25.8% Never married62.8% Now married0.0% Separated1.2% Widowed10.2% DivorcedWomen who did not give birth in the past 12 months Now married:
58.9% (261)Unmarried:
41.1% (182)
Marital status - Other race population 15 years and over
Males 5.8% Never married87.2% Now married2.1% Separated0.0% Widowed4.9% DivorcedFemales 11.0% Never married89.0% Now married0.0% Separated0.0% Widowed0.0% DivorcedWomen who gave birth in the past 12 months Now married:
100.0% (32)Unmarried:
0.0% (0)
Women who did not give birth in the past 12 months Now married:
85.3% (170)Unmarried:
14.7% (29)
Marital status - Two or more races population 15 years and over
Males 54.8% Never married24.4% Now married17.5% Separated0.6% Widowed2.6% DivorcedFemales 58.3% Never married25.2% Now married0.0% Separated0.0% Widowed16.5% DivorcedWomen who gave birth in the past 12 months Now married:
16.1% (13)Unmarried:
83.9% (66)
Women who did not give birth in the past 12 months Now married:
25.8% (158)Unmarried:
74.2% (453)
Marital status - White alone, not Hispanic / Latino population 15 years and over
Males 39.3% Never married46.4% Now married2.0% Separated1.8% Widowed10.5% DivorcedFemales 31.2% Never married46.3% Now married0.5% Separated10.2% Widowed11.8% DivorcedWomen who gave birth in the past 12 months Now married:
33.3% (56)Unmarried:
66.7% (111)
Women who did not give birth in the past 12 months Now married:
41.0% (1,018)Unmarried:
59.0% (1,466)
Marital status - Hispanic or Latino population 15 years and over
Males 40.6% Never married48.5% Now married9.4% Separated0.0% Widowed1.5% DivorcedFemales 53.8% Never married33.2% Now married0.0% Separated7.2% Widowed5.8% DivorcedWomen who gave birth in the past 12 months Now married:
29.7% (24)Unmarried:
70.3% (56)
Women who did not give birth in the past 12 months Now married:
36.4% (232)Unmarried:
63.6% (404)
Ancestries in Cockeysville
1,011 7.8% German833 6.4% Irish528 4.1% American514 4.0% Italian397 3.1% English390 3.0% African361 2.8% European321 2.5% Afghan205 1.6% Polish122 0.9% Greek120 0.9% Scottish119 0.9% Egyptian114 0.9% Russian90 0.7% Jamaican89 0.7% Iranian80 0.6% Nigerian63 0.5% Moroccan58 0.4% Haitian52 0.4% Ukrainian39 0.3% Finnish37 0.3% Eastern European35 0.3% Barbadian33 0.3% Scotch-Irish32 0.2% British28 0.2% French26 0.2% Northern European25 0.2% Swiss19 0.1% Slovak17 0.1% Welsh15 0.1% Hungarian13 0.1% Trinidadian and Tobagonian12 0.09% Romanian10 0.08% French Canadian10 0.08% Czech8 0.06% Dutch7 0.05% Syrian7 0.05% Slavic7 0.05% Arab6 0.05% Norwegian5 0.04% Swedish2 0.02% Czechoslovakian1 0.01% Portuguese
Geographical mobility in Cockeysville Same house 1 year ago 10,282 84.4% White (Caucasian)4,540 91.8% Black or African American7 26.0% American Indian / Alaska Native1,681 78.2% Asian823 92.2% Other race2,243 77.3% Two or more races9,849 84.5% White alone, not Hispanic / Latino2,457 93.3% Hispanic or LatinoMoved within same county 855 7.0% White / Caucasian261 5.3% Black or African American20 73.1% American Indian / Alaska Native86 4.0% Asian41 4.6% Other race221 7.6% Two or more races900 7.7% White alone, not Hispanic / Latino124 4.7% Hispanic or LatinoMoved within same state 522 4.3% White / Caucasian148 3.0% Black or African American29 1.3% Asian102 3.5% Two or more races497 4.3% White alone, not Hispanic / Latino23 0.9% Hispanic or LatinoMoved from different state 500 4.1% White / Caucasian17 0.3% Black or African American158 7.4% Asian257 8.9% Two or more races373 3.2% White alone, not Hispanic / Latino237 9.0% Hispanic or LatinoMoved from abroad 12 0.1% White301 14.0% Asian33 3.7% Other race12 0.1% White alone, not Hispanic / Latino
Children Nativity (place of birth) in Cockeysville
Children under 6 years - Living with two parents Both parents native 551 100.0% NativeBoth parents foreign-born 283 100.0% NativeOne native, one foreign-born parent 32 100.0% NativeChildren under 6 years - Living with one parent Native parent 298 100.0% NativeForeign-born parent 131 100.0% NativeChildren 6 to 17 years - Living with two parents Both parents native 623 97.2% Native18 2.8% Foreign-bornBoth parents foreign-born 409 64.2% Native228 35.8% Foreign-bornOne native, one foreign-born parent 188 100.0% NativeChildren 6 to 17 years - Living with one parent Native parent 719 100.0% NativeForeign-born parent 270 56.7% Native207 43.3% Foreign-born
Grandparents responsible for own grandchildren in Cockeysville
Grandparents (30 to 59 years) White / Caucasian 14 100.0% Not responsible for grandchildrenBlack or African American 56 50.7% Responsible for grandchildren54 49.3% Not responsible for grandchildrenWhite alone, not Hispanic / Latino 14 100.0% Not responsible for grandchildrenGrandparents (60 years and over) White / Caucasian 122 100.0% Not responsible for grandchildrenBlack or African American 6 19.6% Responsible for grandchildren25 80.4% Not responsible for grandchildrenWhite alone, not Hispanic / Latino 80 100.0% Not responsible for grandchildren