Races in Cliffside Park, New Jersey (NJ) Detailed Stats
Data:
Races - White alone (%)
Races - White alone (% change since 2000)
Races - Black alone (%)
Races - Black alone (% change since 2000)
Races - American Indian alone (%)
Races - American Indian alone (% change since 2000)
Races - Asian alone (%)
Races - Asian alone (% change since 2000)
Races - Hispanic (%)
Races - Hispanic (% change since 2000)
Races - Native Hawaiian and Other Pacific Islander alone (%)
Races - Native Hawaiian and Other Pacific Islander alone (% change since 2000)
Races - Two or more races(%)
Races - Two or more races(% change since 2000)
Races - Other race alone (%)
Races - Other race alone (% change since 2000)
Racial diversity
Place of birth - Born in state of residence (%)
Place of birth - Born in state of residence (%) - White
Place of birth - Born in state of residence (%) - Black or African American
Place of birth - Born in state of residence (%) - Asian
Place of birth - Born in state of residence (%) - Hispanic or Latino
Place of birth - Born in state of residence (%) - American Indian and Alaska Native
Place of birth - Born in state of residence (%) - Multirace
Place of birth - Born in state of residence (%) - Other Race
Place of birth - Born in other state (%)
Place of birth - Born in other state (%) - White
Place of birth - Born in other state (%) - Black or African American
Place of birth - Born in other state (%) - Asian
Place of birth - Born in other state (%) - Hispanic or Latino
Place of birth - Born in other state (%) - American Indian and Alaska Native
Place of birth - Born in other state (%) - Multirace
Place of birth - Born in other state (%) - Other Race
Place of birth - Native, outside of US (%)
Place of birth - Native, outside of US (%) - White
Place of birth - Native, outside of US (%) - Black or African American
Place of birth - Native, outside of US (%) - Asian
Place of birth - Native, outside of US (%) - Hispanic or Latino
Place of birth - Native, outside of US (%) - American Indian and Alaska Native
Place of birth - Native, outside of US (%) - Multirace
Place of birth - Native, outside of US (%) - Other Race
Place of birth - Foreign born (%)
Place of birth - Foreign born (%) - White
Place of birth - Foreign born (%) - Black or African American
Place of birth - Foreign born (%) - Asian
Place of birth - Foreign born (%) - Hispanic or Latino
Place of birth - Foreign born (%) - American Indian and Alaska Native
Place of birth - Foreign born (%) - Multirace
Place of birth - Foreign born (%) - Other Race
Residents speaking English at home (%)
Residents speaking English at home - Born in the United States (%)
Residents speaking English at home - Native, born elsewhere (%)
Residents speaking English at home - Foreign born (%)
Residents speaking Spanish at home (%)
Residents speaking Spanish at home - Born in the United States (%)
Residents speaking Spanish at home - Native, born elsewhere (%)
Residents speaking Spanish at home - Foreign born (%)
Residents speaking other language at home (%)
Residents speaking other language at home - Born in the United States (%)
Residents speaking other language at home - Native, born elsewhere (%)
Residents speaking other language at home - Foreign born (%)
Marital status - Never married (%)
Marital status - Now married (%)
Marital status - Separated (%)
Marital status - Widowed (%)
Marital status - Divorced (%)
Ancestries Reported - Arab (%)
Ancestries Reported - Czech (%)
Ancestries Reported - Danish (%)
Ancestries Reported - Dutch (%)
Ancestries Reported - English (%)
Ancestries Reported - French (%)
Ancestries Reported - French Canadian (%)
Ancestries Reported - German (%)
Ancestries Reported - Greek (%)
Ancestries Reported - Hungarian (%)
Ancestries Reported - Irish (%)
Ancestries Reported - Italian (%)
Ancestries Reported - Lithuanian (%)
Ancestries Reported - Norwegian (%)
Ancestries Reported - Polish (%)
Ancestries Reported - Portuguese (%)
Ancestries Reported - Russian (%)
Ancestries Reported - Scotch-Irish (%)
Ancestries Reported - Scottish (%)
Ancestries Reported - Slovak (%)
Ancestries Reported - Subsaharan African (%)
Ancestries Reported - Swedish (%)
Ancestries Reported - Swiss (%)
Ancestries Reported - Ukrainian (%)
Ancestries Reported - United States (%)
Ancestries Reported - Welsh (%)
Ancestries Reported - West Indian (%)
Ancestries Reported - Other (%)
Geographical mobility - Same house 1 year ago (%)
Geographical mobility - Same house 1 year ago (%) - White
Geographical mobility - Same house 1 year ago (%) - Black or African American
Geographical mobility - Same house 1 year ago (%) - Asian
Geographical mobility - Same house 1 year ago (%) - Hispanic or Latino
Geographical mobility - Same house 1 year ago (%) - American Indian and Alaska Native
Geographical mobility - Same house 1 year ago (%) - Multirace
Geographical mobility - Same house 1 year ago (%) - Other Race
Geographical mobility - Moved within same county (%)
Geographical mobility - Moved within same county (%) - White
Geographical mobility - Moved within same county (%) - Black or African American
Geographical mobility - Moved within same county (%) - Asian
Geographical mobility - Moved within same county (%) - Hispanic or Latino
Geographical mobility - Moved within same county (%) - American Indian and Alaska Native
Geographical mobility - Moved within same county (%) - Multirace
Geographical mobility - Moved within same county (%) - Other Race
Geographical mobility - Moved from different county within same state (%)
Geographical mobility - Moved from different county within same state (%) - White
Geographical mobility - Moved from different county within same state (%) - Black or African American
Geographical mobility - Moved from different county within same state (%) - Asian
Geographical mobility - Moved from different county within same state (%) - Hispanic or Latino
Geographical mobility - Moved from different county within same state (%) - American Indian and Alaska Native
Geographical mobility - Moved from different county within same state (%) - Multirace
Geographical mobility - Moved from different county within same state (%) - Other Race
Geographical mobility - Moved from different state (%)
Geographical mobility - Moved from different state (%) - White
Geographical mobility - Moved from different state (%) - Black or African American
Geographical mobility - Moved from different state (%) - Asian
Geographical mobility - Moved from different state (%) - Hispanic or Latino
Geographical mobility - Moved from different state (%) - American Indian and Alaska Native
Geographical mobility - Moved from different state (%) - Multirace
Geographical mobility - Moved from different state (%) - Other Race
Geographical mobility - Moved from abroad (%)
Geographical mobility - Moved from abroad (%) - White
Geographical mobility - Moved from abroad (%) - Black or African American
Geographical mobility - Moved from abroad (%) - Asian
Geographical mobility - Moved from abroad (%) - Hispanic or Latino
Geographical mobility - Moved from abroad (%) - American Indian and Alaska Native
Geographical mobility - Moved from abroad (%) - Multirace
Geographical mobility - Moved from abroad (%) - Other Race
Place of birth for the foreign-born population - Ireland (%)
Place of birth for the foreign-born population - Denmark (%)
Place of birth for the foreign-born population - Norway (%)
Place of birth for the foreign-born population - Sweden (%)
Place of birth for the foreign-born population - United Kingdom (%)
Place of birth for the foreign-born population - England (%)
Place of birth for the foreign-born population - Scotland (%)
Place of birth for the foreign-born population - Other Northern Europe (%)
Place of birth for the foreign-born population - Austria (%)
Place of birth for the foreign-born population - Belgium (%)
Place of birth for the foreign-born population - France (%)
Place of birth for the foreign-born population - Germany (%)
Place of birth for the foreign-born population - Netherlands (%)
Place of birth for the foreign-born population - Switzerland (%)
Place of birth for the foreign-born population - Other Western Europe (%)
Place of birth for the foreign-born population - Greece (%)
Place of birth for the foreign-born population - Italy (%)
Place of birth for the foreign-born population - Portugal (%)
Place of birth for the foreign-born population - Spain (%)
Place of birth for the foreign-born population - Other Southern Europe (%)
Place of birth for the foreign-born population - Albania (%)
Place of birth for the foreign-born population - Belarus (%)
Place of birth for the foreign-born population - Bosnia and Herzegovina (%)
Place of birth for the foreign-born population - Bulgaria (%)
Place of birth for the foreign-born population - Croatia (%)
Place of birth for the foreign-born population - Czechoslovakia (%)
Place of birth for the foreign-born population - Hungary (%)
Place of birth for the foreign-born population - Latvia (%)
Place of birth for the foreign-born population - Lithuania (%)
Place of birth for the foreign-born population - North Macedonia (Macedonia) (%)
Place of birth for the foreign-born population - Moldova (%)
Place of birth for the foreign-born population - Poland (%)
Place of birth for the foreign-born population - Romania (%)
Place of birth for the foreign-born population - Russia (%)
Place of birth for the foreign-born population - Serbia (%)
Place of birth for the foreign-born population - Ukraine (%)
Place of birth for the foreign-born population - Other Eastern Europe (%)
Place of birth for the foreign-born population - China (%)
Place of birth for the foreign-born population - Hong Kong (%)
Place of birth for the foreign-born population - Taiwan (%)
Place of birth for the foreign-born population - Japan (%)
Place of birth for the foreign-born population - Korea (%)
Place of birth for the foreign-born population - Other Eastern Asia (%)
Place of birth for the foreign-born population - Afghanistan (%)
Place of birth for the foreign-born population - Bangladesh (%)
Place of birth for the foreign-born population - India (%)
Place of birth for the foreign-born population - Iran (%)
Place of birth for the foreign-born population - Kazakhstan (%)
Place of birth for the foreign-born population - Nepal (%)
Place of birth for the foreign-born population - Pakistan (%)
Place of birth for the foreign-born population - Sri Lanka (%)
Place of birth for the foreign-born population - Uzbekistan (%)
Place of birth for the foreign-born population - Other South Central Asia (%)
Place of birth for the foreign-born population - Burma (%)
Place of birth for the foreign-born population - Cambodia (%)
Place of birth for the foreign-born population - Indonesia (%)
Place of birth for the foreign-born population - Laos (%)
Place of birth for the foreign-born population - Malaysia (%)
Place of birth for the foreign-born population - Philippines (%)
Place of birth for the foreign-born population - Singapore (%)
Place of birth for the foreign-born population - Thailand (%)
Place of birth for the foreign-born population - Vietnam (%)
Place of birth for the foreign-born population - Other South Eastern Asia (%)
Place of birth for the foreign-born population - Armenia (%)
Place of birth for the foreign-born population - Iraq (%)
Place of birth for the foreign-born population - Israel (%)
Place of birth for the foreign-born population - Jordan (%)
Place of birth for the foreign-born population - Kuwait (%)
Place of birth for the foreign-born population - Lebanon (%)
Place of birth for the foreign-born population - Saudi Arabia (%)
Place of birth for the foreign-born population - Syria (%)
Place of birth for the foreign-born population - Turkey (%)
Place of birth for the foreign-born population - Yemen (%)
Place of birth for the foreign-born population - Other Western Asia (%)
Place of birth for the foreign-born population - Eritrea (%)
Place of birth for the foreign-born population - Ethiopia (%)
Place of birth for the foreign-born population - Kenya (%)
Place of birth for the foreign-born population - Somalia (%)
Place of birth for the foreign-born population - Uganda (%)
Place of birth for the foreign-born population - Zimbabwe (%)
Place of birth for the foreign-born population - Other Eastern Africa (%)
Place of birth for the foreign-born population - Cameroon (%)
Place of birth for the foreign-born population - Congo (%)
Place of birth for the foreign-born population - Democratic Republic of Congo (Zaire) (%)
Place of birth for the foreign-born population - Other Middle Africa (%)
Place of birth for the foreign-born population - Egypt (%)
Place of birth for the foreign-born population - Morocco (%)
Place of birth for the foreign-born population - Sudan (%)
Place of birth for the foreign-born population - Other Northern Africa (%)
Place of birth for the foreign-born population - South Africa (%)
Place of birth for the foreign-born population - Other Southern Africa (%)
Place of birth for the foreign-born population - Cabo Verde (%)
Place of birth for the foreign-born population - Ghana (%)
Place of birth for the foreign-born population - Liberia (%)
Place of birth for the foreign-born population - Nigeria (%)
Place of birth for the foreign-born population - Senegal (%)
Place of birth for the foreign-born population - Sierra Leone (%)
Place of birth for the foreign-born population - Other Western Africa (%)
Place of birth for the foreign-born population - Australia (%)
Place of birth for the foreign-born population - New Zealand (%)
Place of birth for the foreign-born population - Fiji (%)
Place of birth for the foreign-born population - Micronesia (%)
Place of birth for the foreign-born population - Bahamas (%)
Place of birth for the foreign-born population - Barbados (%)
Place of birth for the foreign-born population - Cuba (%)
Place of birth for the foreign-born population - Dominica (%)
Place of birth for the foreign-born population - Dominican Republic (%)
Place of birth for the foreign-born population - Grenada (%)
Place of birth for the foreign-born population - Haiti (%)
Place of birth for the foreign-born population - Jamaica (%)
Place of birth for the foreign-born population - St. Vincent and the Grenadines (%)
Place of birth for the foreign-born population - Trinidad and Tobago (%)
Place of birth for the foreign-born population - West Indies (%)
Place of birth for the foreign-born population - Other Caribbean (%)
Place of birth for the foreign-born population - Belize (%)
Place of birth for the foreign-born population - Costa Rica (%)
Place of birth for the foreign-born population - El Salvador (%)
Place of birth for the foreign-born population - Guatemala (%)
Place of birth for the foreign-born population - Honduras (%)
Place of birth for the foreign-born population - Mexico (%)
Place of birth for the foreign-born population - Nicaragua (%)
Place of birth for the foreign-born population - Panama (%)
Place of birth for the foreign-born population - Other Central America (%)
Place of birth for the foreign-born population - Argentina (%)
Place of birth for the foreign-born population - Bolivia (%)
Place of birth for the foreign-born population - Brazil (%)
Place of birth for the foreign-born population - Chile (%)
Place of birth for the foreign-born population - Colombia (%)
Place of birth for the foreign-born population - Ecuador (%)
Place of birth for the foreign-born population - Guyana (%)
Place of birth for the foreign-born population - Peru (%)
Place of birth for the foreign-born population - Uruguay (%)
Place of birth for the foreign-born population - Venezuela (%)
Place of birth for the foreign-born population - Other South America (%)
Place of birth for the foreign-born population - Canada (%)
Place of birth for the foreign-born population - Other Northern America (%)
Place of birth for the foreign-born population - Other (%)
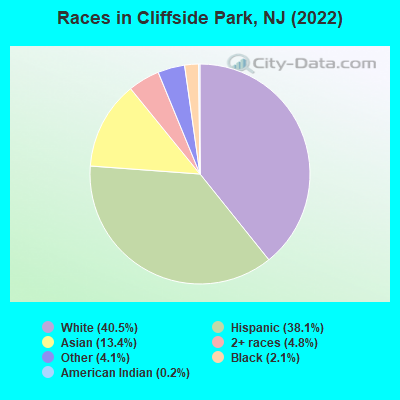
According to 2022 data, the most numerous races in Cliffside Park, NJ are White alone (10,333 residents), Hispanic (9,723 residents), and Black alone (537 residents). 34.2% of Cliffside Park residents speak English at home. 47.6% of Cliffside Park, NJ residents are foreign-born (22.6% born in Latin America, 11.8% born in Asia, 10.4% born in Europe), which is 51.7% greater than the foreign-born rate of 23.0% across the entire state of New Jersey.
Race distribution in Cliffside Park
2000 2022
5,557,209 66.0% White alone 1,117,191 13.3% Hispanic 1,096,171 13.0% Black alone 477,012 5.7% Asian alone 133,689 1.6% Two or more races 19,565 0.2% Other race alone 11,338 0.1% American Indian alone 2,175 0.03% Native Hawaiian and Other
4,766,476 51.5% White alone 2,028,470 21.9% Hispanic 1,111,632 12.0% Black alone 923,546 10.0% Asian alone 332,237 3.6% Two or more races 89,847 1.0% Other race alone 8,557 0.09% American Indian alone 934 0.01% Native Hawaiian and Other
Income and house value in Cliffside Park Median household income in 2022 $98,113 White non-Hispanic householders$120,976 Asian householders$63,086 Some other race householders$102,511 Two or more races householders$65,697 Hispanic or Latino race householdersMedian 2022 house value $521,135 White Non-Hispanic householders$836,736 Black or African American householders$434,472 American Indian or Alaska Native householders $932,436 Asian householders$587,638 Some other race householders$675,923 Two or more races householders$559,368 Hispanic or Latino householders
Median age by race in Cliffside Park
44.1 Median age for White residents43.0 45.4 52.9 Median age for Black or African American residents60.4 43.9 32.0 Median age for American Indian / Alaska Native residents30.8 12.2 37.7 Median age for Asian residents38.0 37.4 -510,460,250.5 Median age for Native Hawaiian / Pacific Islander residents-514,767,932.0 -713,070,378.3 34.4 Median age for Other race residents29.6 42.7 35.5 Median age for Two or more races residents32.4 43.8 48.8 Median age for White alone residents50.3 46.9 33.1 Median age for Hispanic or Latino residents31.0 39.0
Owner/renter occupied households by race in Cliffside Park
House owners and renters - White residents 3,382 58.0% Owner occupied2,450 42.0% Renter occupiedHouse owners and renters - Black or African American residents 84 19.9% Owner occupied338 80.1% Renter occupiedHouse owners and renters - American Indian / Alaska Native residents 101 100.0% Renter occupiedHouse owners and renters - Asian residents 875 59.1% Owner occupied606 40.9% Renter occupiedHouse owners and renters - Other race residents 298 19.4% Owner occupied1,234 80.6% Renter occupiedHouse owners and renters - Two or more races residents 591 35.1% Owner occupied1,093 64.9% Renter occupiedHouse owners and renters - White alone residents 3,111 62.1% Owner occupied1,902 37.9% Renter occupiedHouse owners and renters - Hispanic or Latino residents 977 29.5% Owner occupied2,330 70.5% Renter occupied
Language usage in Cliffside Park
English speakers - Total 34.2% of residents of Cliffside Park speak English at home.
33.1% of residents speak Spanish at home 4,604 57.0% Speak English very well3,474 43.0% Speak English less than very well34.3% of residents speak other language at home 5,613 67.2% Speak English very well2,738 32.8% Speak English less than very well
English speakers - Born in the United States 56.6% of residents of Cliffside Park speak English at home.
20.9% of residents speak Spanish at home 598 68.4% Speak English very well276 31.6% Speak English less than very well26.7% of residents speak other language at home 1,107 99.5% Speak English very well6 0.5% Speak English less than very well
English speakers - Native, born elsewhere 30.3% of residents of Cliffside Park speak English at home.
53.8% of residents speak Spanish at home 303 84.4% Speak English very well56 15.6% Speak English less than very well13.8% of residents speak other language at home 73 79.3% Speak English very well19 20.7% Speak English less than very well
English speakers - Foreign-born 12.4% of residents of Cliffside Park speak English at home.
39.3% of residents speak Spanish at home 1,688 35.6% Speak English very well3,048 64.4% Speak English less than very well49.1% of residents speak other language at home 3,295 55.6% Speak English very well2,626 44.4% Speak English less than very well
White (Caucasian) - Speak only English Native:
65.4% (4,986)Foreign-born:
13.5% (557)
White (Caucasian) - Speak another language Native:
28.7% (2,188)Foreign-born:
84.6% (3,502)
Black or African American - Speak only English Native:
70.6% (99)Foreign-born:
52.0% (250)
Black or African American - Speak another language Native:
29.6% (42)Foreign-born:
45.2% (217)
American Indian / Alaska Native - Speak another language Native:
44.5% (27)Foreign-born:
100.0% (179)
Asian - Speak only English Native:
24.1% (244)Foreign-born:
15.4% (358)
Asian - Speak another language Native:
74.9% (758)Foreign-born:
84.4% (1,959)
Other race - Speak only English Native:
32.9% (594)Foreign-born:
3.5% (88)
Other race - Speak another language Native:
64.0% (1,156)Foreign-born:
97.8% (2,485)
Two or more races - Speak only English Native:
44.2% (1,081)Foreign-born:
10.2% (282)
Two or more races - Speak another language Native:
57.6% (1,407)Foreign-born:
90.1% (2,501)
White alone - Speak only English Native:
71.4% (4,452)Foreign-born:
13.7% (507)
White alone - Speak another language Native:
27.4% (1,711)Foreign-born:
86.6% (3,202)
Hispanic or Latino - Speak only English Native:
29.0% (1,195)Foreign-born:
8.6% (429)
Hispanic or Latino - Speak another language Native:
73.0% (3,005)Foreign-born:
91.3% (4,540)
Foreign-born residents in Cliffside Park 12,165 residents are foreign born (22.6% Latin America , 11.8% Asia , 10.4% Europe ).
This city:
47.6%New Jersey:
23.2%
Marital status for residents in Cliffside Park Marital status - White (Caucasian) population 15 years and over
Males 29.9% Never married59.5% Now married0.2% Separated2.9% Widowed7.4% DivorcedFemales 28.4% Never married45.5% Now married1.4% Separated10.7% Widowed14.0% DivorcedWomen who gave birth in the past 12 months Now married:
41.9% (40)Unmarried:
58.1% (56)
Women who did not give birth in the past 12 months Now married:
42.5% (1,082)Unmarried:
57.5% (1,463)
Marital status - Black or African American population 15 years and over
Males 36.8% Never married52.5% Now married0.0% Separated0.0% Widowed10.7% DivorcedFemales 43.9% Never married16.9% Now married0.0% Separated1.1% Widowed38.1% DivorcedWomen who did not give birth in the past 12 months Now married:
12.6% (18)Unmarried:
87.4% (121)
Marital status - American Indian / Alaska Native population 15 years and over
Males 36.1% Never married63.9% Now married0.0% Separated0.0% Widowed0.0% DivorcedFemales 20.3% Never married59.4% Now married0.0% Separated20.3% Widowed0.0% DivorcedWomen who did not give birth in the past 12 months Now married:
74.5% (59)Unmarried:
25.5% (20)
Marital status - Asian population 15 years and over
Males 16.4% Never married74.0% Now married1.1% Separated2.4% Widowed6.0% DivorcedFemales 15.2% Never married72.4% Now married1.2% Separated9.3% Widowed2.0% DivorcedWomen who gave birth in the past 12 months Now married:
100.0% (28)Unmarried:
0.0% (0)
Women who did not give birth in the past 12 months Now married:
73.6% (835)Unmarried:
26.4% (299)
Marital status - Other race population 15 years and over
Males 61.4% Never married24.3% Now married6.5% Separated0.0% Widowed7.8% DivorcedFemales 47.8% Never married33.4% Now married9.5% Separated4.6% Widowed4.7% DivorcedWomen who gave birth in the past 12 months Now married:
100.0% (28)Unmarried:
0.0% (0)
Women who did not give birth in the past 12 months Now married:
40.6% (590)Unmarried:
59.4% (864)
Marital status - Two or more races population 15 years and over
Males 46.9% Never married44.6% Now married0.0% Separated0.0% Widowed8.5% DivorcedFemales 50.5% Never married37.4% Now married3.9% Separated4.9% Widowed3.3% DivorcedWomen who gave birth in the past 12 months Now married:
43.0% (93)Unmarried:
57.0% (124)
Women who did not give birth in the past 12 months Now married:
39.9% (372)Unmarried:
60.1% (560)
Marital status - White alone, not Hispanic / Latino population 15 years and over
Males 24.1% Never married64.7% Now married0.3% Separated3.9% Widowed7.0% DivorcedFemales 24.0% Never married51.4% Now married1.1% Separated11.6% Widowed11.8% DivorcedWomen who gave birth in the past 12 months Now married:
41.9% (46)Unmarried:
58.1% (65)
Women who did not give birth in the past 12 months Now married:
48.1% (934)Unmarried:
51.9% (1,006)
Marital status - Hispanic or Latino population 15 years and over
Males 49.4% Never married40.9% Now married0.0% Separated0.0% Widowed9.6% DivorcedFemales 42.5% Never married33.0% Now married5.0% Separated6.2% Widowed13.3% DivorcedWomen who gave birth in the past 12 months Now married:
44.1% (70)Unmarried:
55.9% (89)
Women who did not give birth in the past 12 months Now married:
38.6% (967)Unmarried:
61.4% (1,540)
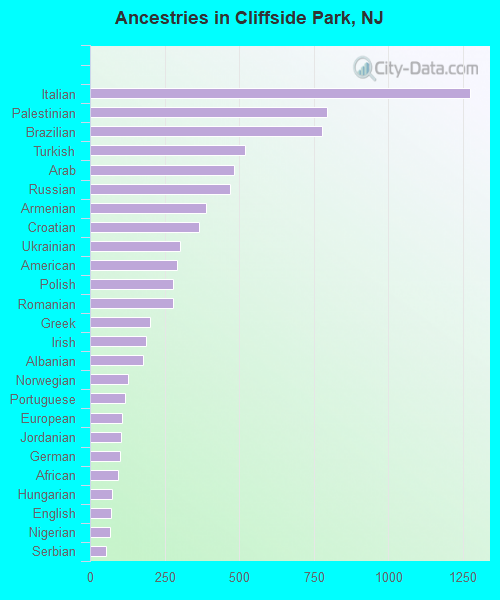
Ancestries in Cliffside Park
1,274 8.0% Italian793 5.0% Palestinian779 4.9% Brazilian521 3.3% Turkish484 3.0% Arab470 3.0% Russian390 2.5% Armenian367 2.3% Croatian303 1.9% Ukrainian293 1.8% American278 1.8% Polish277 1.7% Romanian200 1.3% Greek187 1.2% Irish177 1.1% Albanian129 0.8% Norwegian116 0.7% Portuguese107 0.7% European105 0.7% Jordanian102 0.6% German95 0.6% African75 0.5% Hungarian71 0.4% English66 0.4% Nigerian54 0.3% Serbian52 0.3% Egyptian31 0.2% Lebanese27 0.2% French26 0.2% Slovak20 0.1% Eastern European17 0.1% Jamaican15 0.09% Guyanese9 0.06% Iranian8 0.05% Canadian
Geographical mobility in Cliffside Park Same house 1 year ago 11,211 87.2% White (Caucasian)690 97.4% Black or African American302 96.6% American Indian / Alaska Native3,032 89.8% Asian3,774 85.2% Other race4,448 82.2% Two or more races8,870 85.9% White alone, not Hispanic / Latino8,336 85.9% Hispanic or LatinoMoved within same county 735 5.7% White / Caucasian7 1.0% Black or African American115 3.4% Asian49 1.1% Other race198 3.7% Two or more races694 6.7% White alone, not Hispanic / Latino187 1.9% Hispanic or LatinoMoved within same state 541 4.2% White / Caucasian109 3.2% Asian72 1.6% Other race584 10.8% Two or more races472 4.6% White alone, not Hispanic / Latino702 7.2% Hispanic or LatinoMoved from different state 162 1.3% White / Caucasian19 2.7% Black or African American42 1.2% Asian238 5.4% Other race10 0.2% Two or more races133 1.3% White alone, not Hispanic / Latino291 3.0% Hispanic or LatinoMoved from abroad 108 0.8% White25 0.8% Asian62 1.4% Other race365 6.7% Two or more races114 1.1% White alone, not Hispanic / Latino246 2.5% Hispanic or Latino
Children Nativity (place of birth) in Cliffside Park
Children under 6 years - Living with two parents Both parents native 327 100.0% NativeBoth parents foreign-born 254 83.7% Native49 16.3% Foreign-bornOne native, one foreign-born parent 504 100.0% NativeChildren under 6 years - Living with one parent Native parent 105 100.0% NativeForeign-born parent 28 100.0% NativeChildren 6 to 17 years - Living with two parents Both parents native 506 92.3% Native42 7.7% Foreign-bornBoth parents foreign-born 1,089 90.3% Native117 9.7% Foreign-bornOne native, one foreign-born parent 623 94.0% Native40 6.0% Foreign-bornChildren 6 to 17 years - Living with one parent Foreign-born parent 1,026 55.9% Native808 44.1% Foreign-born
Place of birth for residents in Cliffside Park 5,999 Americas5,928 Latin America3,091 Asia2,730 Europe2,296 South America1,885 Caribbean1,765 Eastern Europe1,746 Central America1,483 Eastern Asia786 Western Asia700 Southern Europe491 China441 South Central Asia344 Africa215 South Eastern Asia201 Western Europe124 Eastern Africa105 Northern Africa91 Western Africa70 Northern America62 Northern Europe23 Middle Africa1,332 Guatemala915 Dominican Republic902 Korea832 Brazil727 Ecuador516 Turkey484 Cuba436 Trinidad and Tobago415 Ukraine387 China351 Russia334 India292 El Salvador268 Italy234 Colombia225 Spain225 Venezuela215 Philippines199 Romania182 France164 Croatia131 Peru109 Portugal105 Egypt98 Yemen96 Greece94 Lebanon93 Poland90 Japan83 Zimbabwe70 Canada68 Taiwan61 Albania55 Nicaragua54 Moldova54 Belarus49 Nigeria44 Panama42 Ghana36 Guyana35 Hungary34 Hong Kong29 Serbia27 Uzbekistan27 Georgia26 Sri Lanka25 England24 St. Vincent and the Grenadines24 Kazakhstan23 Cameroon23 Jamaica22 Mexico21 Israel20 United Kingdom19 Pakistan18 Chile17 Latvia17 Syria16 Ireland16 Uganda15 Kenya13 Lithuania11 Germany10 Jordan9 Tanzania9 Iran9 Bolivia8 Austria
Grandparents responsible for own grandchildren in Cliffside Park
Grandparents (30 to 59 years) White / Caucasian 13 100.0% Not responsible for grandchildrenTwo or more races 68 65.4% Responsible for grandchildren36 34.6% Not responsible for grandchildrenHispanic or Latino 55 71.3% Responsible for grandchildren22 28.7% Not responsible for grandchildrenGrandparents (60 years and over) White / Caucasian 8 11.5% Responsible for grandchildren63 88.5% Not responsible for grandchildrenTwo or more races 41 100.0% Not responsible for grandchildrenHispanic or Latino 115 100.0% Not responsible for grandchildren