Races in Clarksdale, Mississippi (MS) Detailed Stats
Data:
Races - White alone (%)
Races - White alone (% change since 2000)
Races - Black alone (%)
Races - Black alone (% change since 2000)
Races - American Indian alone (%)
Races - American Indian alone (% change since 2000)
Races - Asian alone (%)
Races - Asian alone (% change since 2000)
Races - Hispanic (%)
Races - Hispanic (% change since 2000)
Races - Native Hawaiian and Other Pacific Islander alone (%)
Races - Native Hawaiian and Other Pacific Islander alone (% change since 2000)
Races - Two or more races(%)
Races - Two or more races(% change since 2000)
Races - Other race alone (%)
Races - Other race alone (% change since 2000)
Racial diversity
Place of birth - Born in state of residence (%)
Place of birth - Born in state of residence (%) - White
Place of birth - Born in state of residence (%) - Black or African American
Place of birth - Born in state of residence (%) - Asian
Place of birth - Born in state of residence (%) - Hispanic or Latino
Place of birth - Born in state of residence (%) - American Indian and Alaska Native
Place of birth - Born in state of residence (%) - Multirace
Place of birth - Born in state of residence (%) - Other Race
Place of birth - Born in other state (%)
Place of birth - Born in other state (%) - White
Place of birth - Born in other state (%) - Black or African American
Place of birth - Born in other state (%) - Asian
Place of birth - Born in other state (%) - Hispanic or Latino
Place of birth - Born in other state (%) - American Indian and Alaska Native
Place of birth - Born in other state (%) - Multirace
Place of birth - Born in other state (%) - Other Race
Place of birth - Native, outside of US (%)
Place of birth - Native, outside of US (%) - White
Place of birth - Native, outside of US (%) - Black or African American
Place of birth - Native, outside of US (%) - Asian
Place of birth - Native, outside of US (%) - Hispanic or Latino
Place of birth - Native, outside of US (%) - American Indian and Alaska Native
Place of birth - Native, outside of US (%) - Multirace
Place of birth - Native, outside of US (%) - Other Race
Place of birth - Foreign born (%)
Place of birth - Foreign born (%) - White
Place of birth - Foreign born (%) - Black or African American
Place of birth - Foreign born (%) - Asian
Place of birth - Foreign born (%) - Hispanic or Latino
Place of birth - Foreign born (%) - American Indian and Alaska Native
Place of birth - Foreign born (%) - Multirace
Place of birth - Foreign born (%) - Other Race
Residents speaking English at home (%)
Residents speaking English at home - Born in the United States (%)
Residents speaking English at home - Native, born elsewhere (%)
Residents speaking English at home - Foreign born (%)
Residents speaking Spanish at home (%)
Residents speaking Spanish at home - Born in the United States (%)
Residents speaking Spanish at home - Native, born elsewhere (%)
Residents speaking Spanish at home - Foreign born (%)
Residents speaking other language at home (%)
Residents speaking other language at home - Born in the United States (%)
Residents speaking other language at home - Native, born elsewhere (%)
Residents speaking other language at home - Foreign born (%)
Marital status - Never married (%)
Marital status - Now married (%)
Marital status - Separated (%)
Marital status - Widowed (%)
Marital status - Divorced (%)
Ancestries Reported - Arab (%)
Ancestries Reported - Czech (%)
Ancestries Reported - Danish (%)
Ancestries Reported - Dutch (%)
Ancestries Reported - English (%)
Ancestries Reported - French (%)
Ancestries Reported - French Canadian (%)
Ancestries Reported - German (%)
Ancestries Reported - Greek (%)
Ancestries Reported - Hungarian (%)
Ancestries Reported - Irish (%)
Ancestries Reported - Italian (%)
Ancestries Reported - Lithuanian (%)
Ancestries Reported - Norwegian (%)
Ancestries Reported - Polish (%)
Ancestries Reported - Portuguese (%)
Ancestries Reported - Russian (%)
Ancestries Reported - Scotch-Irish (%)
Ancestries Reported - Scottish (%)
Ancestries Reported - Slovak (%)
Ancestries Reported - Subsaharan African (%)
Ancestries Reported - Swedish (%)
Ancestries Reported - Swiss (%)
Ancestries Reported - Ukrainian (%)
Ancestries Reported - United States (%)
Ancestries Reported - Welsh (%)
Ancestries Reported - West Indian (%)
Ancestries Reported - Other (%)
Geographical mobility - Same house 1 year ago (%)
Geographical mobility - Same house 1 year ago (%) - White
Geographical mobility - Same house 1 year ago (%) - Black or African American
Geographical mobility - Same house 1 year ago (%) - Asian
Geographical mobility - Same house 1 year ago (%) - Hispanic or Latino
Geographical mobility - Same house 1 year ago (%) - American Indian and Alaska Native
Geographical mobility - Same house 1 year ago (%) - Multirace
Geographical mobility - Same house 1 year ago (%) - Other Race
Geographical mobility - Moved within same county (%)
Geographical mobility - Moved within same county (%) - White
Geographical mobility - Moved within same county (%) - Black or African American
Geographical mobility - Moved within same county (%) - Asian
Geographical mobility - Moved within same county (%) - Hispanic or Latino
Geographical mobility - Moved within same county (%) - American Indian and Alaska Native
Geographical mobility - Moved within same county (%) - Multirace
Geographical mobility - Moved within same county (%) - Other Race
Geographical mobility - Moved from different county within same state (%)
Geographical mobility - Moved from different county within same state (%) - White
Geographical mobility - Moved from different county within same state (%) - Black or African American
Geographical mobility - Moved from different county within same state (%) - Asian
Geographical mobility - Moved from different county within same state (%) - Hispanic or Latino
Geographical mobility - Moved from different county within same state (%) - American Indian and Alaska Native
Geographical mobility - Moved from different county within same state (%) - Multirace
Geographical mobility - Moved from different county within same state (%) - Other Race
Geographical mobility - Moved from different state (%)
Geographical mobility - Moved from different state (%) - White
Geographical mobility - Moved from different state (%) - Black or African American
Geographical mobility - Moved from different state (%) - Asian
Geographical mobility - Moved from different state (%) - Hispanic or Latino
Geographical mobility - Moved from different state (%) - American Indian and Alaska Native
Geographical mobility - Moved from different state (%) - Multirace
Geographical mobility - Moved from different state (%) - Other Race
Geographical mobility - Moved from abroad (%)
Geographical mobility - Moved from abroad (%) - White
Geographical mobility - Moved from abroad (%) - Black or African American
Geographical mobility - Moved from abroad (%) - Asian
Geographical mobility - Moved from abroad (%) - Hispanic or Latino
Geographical mobility - Moved from abroad (%) - American Indian and Alaska Native
Geographical mobility - Moved from abroad (%) - Multirace
Geographical mobility - Moved from abroad (%) - Other Race
Place of birth for the foreign-born population - Ireland (%)
Place of birth for the foreign-born population - Denmark (%)
Place of birth for the foreign-born population - Norway (%)
Place of birth for the foreign-born population - Sweden (%)
Place of birth for the foreign-born population - United Kingdom (%)
Place of birth for the foreign-born population - England (%)
Place of birth for the foreign-born population - Scotland (%)
Place of birth for the foreign-born population - Other Northern Europe (%)
Place of birth for the foreign-born population - Austria (%)
Place of birth for the foreign-born population - Belgium (%)
Place of birth for the foreign-born population - France (%)
Place of birth for the foreign-born population - Germany (%)
Place of birth for the foreign-born population - Netherlands (%)
Place of birth for the foreign-born population - Switzerland (%)
Place of birth for the foreign-born population - Other Western Europe (%)
Place of birth for the foreign-born population - Greece (%)
Place of birth for the foreign-born population - Italy (%)
Place of birth for the foreign-born population - Portugal (%)
Place of birth for the foreign-born population - Spain (%)
Place of birth for the foreign-born population - Other Southern Europe (%)
Place of birth for the foreign-born population - Albania (%)
Place of birth for the foreign-born population - Belarus (%)
Place of birth for the foreign-born population - Bosnia and Herzegovina (%)
Place of birth for the foreign-born population - Bulgaria (%)
Place of birth for the foreign-born population - Croatia (%)
Place of birth for the foreign-born population - Czechoslovakia (%)
Place of birth for the foreign-born population - Hungary (%)
Place of birth for the foreign-born population - Latvia (%)
Place of birth for the foreign-born population - Lithuania (%)
Place of birth for the foreign-born population - North Macedonia (Macedonia) (%)
Place of birth for the foreign-born population - Moldova (%)
Place of birth for the foreign-born population - Poland (%)
Place of birth for the foreign-born population - Romania (%)
Place of birth for the foreign-born population - Russia (%)
Place of birth for the foreign-born population - Serbia (%)
Place of birth for the foreign-born population - Ukraine (%)
Place of birth for the foreign-born population - Other Eastern Europe (%)
Place of birth for the foreign-born population - China (%)
Place of birth for the foreign-born population - Hong Kong (%)
Place of birth for the foreign-born population - Taiwan (%)
Place of birth for the foreign-born population - Japan (%)
Place of birth for the foreign-born population - Korea (%)
Place of birth for the foreign-born population - Other Eastern Asia (%)
Place of birth for the foreign-born population - Afghanistan (%)
Place of birth for the foreign-born population - Bangladesh (%)
Place of birth for the foreign-born population - India (%)
Place of birth for the foreign-born population - Iran (%)
Place of birth for the foreign-born population - Kazakhstan (%)
Place of birth for the foreign-born population - Nepal (%)
Place of birth for the foreign-born population - Pakistan (%)
Place of birth for the foreign-born population - Sri Lanka (%)
Place of birth for the foreign-born population - Uzbekistan (%)
Place of birth for the foreign-born population - Other South Central Asia (%)
Place of birth for the foreign-born population - Burma (%)
Place of birth for the foreign-born population - Cambodia (%)
Place of birth for the foreign-born population - Indonesia (%)
Place of birth for the foreign-born population - Laos (%)
Place of birth for the foreign-born population - Malaysia (%)
Place of birth for the foreign-born population - Philippines (%)
Place of birth for the foreign-born population - Singapore (%)
Place of birth for the foreign-born population - Thailand (%)
Place of birth for the foreign-born population - Vietnam (%)
Place of birth for the foreign-born population - Other South Eastern Asia (%)
Place of birth for the foreign-born population - Armenia (%)
Place of birth for the foreign-born population - Iraq (%)
Place of birth for the foreign-born population - Israel (%)
Place of birth for the foreign-born population - Jordan (%)
Place of birth for the foreign-born population - Kuwait (%)
Place of birth for the foreign-born population - Lebanon (%)
Place of birth for the foreign-born population - Saudi Arabia (%)
Place of birth for the foreign-born population - Syria (%)
Place of birth for the foreign-born population - Turkey (%)
Place of birth for the foreign-born population - Yemen (%)
Place of birth for the foreign-born population - Other Western Asia (%)
Place of birth for the foreign-born population - Eritrea (%)
Place of birth for the foreign-born population - Ethiopia (%)
Place of birth for the foreign-born population - Kenya (%)
Place of birth for the foreign-born population - Somalia (%)
Place of birth for the foreign-born population - Uganda (%)
Place of birth for the foreign-born population - Zimbabwe (%)
Place of birth for the foreign-born population - Other Eastern Africa (%)
Place of birth for the foreign-born population - Cameroon (%)
Place of birth for the foreign-born population - Congo (%)
Place of birth for the foreign-born population - Democratic Republic of Congo (Zaire) (%)
Place of birth for the foreign-born population - Other Middle Africa (%)
Place of birth for the foreign-born population - Egypt (%)
Place of birth for the foreign-born population - Morocco (%)
Place of birth for the foreign-born population - Sudan (%)
Place of birth for the foreign-born population - Other Northern Africa (%)
Place of birth for the foreign-born population - South Africa (%)
Place of birth for the foreign-born population - Other Southern Africa (%)
Place of birth for the foreign-born population - Cabo Verde (%)
Place of birth for the foreign-born population - Ghana (%)
Place of birth for the foreign-born population - Liberia (%)
Place of birth for the foreign-born population - Nigeria (%)
Place of birth for the foreign-born population - Senegal (%)
Place of birth for the foreign-born population - Sierra Leone (%)
Place of birth for the foreign-born population - Other Western Africa (%)
Place of birth for the foreign-born population - Australia (%)
Place of birth for the foreign-born population - New Zealand (%)
Place of birth for the foreign-born population - Fiji (%)
Place of birth for the foreign-born population - Micronesia (%)
Place of birth for the foreign-born population - Bahamas (%)
Place of birth for the foreign-born population - Barbados (%)
Place of birth for the foreign-born population - Cuba (%)
Place of birth for the foreign-born population - Dominica (%)
Place of birth for the foreign-born population - Dominican Republic (%)
Place of birth for the foreign-born population - Grenada (%)
Place of birth for the foreign-born population - Haiti (%)
Place of birth for the foreign-born population - Jamaica (%)
Place of birth for the foreign-born population - St. Vincent and the Grenadines (%)
Place of birth for the foreign-born population - Trinidad and Tobago (%)
Place of birth for the foreign-born population - West Indies (%)
Place of birth for the foreign-born population - Other Caribbean (%)
Place of birth for the foreign-born population - Belize (%)
Place of birth for the foreign-born population - Costa Rica (%)
Place of birth for the foreign-born population - El Salvador (%)
Place of birth for the foreign-born population - Guatemala (%)
Place of birth for the foreign-born population - Honduras (%)
Place of birth for the foreign-born population - Mexico (%)
Place of birth for the foreign-born population - Nicaragua (%)
Place of birth for the foreign-born population - Panama (%)
Place of birth for the foreign-born population - Other Central America (%)
Place of birth for the foreign-born population - Argentina (%)
Place of birth for the foreign-born population - Bolivia (%)
Place of birth for the foreign-born population - Brazil (%)
Place of birth for the foreign-born population - Chile (%)
Place of birth for the foreign-born population - Colombia (%)
Place of birth for the foreign-born population - Ecuador (%)
Place of birth for the foreign-born population - Guyana (%)
Place of birth for the foreign-born population - Peru (%)
Place of birth for the foreign-born population - Uruguay (%)
Place of birth for the foreign-born population - Venezuela (%)
Place of birth for the foreign-born population - Other South America (%)
Place of birth for the foreign-born population - Canada (%)
Place of birth for the foreign-born population - Other Northern America (%)
Place of birth for the foreign-born population - Other (%)
Latest news about races in Clarksdale, MS collected exclusively by city-data.com from local newspapers, TV, and radio stations
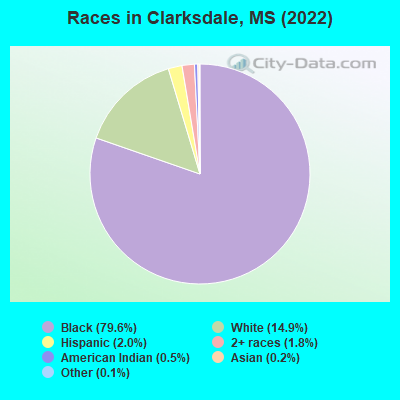
According to 2022 data, the most numerous races in Clarksdale, MS are White alone (2,188 residents), Black alone (11,688 residents), and Hispanic (295 residents). 97.4% of Clarksdale residents speak English at home. 2.0% of Clarksdale, MS residents are foreign-born (1.8% born in Latin America), which is about the same as the foreign-born rate of 2.0% across the entire state of Mississippi.
Race distribution in Clarksdale
2000 2022
1,727,908 60.7% White alone 1,028,473 36.2% Black alone 39,569 1.4% Hispanic 17,272 0.6% Two or more races 18,349 0.6% Asian alone 11,224 0.4% American Indian alone 1,294 0.05% Other race alone 569 0.02% Native Hawaiian and Other
1,625,979 55.3% White alone 1,072,962 36.5% Black alone 97,177 3.3% Hispanic 96,367 3.3% Two or more races 25,217 0.9% Asian alone 12,457 0.4% American Indian alone 9,501 0.3% Other race alone 397 0.01% Native Hawaiian and Other
Income and house value in Clarksdale Median household income in 2022 $66,431 White non-Hispanic householders$29,012 Black householders$53,497 Two or more races householders$57,527 Hispanic or Latino race householdersMedian 2022 house value $112,701 White Non-Hispanic householders$79,491 Black or African American householders $160,396 Asian householders$150,151 Two or more races householders$158,983 Hispanic or Latino householders
Median age by race in Clarksdale
56.1 Median age for White residents51.6 59.5 33.5 Median age for Black or African American residents30.6 36.6 -703,818,368.7 Median age for American Indian / Alaska Native residents-751,111,110.4 -710,601,718.5 17.9 Median age for Asian residents-683,908,045.3 18.3 -666,666,666.0 Median age for Native Hawaiian / Pacific Islander residents-668,724,279.2 -670,599,802.7 -684,895,832.6 Median age for Other race residents-681,536,554.5 -632,034,631.4 31.4 Median age for Two or more races residents28.9 2.8 55.7 Median age for White alone residents51.2 59.2 30.3 Median age for Hispanic or Latino residents30.3 48.9
Owner/renter occupied households by race in Clarksdale
House owners and renters - White residents 789 77.1% Owner occupied234 22.9% Renter occupiedHouse owners and renters - Black or African American residents 2,098 45.2% Owner occupied2,547 54.8% Renter occupiedHouse owners and renters - American Indian / Alaska Native residents 72 100.0% Renter occupiedHouse owners and renters - Asian residents 5 100.0% Owner occupiedHouse owners and renters - Two or more races residents 68 30.4% Owner occupied156 69.6% Renter occupiedHouse owners and renters - White alone residents 790 76.8% Owner occupied239 23.2% Renter occupiedHouse owners and renters - Hispanic or Latino residents 12 13.1% Owner occupied79 86.9% Renter occupied
Language usage in Clarksdale
English speakers - Total 97.4% of residents of Clarksdale speak English at home.
1.7% of residents speak Spanish at home 5 2.1% Speak English very well229 97.9% Speak English less than very well0.6% of residents speak other language at home 51 68.0% Speak English very well24 32.0% Speak English less than very well
English speakers - Born in the United States 98.4% of residents of Clarksdale speak English at home.
1.7% of residents speak other language at home 27 100.0% Speak English very well
English speakers - Foreign-born 1.8% of residents of Clarksdale speak English at home.
85.7% of residents speak Spanish at home 240 100.0% Speak English less than very well10.0% of residents speak other language at home 11 39.3% Speak English very well17 60.7% Speak English less than very well
White (Caucasian) - Speak only English Native:
98.0% (2,072)Foreign-born:
47.2% (5)
White (Caucasian) - Speak another language Native:
1.8% (38)Foreign-born:
54.5% (6)
White alone - Speak only English Native:
97.6% (2,066)Foreign-born:
32.8% (5)
White alone - Speak another language Native:
2.5% (53)Foreign-born:
69.1% (12)
Foreign-born residents in Clarksdale 297 residents are foreign born (1.8% Latin America ).
This city:
2.0%Mississippi:
2.3%
Marital status for residents in Clarksdale Marital status - White (Caucasian) population 15 years and over
Males 32.1% Never married43.8% Now married1.7% Separated9.6% Widowed12.8% DivorcedFemales 14.9% Never married42.8% Now married4.7% Separated23.3% Widowed14.3% DivorcedWomen who gave birth in the past 12 months Now married:
100.0% (22)Unmarried:
0.0% (0)
Women who did not give birth in the past 12 months Now married:
62.9% (170)Unmarried:
37.1% (100)
Marital status - Black or African American population 15 years and over
Males 54.1% Never married26.8% Now married6.0% Separated3.3% Widowed9.7% DivorcedFemales 59.6% Never married15.2% Now married6.3% Separated10.1% Widowed8.8% DivorcedWomen who gave birth in the past 12 months Now married:
20.0% (40)Unmarried:
80.0% (159)
Women who did not give birth in the past 12 months Now married:
14.1% (382)Unmarried:
85.9% (2,321)
Marital status - Asian population 15 years and over
Males 0.0% Never married100.0% Now married0.0% Separated0.0% Widowed0.0% DivorcedFemales 57.1% Never married21.4% Now married0.0% Separated21.4% Widowed0.0% DivorcedWomen who did not give birth in the past 12 months Now married:
27.3% (5)Unmarried:
72.7% (14)
Marital status - Two or more races population 15 years and over
Males 74.2% Never married14.6% Now married0.0% Separated0.0% Widowed11.1% DivorcedFemales 8.3% Never married8.3% Now married0.0% Separated0.0% Widowed83.3% DivorcedWomen who did not give birth in the past 12 months Now married:
9.1% (2)Unmarried:
90.9% (17)
Marital status - White alone, not Hispanic / Latino population 15 years and over
Males 32.1% Never married43.8% Now married1.7% Separated9.6% Widowed12.8% DivorcedFemales 15.1% Never married42.3% Now married4.7% Separated23.4% Widowed14.5% DivorcedWomen who gave birth in the past 12 months Now married:
100.0% (23)Unmarried:
0.0% (0)
Women who did not give birth in the past 12 months Now married:
62.9% (172)Unmarried:
37.1% (101)
Marital status - Hispanic or Latino population 15 years and over
Males 81.0% Never married10.3% Now married0.0% Separated0.0% Widowed8.7% DivorcedFemales 0.0% Never married45.5% Now married0.0% Separated9.1% Widowed45.5% DivorcedWomen who did not give birth in the past 12 months Now married:
0.0% (0)Unmarried:
100.0% (11)
Ancestries in Clarksdale
565 4.5% English271 2.1% American210 1.7% Italian141 1.1% Irish97 0.8% Scottish76 0.6% African46 0.4% Lebanese46 0.4% Scotch-Irish39 0.3% Arab21 0.2% French15 0.1% European12 0.09% Iranian11 0.09% Norwegian9 0.07% German5 0.04% Jamaican3 0.02% Greek
Children Nativity (place of birth) in Clarksdale
Children under 6 years - Living with two parents Both parents native 82 100.0% NativeBoth parents foreign-born 6 100.0% NativeOne native, one foreign-born parent 9 100.0% NativeChildren under 6 years - Living with one parent Native parent 993 100.0% Native
Children 6 to 17 years - Living with two parents Both parents native 472 100.0% NativeBoth parents foreign-born 13 100.0% NativeOne native, one foreign-born parent 15 100.0% NativeChildren 6 to 17 years - Living with one parent Native parent 1,646 100.0% Native
Grandparents responsible for own grandchildren in Clarksdale
Grandparents (30 to 59 years) Black or African American 98 75.7% Responsible for grandchildren31 24.3% Not responsible for grandchildrenGrandparents (60 years and over) Black or African American 51 43.0% Responsible for grandchildren68 57.0% Not responsible for grandchildren