Races in Clarksburg, Maryland (MD) Detailed Stats
Data:
Races - White alone (%)
Races - White alone (% change since 2000)
Races - Black alone (%)
Races - Black alone (% change since 2000)
Races - American Indian alone (%)
Races - American Indian alone (% change since 2000)
Races - Asian alone (%)
Races - Asian alone (% change since 2000)
Races - Hispanic (%)
Races - Hispanic (% change since 2000)
Races - Native Hawaiian and Other Pacific Islander alone (%)
Races - Native Hawaiian and Other Pacific Islander alone (% change since 2000)
Races - Two or more races(%)
Races - Two or more races(% change since 2000)
Races - Other race alone (%)
Races - Other race alone (% change since 2000)
Racial diversity
Place of birth - Born in state of residence (%)
Place of birth - Born in state of residence (%) - White
Place of birth - Born in state of residence (%) - Black or African American
Place of birth - Born in state of residence (%) - Asian
Place of birth - Born in state of residence (%) - Hispanic or Latino
Place of birth - Born in state of residence (%) - American Indian and Alaska Native
Place of birth - Born in state of residence (%) - Multirace
Place of birth - Born in state of residence (%) - Other Race
Place of birth - Born in other state (%)
Place of birth - Born in other state (%) - White
Place of birth - Born in other state (%) - Black or African American
Place of birth - Born in other state (%) - Asian
Place of birth - Born in other state (%) - Hispanic or Latino
Place of birth - Born in other state (%) - American Indian and Alaska Native
Place of birth - Born in other state (%) - Multirace
Place of birth - Born in other state (%) - Other Race
Place of birth - Native, outside of US (%)
Place of birth - Native, outside of US (%) - White
Place of birth - Native, outside of US (%) - Black or African American
Place of birth - Native, outside of US (%) - Asian
Place of birth - Native, outside of US (%) - Hispanic or Latino
Place of birth - Native, outside of US (%) - American Indian and Alaska Native
Place of birth - Native, outside of US (%) - Multirace
Place of birth - Native, outside of US (%) - Other Race
Place of birth - Foreign born (%)
Place of birth - Foreign born (%) - White
Place of birth - Foreign born (%) - Black or African American
Place of birth - Foreign born (%) - Asian
Place of birth - Foreign born (%) - Hispanic or Latino
Place of birth - Foreign born (%) - American Indian and Alaska Native
Place of birth - Foreign born (%) - Multirace
Place of birth - Foreign born (%) - Other Race
Residents speaking English at home (%)
Residents speaking English at home - Born in the United States (%)
Residents speaking English at home - Native, born elsewhere (%)
Residents speaking English at home - Foreign born (%)
Residents speaking Spanish at home (%)
Residents speaking Spanish at home - Born in the United States (%)
Residents speaking Spanish at home - Native, born elsewhere (%)
Residents speaking Spanish at home - Foreign born (%)
Residents speaking other language at home (%)
Residents speaking other language at home - Born in the United States (%)
Residents speaking other language at home - Native, born elsewhere (%)
Residents speaking other language at home - Foreign born (%)
Marital status - Never married (%)
Marital status - Now married (%)
Marital status - Separated (%)
Marital status - Widowed (%)
Marital status - Divorced (%)
Ancestries Reported - Arab (%)
Ancestries Reported - Czech (%)
Ancestries Reported - Danish (%)
Ancestries Reported - Dutch (%)
Ancestries Reported - English (%)
Ancestries Reported - French (%)
Ancestries Reported - French Canadian (%)
Ancestries Reported - German (%)
Ancestries Reported - Greek (%)
Ancestries Reported - Hungarian (%)
Ancestries Reported - Irish (%)
Ancestries Reported - Italian (%)
Ancestries Reported - Lithuanian (%)
Ancestries Reported - Norwegian (%)
Ancestries Reported - Polish (%)
Ancestries Reported - Portuguese (%)
Ancestries Reported - Russian (%)
Ancestries Reported - Scotch-Irish (%)
Ancestries Reported - Scottish (%)
Ancestries Reported - Slovak (%)
Ancestries Reported - Subsaharan African (%)
Ancestries Reported - Swedish (%)
Ancestries Reported - Swiss (%)
Ancestries Reported - Ukrainian (%)
Ancestries Reported - United States (%)
Ancestries Reported - Welsh (%)
Ancestries Reported - West Indian (%)
Ancestries Reported - Other (%)
Geographical mobility - Same house 1 year ago (%)
Geographical mobility - Same house 1 year ago (%) - White
Geographical mobility - Same house 1 year ago (%) - Black or African American
Geographical mobility - Same house 1 year ago (%) - Asian
Geographical mobility - Same house 1 year ago (%) - Hispanic or Latino
Geographical mobility - Same house 1 year ago (%) - American Indian and Alaska Native
Geographical mobility - Same house 1 year ago (%) - Multirace
Geographical mobility - Same house 1 year ago (%) - Other Race
Geographical mobility - Moved within same county (%)
Geographical mobility - Moved within same county (%) - White
Geographical mobility - Moved within same county (%) - Black or African American
Geographical mobility - Moved within same county (%) - Asian
Geographical mobility - Moved within same county (%) - Hispanic or Latino
Geographical mobility - Moved within same county (%) - American Indian and Alaska Native
Geographical mobility - Moved within same county (%) - Multirace
Geographical mobility - Moved within same county (%) - Other Race
Geographical mobility - Moved from different county within same state (%)
Geographical mobility - Moved from different county within same state (%) - White
Geographical mobility - Moved from different county within same state (%) - Black or African American
Geographical mobility - Moved from different county within same state (%) - Asian
Geographical mobility - Moved from different county within same state (%) - Hispanic or Latino
Geographical mobility - Moved from different county within same state (%) - American Indian and Alaska Native
Geographical mobility - Moved from different county within same state (%) - Multirace
Geographical mobility - Moved from different county within same state (%) - Other Race
Geographical mobility - Moved from different state (%)
Geographical mobility - Moved from different state (%) - White
Geographical mobility - Moved from different state (%) - Black or African American
Geographical mobility - Moved from different state (%) - Asian
Geographical mobility - Moved from different state (%) - Hispanic or Latino
Geographical mobility - Moved from different state (%) - American Indian and Alaska Native
Geographical mobility - Moved from different state (%) - Multirace
Geographical mobility - Moved from different state (%) - Other Race
Geographical mobility - Moved from abroad (%)
Geographical mobility - Moved from abroad (%) - White
Geographical mobility - Moved from abroad (%) - Black or African American
Geographical mobility - Moved from abroad (%) - Asian
Geographical mobility - Moved from abroad (%) - Hispanic or Latino
Geographical mobility - Moved from abroad (%) - American Indian and Alaska Native
Geographical mobility - Moved from abroad (%) - Multirace
Geographical mobility - Moved from abroad (%) - Other Race
Place of birth for the foreign-born population - Ireland (%)
Place of birth for the foreign-born population - Denmark (%)
Place of birth for the foreign-born population - Norway (%)
Place of birth for the foreign-born population - Sweden (%)
Place of birth for the foreign-born population - United Kingdom (%)
Place of birth for the foreign-born population - England (%)
Place of birth for the foreign-born population - Scotland (%)
Place of birth for the foreign-born population - Other Northern Europe (%)
Place of birth for the foreign-born population - Austria (%)
Place of birth for the foreign-born population - Belgium (%)
Place of birth for the foreign-born population - France (%)
Place of birth for the foreign-born population - Germany (%)
Place of birth for the foreign-born population - Netherlands (%)
Place of birth for the foreign-born population - Switzerland (%)
Place of birth for the foreign-born population - Other Western Europe (%)
Place of birth for the foreign-born population - Greece (%)
Place of birth for the foreign-born population - Italy (%)
Place of birth for the foreign-born population - Portugal (%)
Place of birth for the foreign-born population - Spain (%)
Place of birth for the foreign-born population - Other Southern Europe (%)
Place of birth for the foreign-born population - Albania (%)
Place of birth for the foreign-born population - Belarus (%)
Place of birth for the foreign-born population - Bosnia and Herzegovina (%)
Place of birth for the foreign-born population - Bulgaria (%)
Place of birth for the foreign-born population - Croatia (%)
Place of birth for the foreign-born population - Czechoslovakia (%)
Place of birth for the foreign-born population - Hungary (%)
Place of birth for the foreign-born population - Latvia (%)
Place of birth for the foreign-born population - Lithuania (%)
Place of birth for the foreign-born population - North Macedonia (Macedonia) (%)
Place of birth for the foreign-born population - Moldova (%)
Place of birth for the foreign-born population - Poland (%)
Place of birth for the foreign-born population - Romania (%)
Place of birth for the foreign-born population - Russia (%)
Place of birth for the foreign-born population - Serbia (%)
Place of birth for the foreign-born population - Ukraine (%)
Place of birth for the foreign-born population - Other Eastern Europe (%)
Place of birth for the foreign-born population - China (%)
Place of birth for the foreign-born population - Hong Kong (%)
Place of birth for the foreign-born population - Taiwan (%)
Place of birth for the foreign-born population - Japan (%)
Place of birth for the foreign-born population - Korea (%)
Place of birth for the foreign-born population - Other Eastern Asia (%)
Place of birth for the foreign-born population - Afghanistan (%)
Place of birth for the foreign-born population - Bangladesh (%)
Place of birth for the foreign-born population - India (%)
Place of birth for the foreign-born population - Iran (%)
Place of birth for the foreign-born population - Kazakhstan (%)
Place of birth for the foreign-born population - Nepal (%)
Place of birth for the foreign-born population - Pakistan (%)
Place of birth for the foreign-born population - Sri Lanka (%)
Place of birth for the foreign-born population - Uzbekistan (%)
Place of birth for the foreign-born population - Other South Central Asia (%)
Place of birth for the foreign-born population - Burma (%)
Place of birth for the foreign-born population - Cambodia (%)
Place of birth for the foreign-born population - Indonesia (%)
Place of birth for the foreign-born population - Laos (%)
Place of birth for the foreign-born population - Malaysia (%)
Place of birth for the foreign-born population - Philippines (%)
Place of birth for the foreign-born population - Singapore (%)
Place of birth for the foreign-born population - Thailand (%)
Place of birth for the foreign-born population - Vietnam (%)
Place of birth for the foreign-born population - Other South Eastern Asia (%)
Place of birth for the foreign-born population - Armenia (%)
Place of birth for the foreign-born population - Iraq (%)
Place of birth for the foreign-born population - Israel (%)
Place of birth for the foreign-born population - Jordan (%)
Place of birth for the foreign-born population - Kuwait (%)
Place of birth for the foreign-born population - Lebanon (%)
Place of birth for the foreign-born population - Saudi Arabia (%)
Place of birth for the foreign-born population - Syria (%)
Place of birth for the foreign-born population - Turkey (%)
Place of birth for the foreign-born population - Yemen (%)
Place of birth for the foreign-born population - Other Western Asia (%)
Place of birth for the foreign-born population - Eritrea (%)
Place of birth for the foreign-born population - Ethiopia (%)
Place of birth for the foreign-born population - Kenya (%)
Place of birth for the foreign-born population - Somalia (%)
Place of birth for the foreign-born population - Uganda (%)
Place of birth for the foreign-born population - Zimbabwe (%)
Place of birth for the foreign-born population - Other Eastern Africa (%)
Place of birth for the foreign-born population - Cameroon (%)
Place of birth for the foreign-born population - Congo (%)
Place of birth for the foreign-born population - Democratic Republic of Congo (Zaire) (%)
Place of birth for the foreign-born population - Other Middle Africa (%)
Place of birth for the foreign-born population - Egypt (%)
Place of birth for the foreign-born population - Morocco (%)
Place of birth for the foreign-born population - Sudan (%)
Place of birth for the foreign-born population - Other Northern Africa (%)
Place of birth for the foreign-born population - South Africa (%)
Place of birth for the foreign-born population - Other Southern Africa (%)
Place of birth for the foreign-born population - Cabo Verde (%)
Place of birth for the foreign-born population - Ghana (%)
Place of birth for the foreign-born population - Liberia (%)
Place of birth for the foreign-born population - Nigeria (%)
Place of birth for the foreign-born population - Senegal (%)
Place of birth for the foreign-born population - Sierra Leone (%)
Place of birth for the foreign-born population - Other Western Africa (%)
Place of birth for the foreign-born population - Australia (%)
Place of birth for the foreign-born population - New Zealand (%)
Place of birth for the foreign-born population - Fiji (%)
Place of birth for the foreign-born population - Micronesia (%)
Place of birth for the foreign-born population - Bahamas (%)
Place of birth for the foreign-born population - Barbados (%)
Place of birth for the foreign-born population - Cuba (%)
Place of birth for the foreign-born population - Dominica (%)
Place of birth for the foreign-born population - Dominican Republic (%)
Place of birth for the foreign-born population - Grenada (%)
Place of birth for the foreign-born population - Haiti (%)
Place of birth for the foreign-born population - Jamaica (%)
Place of birth for the foreign-born population - St. Vincent and the Grenadines (%)
Place of birth for the foreign-born population - Trinidad and Tobago (%)
Place of birth for the foreign-born population - West Indies (%)
Place of birth for the foreign-born population - Other Caribbean (%)
Place of birth for the foreign-born population - Belize (%)
Place of birth for the foreign-born population - Costa Rica (%)
Place of birth for the foreign-born population - El Salvador (%)
Place of birth for the foreign-born population - Guatemala (%)
Place of birth for the foreign-born population - Honduras (%)
Place of birth for the foreign-born population - Mexico (%)
Place of birth for the foreign-born population - Nicaragua (%)
Place of birth for the foreign-born population - Panama (%)
Place of birth for the foreign-born population - Other Central America (%)
Place of birth for the foreign-born population - Argentina (%)
Place of birth for the foreign-born population - Bolivia (%)
Place of birth for the foreign-born population - Brazil (%)
Place of birth for the foreign-born population - Chile (%)
Place of birth for the foreign-born population - Colombia (%)
Place of birth for the foreign-born population - Ecuador (%)
Place of birth for the foreign-born population - Guyana (%)
Place of birth for the foreign-born population - Peru (%)
Place of birth for the foreign-born population - Uruguay (%)
Place of birth for the foreign-born population - Venezuela (%)
Place of birth for the foreign-born population - Other South America (%)
Place of birth for the foreign-born population - Canada (%)
Place of birth for the foreign-born population - Other Northern America (%)
Place of birth for the foreign-born population - Other (%)
Latest news about races in Clarksburg, MD collected exclusively by city-data.com from local newspapers, TV, and radio stations
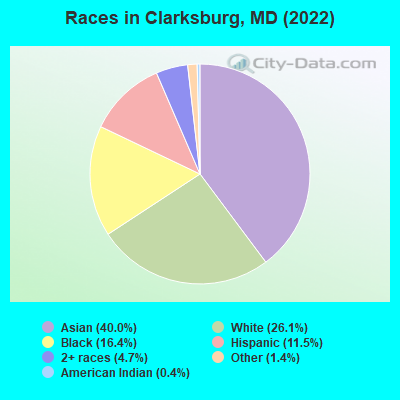
According to 2022 data, the most numerous races in Clarksburg, MD are White alone (7,355 residents), Black alone (4,639 residents), and Hispanic (3,244 residents). 51.9% of Clarksburg residents speak English at home. 38.8% of Clarksburg, MD residents are foreign-born (26.1% born in Asia, 6.6% born in Latin America), which is 58.7% greater than the foreign-born rate of 16.0% across the entire state of Maryland.
Race distribution in Clarksburg
2000 2022
3,286,547 62.1% White alone 1,464,735 27.7% Black alone 227,916 4.3% Hispanic 209,738 4.0% Asian alone 82,946 1.6% Two or more races 13,312 0.3% American Indian alone 9,379 0.2% Other race alone 1,913 0.04% Native Hawaiian and Other
2,906,492 47.1% White alone 1,800,914 29.2% Black alone 705,842 11.4% Hispanic 401,818 6.5% Asian alone 291,317 4.7% Two or more races 46,930 0.8% Other race alone 8,930 0.1% American Indian alone 2,417 0.04% Native Hawaiian and Other
Income and house value in Clarksburg Median household income in 2022 $175,426 White non-Hispanic householders$112,100 Black householders$188,134 Asian householders$119,305 Some other race householders$75,719 Two or more races householders$77,067 Hispanic or Latino race householdersMedian 2022 house value $620,715 White Non-Hispanic householders$423,214 Black or African American householders $507,857 Asian householders$728,380 Some other race householders$756,143 Hispanic or Latino householders
Median age by race in Clarksburg
40.1 Median age for White residents39.9 39.8 38.1 Median age for Black or African American residents27.7 42.0 7.1 Median age for American Indian / Alaska Native residents6.2 17.7 40.6 Median age for Asian residents38.9 41.3 -763,333,332.6 Median age for Native Hawaiian / Pacific Islander residents-720,061,021.4 -760,942,760.2 30.9 Median age for Other race residents16.3 40.1 18.7 Median age for Two or more races residents15.9 19.9 39.7 Median age for White alone residents40.4 39.4 31.6 Median age for Hispanic or Latino residents17.9 39.6
Owner/renter occupied households by race in Clarksburg
House owners and renters - White residents 2,657 91.1% Owner occupied259 8.9% Renter occupiedHouse owners and renters - Black or African American residents 1,154 71.8% Owner occupied454 28.2% Renter occupiedHouse owners and renters - American Indian / Alaska Native residents 39 100.0% Owner occupiedHouse owners and renters - Asian residents 3,432 97.4% Owner occupied93 2.6% Renter occupiedHouse owners and renters - Native Hawaiian / Pacific Islander residents 20 100.0% Owner occupiedHouse owners and renters - Other race residents 419 85.2% Owner occupied73 14.8% Renter occupiedHouse owners and renters - Two or more races residents 413 77.5% Owner occupied120 22.5% Renter occupiedHouse owners and renters - White alone residents 2,665 91.0% Owner occupied265 9.0% Renter occupiedHouse owners and renters - Hispanic or Latino residents 698 84.8% Owner occupied125 15.2% Renter occupied
Language usage in Clarksburg
English speakers - Total 51.9% of residents of Clarksburg speak English at home.
8.2% of residents speak Spanish at home 1,559 72.7% Speak English very well585 27.3% Speak English less than very well40.4% of residents speak other language at home 7,177 68.4% Speak English very well3,319 31.6% Speak English less than very well
English speakers - Born in the United States 85.1% of residents of Clarksburg speak English at home.
5.2% of residents speak Spanish at home 349 95.1% Speak English very well18 4.9% Speak English less than very well10.2% of residents speak other language at home 683 94.2% Speak English very well42 5.8% Speak English less than very well
English speakers - Native, born elsewhere 72.5% of residents of Clarksburg speak English at home.
16.1% of residents speak Spanish at home 66 100.0% Speak English very well10.2% of residents speak other language at home 42 100.0% Speak English less than very well
English speakers - Foreign-born 11.0% of residents of Clarksburg speak English at home.
12.8% of residents speak Spanish at home 815 58.8% Speak English very well571 41.2% Speak English less than very well76.0% of residents speak other language at home 5,287 64.1% Speak English very well2,963 35.9% Speak English less than very well
White (Caucasian) - Speak only English Native:
98.2% (6,234)Foreign-born:
8.5% (68)
White (Caucasian) - Speak another language Native:
3.3% (212)Foreign-born:
88.5% (704)
Black or African American - Speak only English Native:
91.5% (3,032)Foreign-born:
21.1% (211)
Black or African American - Speak another language Native:
8.0% (265)Foreign-born:
79.0% (787)
Asian - Speak only English Native:
46.5% (1,528)Foreign-born:
9.9% (732)
Asian - Speak another language Native:
53.5% (1,758)Foreign-born:
89.9% (6,651)
Other race - Speak only English Native:
60.0% (350)Foreign-born:
1.9% (15)
Other race - Speak another language Native:
49.4% (288)Foreign-born:
98.5% (778)
Two or more races - Speak only English Native:
64.3% (1,132)Foreign-born:
40.2% (277)
Two or more races - Speak another language Native:
35.8% (630)Foreign-born:
62.2% (428)
White alone - Speak only English Native:
96.4% (6,105)Foreign-born:
10.9% (55)
White alone - Speak another language Native:
3.8% (240)Foreign-born:
90.3% (449)
Hispanic or Latino - Speak only English Native:
47.2% (549)Foreign-born:
12.6% (208)
Hispanic or Latino - Speak another language Native:
54.4% (634)Foreign-born:
86.7% (1,439)
Foreign-born residents in Clarksburg 10,938 residents are foreign born (26.1% Asia , 6.6% Latin America ).
This city:
38.8%Maryland:
15.7%
Marital status for residents in Clarksburg Marital status - White (Caucasian) population 15 years and over
Males 25.3% Never married67.1% Now married0.7% Separated0.8% Widowed6.1% DivorcedFemales 17.6% Never married67.0% Now married0.4% Separated2.7% Widowed12.3% DivorcedWomen who gave birth in the past 12 months Now married:
64.7% (126)Unmarried:
35.3% (69)
Women who did not give birth in the past 12 months Now married:
63.1% (1,030)Unmarried:
36.9% (601)
Marital status - Black or African American population 15 years and over
Males 36.0% Never married60.8% Now married0.0% Separated0.0% Widowed3.3% DivorcedFemales 31.7% Never married45.5% Now married5.0% Separated8.0% Widowed9.7% DivorcedWomen who gave birth in the past 12 months Now married:
100.0% (103)Unmarried:
0.0% (0)
Women who did not give birth in the past 12 months Now married:
45.4% (466)Unmarried:
54.6% (561)
Marital status - American Indian / Alaska Native population 15 years and over
Males 0.0% Never married0.0% Now married0.0% Separated0.0% Widowed100.0% DivorcedFemales 52.4% Never married47.6% Now married0.0% Separated0.0% Widowed0.0% DivorcedWomen who did not give birth in the past 12 months Now married:
24.1% (10)Unmarried:
75.9% (33)
Marital status - Asian population 15 years and over
Males 19.8% Never married77.7% Now married1.1% Separated0.4% Widowed1.0% DivorcedFemales 17.2% Never married67.0% Now married0.8% Separated9.2% Widowed5.8% DivorcedWomen who gave birth in the past 12 months Now married:
100.0% (110)Unmarried:
0.0% (0)
Women who did not give birth in the past 12 months Now married:
68.8% (1,883)Unmarried:
31.3% (856)
Marital status - Other race population 15 years and over
Males 39.2% Never married60.8% Now married0.0% Separated0.0% Widowed0.0% DivorcedFemales 30.4% Never married37.5% Now married0.0% Separated22.0% Widowed10.1% DivorcedWomen who gave birth in the past 12 months Now married:
100.0% (58)Unmarried:
0.0% (0)
Women who did not give birth in the past 12 months Now married:
39.1% (183)Unmarried:
60.9% (284)
Marital status - Two or more races population 15 years and over
Males 47.0% Never married37.0% Now married1.9% Separated3.6% Widowed10.4% DivorcedFemales 16.7% Never married39.1% Now married0.0% Separated0.0% Widowed44.2% DivorcedWomen who gave birth in the past 12 months Now married:
100.0% (19)Unmarried:
0.0% (0)
Women who did not give birth in the past 12 months Now married:
49.7% (185)Unmarried:
50.3% (188)
Marital status - White alone, not Hispanic / Latino population 15 years and over
Males 24.2% Never married71.0% Now married0.8% Separated0.9% Widowed3.1% DivorcedFemales 19.1% Never married68.3% Now married0.5% Separated2.6% Widowed9.6% DivorcedWomen who gave birth in the past 12 months Now married:
86.3% (137)Unmarried:
13.7% (22)
Women who did not give birth in the past 12 months Now married:
59.5% (934)Unmarried:
40.5% (635)
Marital status - Hispanic or Latino population 15 years and over
Males 43.2% Never married43.8% Now married1.0% Separated0.0% Widowed12.0% DivorcedFemales 17.7% Never married38.5% Now married0.0% Separated10.5% Widowed33.2% DivorcedWomen who gave birth in the past 12 months Now married:
30.0% (24)Unmarried:
70.0% (56)
Women who did not give birth in the past 12 months Now married:
55.5% (388)Unmarried:
44.5% (311)
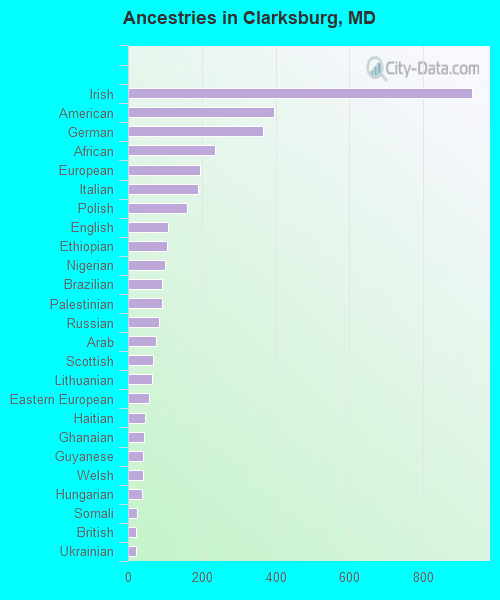
Ancestries in Clarksburg
932 5.0% Irish395 2.1% American367 2.0% German236 1.3% African194 1.0% European191 1.0% Italian161 0.9% Polish109 0.6% English107 0.6% Ethiopian99 0.5% Nigerian93 0.5% Brazilian92 0.5% Palestinian84 0.5% Russian77 0.4% Arab68 0.4% Scottish66 0.4% Lithuanian56 0.3% Eastern European47 0.3% Haitian43 0.2% Ghanaian40 0.2% Guyanese40 0.2% Welsh37 0.2% Hungarian24 0.1% Somali22 0.1% British22 0.1% Ukrainian21 0.1% Estonian19 0.1% Iranian19 0.1% Northern European16 0.09% Belgian10 0.05% Canadian10 0.05% Bulgarian8 0.04% Norwegian6 0.03% Israeli5 0.03% Czechoslovakian2 0.01% Serbian
Geographical mobility in Clarksburg Same house 1 year ago 7,342 95.8% White (Caucasian)3,868 84.5% Black or African American186 98.9% American Indian / Alaska Native10,279 91.2% Asian20 100.0% Native Hawaiian / Pacific Islander1,388 85.6% Other race2,574 99.5% Two or more races6,936 95.4% White alone, not Hispanic / Latino3,075 96.6% Hispanic or LatinoMoved within same county 211 2.7% White / Caucasian331 7.2% Black or African American643 5.7% Asian172 10.6% Other race24 0.9% Two or more races193 2.6% White alone, not Hispanic / Latino90 2.8% Hispanic or LatinoMoved within same state 22 0.3% White / Caucasian205 4.5% Black or African American42 0.4% Asian46 2.8% Other race39 1.5% Two or more races24 0.3% White alone, not Hispanic / Latino53 1.7% Hispanic or LatinoMoved from different state 163 2.1% White / Caucasian52 1.1% Black or African American27 0.2% Asian26 1.6% Other race15 0.6% Two or more races171 2.4% White alone, not Hispanic / Latino15 0.5% Hispanic or LatinoMoved from abroad 5 0.1% White54 1.2% Black or African American226 2.0% Asian6 0.1% White alone, not Hispanic / Latino
Children Nativity (place of birth) in Clarksburg
Children under 6 years - Living with two parents Both parents native 687 100.0% NativeBoth parents foreign-born 798 91.7% Native72 8.3% Foreign-bornOne native, one foreign-born parent 469 100.0% NativeChildren under 6 years - Living with one parent Native parent 377 100.0% NativeForeign-born parent 152 100.0% NativeChildren 6 to 17 years - Living with two parents Both parents native 1,985 100.0% NativeBoth parents foreign-born 1,958 88.5% Native254 11.5% Foreign-bornOne native, one foreign-born parent 320 97.5% Native8 2.5% Foreign-bornChildren 6 to 17 years - Living with one parent Native parent 530 100.0% NativeForeign-born parent 396 58.3% Native283 41.7% Foreign-born
Grandparents responsible for own grandchildren in Clarksburg
Grandparents (30 to 59 years) White / Caucasian 90 89.8% Responsible for grandchildren10 10.2% Not responsible for grandchildrenBlack or African American 45 47.9% Responsible for grandchildren49 52.1% Not responsible for grandchildrenAsian 15 27.4% Responsible for grandchildren40 72.6% Not responsible for grandchildrenWhite alone, not Hispanic / Latino 51 74.3% Responsible for grandchildren18 25.7% Not responsible for grandchildrenHispanic or Latino 143 100.0% Responsible for grandchildrenGrandparents (60 years and over) White / Caucasian 14 38.9% Responsible for grandchildren22 61.1% Not responsible for grandchildrenBlack or African American 65 100.0% Not responsible for grandchildrenAsian 28 4.8% Responsible for grandchildren560 95.2% Not responsible for grandchildrenWhite alone, not Hispanic / Latino 11 29.4% Responsible for grandchildren27 70.6% Not responsible for grandchildren