Races in Cicero, Illinois (IL) Detailed Stats
Data:
Races - White alone (%)
Races - White alone (% change since 2000)
Races - Black alone (%)
Races - Black alone (% change since 2000)
Races - American Indian alone (%)
Races - American Indian alone (% change since 2000)
Races - Asian alone (%)
Races - Asian alone (% change since 2000)
Races - Hispanic (%)
Races - Hispanic (% change since 2000)
Races - Native Hawaiian and Other Pacific Islander alone (%)
Races - Native Hawaiian and Other Pacific Islander alone (% change since 2000)
Races - Two or more races(%)
Races - Two or more races(% change since 2000)
Races - Other race alone (%)
Races - Other race alone (% change since 2000)
Racial diversity
Place of birth - Born in state of residence (%)
Place of birth - Born in state of residence (%) - White
Place of birth - Born in state of residence (%) - Black or African American
Place of birth - Born in state of residence (%) - Asian
Place of birth - Born in state of residence (%) - Hispanic or Latino
Place of birth - Born in state of residence (%) - American Indian and Alaska Native
Place of birth - Born in state of residence (%) - Multirace
Place of birth - Born in state of residence (%) - Other Race
Place of birth - Born in other state (%)
Place of birth - Born in other state (%) - White
Place of birth - Born in other state (%) - Black or African American
Place of birth - Born in other state (%) - Asian
Place of birth - Born in other state (%) - Hispanic or Latino
Place of birth - Born in other state (%) - American Indian and Alaska Native
Place of birth - Born in other state (%) - Multirace
Place of birth - Born in other state (%) - Other Race
Place of birth - Native, outside of US (%)
Place of birth - Native, outside of US (%) - White
Place of birth - Native, outside of US (%) - Black or African American
Place of birth - Native, outside of US (%) - Asian
Place of birth - Native, outside of US (%) - Hispanic or Latino
Place of birth - Native, outside of US (%) - American Indian and Alaska Native
Place of birth - Native, outside of US (%) - Multirace
Place of birth - Native, outside of US (%) - Other Race
Place of birth - Foreign born (%)
Place of birth - Foreign born (%) - White
Place of birth - Foreign born (%) - Black or African American
Place of birth - Foreign born (%) - Asian
Place of birth - Foreign born (%) - Hispanic or Latino
Place of birth - Foreign born (%) - American Indian and Alaska Native
Place of birth - Foreign born (%) - Multirace
Place of birth - Foreign born (%) - Other Race
Residents speaking English at home (%)
Residents speaking English at home - Born in the United States (%)
Residents speaking English at home - Native, born elsewhere (%)
Residents speaking English at home - Foreign born (%)
Residents speaking Spanish at home (%)
Residents speaking Spanish at home - Born in the United States (%)
Residents speaking Spanish at home - Native, born elsewhere (%)
Residents speaking Spanish at home - Foreign born (%)
Residents speaking other language at home (%)
Residents speaking other language at home - Born in the United States (%)
Residents speaking other language at home - Native, born elsewhere (%)
Residents speaking other language at home - Foreign born (%)
Marital status - Never married (%)
Marital status - Now married (%)
Marital status - Separated (%)
Marital status - Widowed (%)
Marital status - Divorced (%)
Ancestries Reported - Arab (%)
Ancestries Reported - Czech (%)
Ancestries Reported - Danish (%)
Ancestries Reported - Dutch (%)
Ancestries Reported - English (%)
Ancestries Reported - French (%)
Ancestries Reported - French Canadian (%)
Ancestries Reported - German (%)
Ancestries Reported - Greek (%)
Ancestries Reported - Hungarian (%)
Ancestries Reported - Irish (%)
Ancestries Reported - Italian (%)
Ancestries Reported - Lithuanian (%)
Ancestries Reported - Norwegian (%)
Ancestries Reported - Polish (%)
Ancestries Reported - Portuguese (%)
Ancestries Reported - Russian (%)
Ancestries Reported - Scotch-Irish (%)
Ancestries Reported - Scottish (%)
Ancestries Reported - Slovak (%)
Ancestries Reported - Subsaharan African (%)
Ancestries Reported - Swedish (%)
Ancestries Reported - Swiss (%)
Ancestries Reported - Ukrainian (%)
Ancestries Reported - United States (%)
Ancestries Reported - Welsh (%)
Ancestries Reported - West Indian (%)
Ancestries Reported - Other (%)
Geographical mobility - Same house 1 year ago (%)
Geographical mobility - Same house 1 year ago (%) - White
Geographical mobility - Same house 1 year ago (%) - Black or African American
Geographical mobility - Same house 1 year ago (%) - Asian
Geographical mobility - Same house 1 year ago (%) - Hispanic or Latino
Geographical mobility - Same house 1 year ago (%) - American Indian and Alaska Native
Geographical mobility - Same house 1 year ago (%) - Multirace
Geographical mobility - Same house 1 year ago (%) - Other Race
Geographical mobility - Moved within same county (%)
Geographical mobility - Moved within same county (%) - White
Geographical mobility - Moved within same county (%) - Black or African American
Geographical mobility - Moved within same county (%) - Asian
Geographical mobility - Moved within same county (%) - Hispanic or Latino
Geographical mobility - Moved within same county (%) - American Indian and Alaska Native
Geographical mobility - Moved within same county (%) - Multirace
Geographical mobility - Moved within same county (%) - Other Race
Geographical mobility - Moved from different county within same state (%)
Geographical mobility - Moved from different county within same state (%) - White
Geographical mobility - Moved from different county within same state (%) - Black or African American
Geographical mobility - Moved from different county within same state (%) - Asian
Geographical mobility - Moved from different county within same state (%) - Hispanic or Latino
Geographical mobility - Moved from different county within same state (%) - American Indian and Alaska Native
Geographical mobility - Moved from different county within same state (%) - Multirace
Geographical mobility - Moved from different county within same state (%) - Other Race
Geographical mobility - Moved from different state (%)
Geographical mobility - Moved from different state (%) - White
Geographical mobility - Moved from different state (%) - Black or African American
Geographical mobility - Moved from different state (%) - Asian
Geographical mobility - Moved from different state (%) - Hispanic or Latino
Geographical mobility - Moved from different state (%) - American Indian and Alaska Native
Geographical mobility - Moved from different state (%) - Multirace
Geographical mobility - Moved from different state (%) - Other Race
Geographical mobility - Moved from abroad (%)
Geographical mobility - Moved from abroad (%) - White
Geographical mobility - Moved from abroad (%) - Black or African American
Geographical mobility - Moved from abroad (%) - Asian
Geographical mobility - Moved from abroad (%) - Hispanic or Latino
Geographical mobility - Moved from abroad (%) - American Indian and Alaska Native
Geographical mobility - Moved from abroad (%) - Multirace
Geographical mobility - Moved from abroad (%) - Other Race
Place of birth for the foreign-born population - Ireland (%)
Place of birth for the foreign-born population - Denmark (%)
Place of birth for the foreign-born population - Norway (%)
Place of birth for the foreign-born population - Sweden (%)
Place of birth for the foreign-born population - United Kingdom (%)
Place of birth for the foreign-born population - England (%)
Place of birth for the foreign-born population - Scotland (%)
Place of birth for the foreign-born population - Other Northern Europe (%)
Place of birth for the foreign-born population - Austria (%)
Place of birth for the foreign-born population - Belgium (%)
Place of birth for the foreign-born population - France (%)
Place of birth for the foreign-born population - Germany (%)
Place of birth for the foreign-born population - Netherlands (%)
Place of birth for the foreign-born population - Switzerland (%)
Place of birth for the foreign-born population - Other Western Europe (%)
Place of birth for the foreign-born population - Greece (%)
Place of birth for the foreign-born population - Italy (%)
Place of birth for the foreign-born population - Portugal (%)
Place of birth for the foreign-born population - Spain (%)
Place of birth for the foreign-born population - Other Southern Europe (%)
Place of birth for the foreign-born population - Albania (%)
Place of birth for the foreign-born population - Belarus (%)
Place of birth for the foreign-born population - Bosnia and Herzegovina (%)
Place of birth for the foreign-born population - Bulgaria (%)
Place of birth for the foreign-born population - Croatia (%)
Place of birth for the foreign-born population - Czechoslovakia (%)
Place of birth for the foreign-born population - Hungary (%)
Place of birth for the foreign-born population - Latvia (%)
Place of birth for the foreign-born population - Lithuania (%)
Place of birth for the foreign-born population - North Macedonia (Macedonia) (%)
Place of birth for the foreign-born population - Moldova (%)
Place of birth for the foreign-born population - Poland (%)
Place of birth for the foreign-born population - Romania (%)
Place of birth for the foreign-born population - Russia (%)
Place of birth for the foreign-born population - Serbia (%)
Place of birth for the foreign-born population - Ukraine (%)
Place of birth for the foreign-born population - Other Eastern Europe (%)
Place of birth for the foreign-born population - China (%)
Place of birth for the foreign-born population - Hong Kong (%)
Place of birth for the foreign-born population - Taiwan (%)
Place of birth for the foreign-born population - Japan (%)
Place of birth for the foreign-born population - Korea (%)
Place of birth for the foreign-born population - Other Eastern Asia (%)
Place of birth for the foreign-born population - Afghanistan (%)
Place of birth for the foreign-born population - Bangladesh (%)
Place of birth for the foreign-born population - India (%)
Place of birth for the foreign-born population - Iran (%)
Place of birth for the foreign-born population - Kazakhstan (%)
Place of birth for the foreign-born population - Nepal (%)
Place of birth for the foreign-born population - Pakistan (%)
Place of birth for the foreign-born population - Sri Lanka (%)
Place of birth for the foreign-born population - Uzbekistan (%)
Place of birth for the foreign-born population - Other South Central Asia (%)
Place of birth for the foreign-born population - Burma (%)
Place of birth for the foreign-born population - Cambodia (%)
Place of birth for the foreign-born population - Indonesia (%)
Place of birth for the foreign-born population - Laos (%)
Place of birth for the foreign-born population - Malaysia (%)
Place of birth for the foreign-born population - Philippines (%)
Place of birth for the foreign-born population - Singapore (%)
Place of birth for the foreign-born population - Thailand (%)
Place of birth for the foreign-born population - Vietnam (%)
Place of birth for the foreign-born population - Other South Eastern Asia (%)
Place of birth for the foreign-born population - Armenia (%)
Place of birth for the foreign-born population - Iraq (%)
Place of birth for the foreign-born population - Israel (%)
Place of birth for the foreign-born population - Jordan (%)
Place of birth for the foreign-born population - Kuwait (%)
Place of birth for the foreign-born population - Lebanon (%)
Place of birth for the foreign-born population - Saudi Arabia (%)
Place of birth for the foreign-born population - Syria (%)
Place of birth for the foreign-born population - Turkey (%)
Place of birth for the foreign-born population - Yemen (%)
Place of birth for the foreign-born population - Other Western Asia (%)
Place of birth for the foreign-born population - Eritrea (%)
Place of birth for the foreign-born population - Ethiopia (%)
Place of birth for the foreign-born population - Kenya (%)
Place of birth for the foreign-born population - Somalia (%)
Place of birth for the foreign-born population - Uganda (%)
Place of birth for the foreign-born population - Zimbabwe (%)
Place of birth for the foreign-born population - Other Eastern Africa (%)
Place of birth for the foreign-born population - Cameroon (%)
Place of birth for the foreign-born population - Congo (%)
Place of birth for the foreign-born population - Democratic Republic of Congo (Zaire) (%)
Place of birth for the foreign-born population - Other Middle Africa (%)
Place of birth for the foreign-born population - Egypt (%)
Place of birth for the foreign-born population - Morocco (%)
Place of birth for the foreign-born population - Sudan (%)
Place of birth for the foreign-born population - Other Northern Africa (%)
Place of birth for the foreign-born population - South Africa (%)
Place of birth for the foreign-born population - Other Southern Africa (%)
Place of birth for the foreign-born population - Cabo Verde (%)
Place of birth for the foreign-born population - Ghana (%)
Place of birth for the foreign-born population - Liberia (%)
Place of birth for the foreign-born population - Nigeria (%)
Place of birth for the foreign-born population - Senegal (%)
Place of birth for the foreign-born population - Sierra Leone (%)
Place of birth for the foreign-born population - Other Western Africa (%)
Place of birth for the foreign-born population - Australia (%)
Place of birth for the foreign-born population - New Zealand (%)
Place of birth for the foreign-born population - Fiji (%)
Place of birth for the foreign-born population - Micronesia (%)
Place of birth for the foreign-born population - Bahamas (%)
Place of birth for the foreign-born population - Barbados (%)
Place of birth for the foreign-born population - Cuba (%)
Place of birth for the foreign-born population - Dominica (%)
Place of birth for the foreign-born population - Dominican Republic (%)
Place of birth for the foreign-born population - Grenada (%)
Place of birth for the foreign-born population - Haiti (%)
Place of birth for the foreign-born population - Jamaica (%)
Place of birth for the foreign-born population - St. Vincent and the Grenadines (%)
Place of birth for the foreign-born population - Trinidad and Tobago (%)
Place of birth for the foreign-born population - West Indies (%)
Place of birth for the foreign-born population - Other Caribbean (%)
Place of birth for the foreign-born population - Belize (%)
Place of birth for the foreign-born population - Costa Rica (%)
Place of birth for the foreign-born population - El Salvador (%)
Place of birth for the foreign-born population - Guatemala (%)
Place of birth for the foreign-born population - Honduras (%)
Place of birth for the foreign-born population - Mexico (%)
Place of birth for the foreign-born population - Nicaragua (%)
Place of birth for the foreign-born population - Panama (%)
Place of birth for the foreign-born population - Other Central America (%)
Place of birth for the foreign-born population - Argentina (%)
Place of birth for the foreign-born population - Bolivia (%)
Place of birth for the foreign-born population - Brazil (%)
Place of birth for the foreign-born population - Chile (%)
Place of birth for the foreign-born population - Colombia (%)
Place of birth for the foreign-born population - Ecuador (%)
Place of birth for the foreign-born population - Guyana (%)
Place of birth for the foreign-born population - Peru (%)
Place of birth for the foreign-born population - Uruguay (%)
Place of birth for the foreign-born population - Venezuela (%)
Place of birth for the foreign-born population - Other South America (%)
Place of birth for the foreign-born population - Canada (%)
Place of birth for the foreign-born population - Other Northern America (%)
Place of birth for the foreign-born population - Other (%)
Latest news about races in Cicero, IL collected exclusively by city-data.com from local newspapers, TV, and radio stations
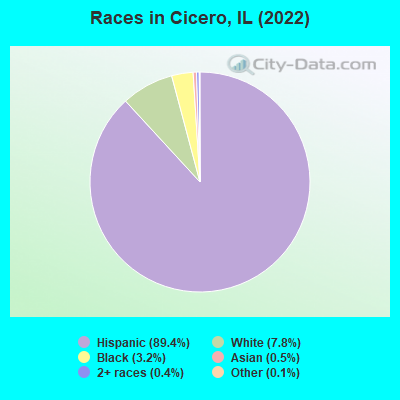
According to 2022 data, the most numerous races in Cicero, IL are White alone (6,421 residents), Hispanic (73,605 residents), and Black alone (2,603 residents). 18.3% of Cicero residents speak English at home. 39.3% of Cicero, IL residents are foreign-born (37.5% born in Latin America), which is 64.4% greater than the foreign-born rate of 14.0% across the entire state of Illinois.
Race distribution in Cicero
2000 2022
8,424,140 67.8% White alone 1,856,152 14.9% Black alone 1,530,262 12.3% Hispanic 419,916 3.4% Asian alone 153,996 1.2% Two or more races 13,479 0.1% Other race alone 18,232 0.1% American Indian alone 3,116 0.03% Native Hawaiian and Other
7,356,301 58.5% White alone 2,299,726 18.3% Hispanic 1,660,423 13.2% Black alone 747,296 5.9% Asian alone 458,599 3.6% Two or more races 45,386 0.4% Other race alone 10,405 0.08% American Indian alone 3,896 0.03% Native Hawaiian and Other
Income and house value in Cicero Median household income in 2022 $70,811 White non-Hispanic householders$53,242 Black householders$88,848 American Indian and Alaska Native householders$101,476 Asian householders$72,330 Some other race householders$53,729 Two or more races householders$67,199 Hispanic or Latino race householdersMedian 2022 house value $206,158 White Non-Hispanic householders$348,805 Black or African American householders$277,583 American Indian or Alaska Native householders $262,973 Asian householders$241,870 Some other race householders$259,321 Two or more races householders$239,030 Hispanic or Latino householders
Median age by race in Cicero
37.4 Median age for White residents33.1 45.6 29.7 Median age for Black or African American residents34.3 29.4 42.5 Median age for American Indian / Alaska Native residents45.1 35.6 57.5 Median age for Asian residents47.5 57.9 -666,666,666.0 Median age for Native Hawaiian / Pacific Islander residents-666,666,666.0 -666,666,666.0 33.2 Median age for Other race residents35.4 32.3 30.7 Median age for Two or more races residents32.6 30.3 61.5 Median age for White alone residents57.5 61.8 32.5 Median age for Hispanic or Latino residents33.5 31.1
Owner/renter occupied households by race in Cicero
House owners and renters - White residents 3,108 66.9% Owner occupied1,538 33.1% Renter occupiedHouse owners and renters - Black or African American residents 179 15.8% Owner occupied950 84.2% Renter occupiedHouse owners and renters - American Indian / Alaska Native residents 273 63.5% Owner occupied157 36.5% Renter occupiedHouse owners and renters - Asian residents 66 40.8% Owner occupied96 59.2% Renter occupiedHouse owners and renters - Other race residents 9,475 59.0% Owner occupied6,589 41.0% Renter occupiedHouse owners and renters - Two or more races residents 1,948 44.1% Owner occupied2,468 55.9% Renter occupiedHouse owners and renters - White alone residents 2,140 75.3% Owner occupied702 24.7% Renter occupiedHouse owners and renters - Hispanic or Latino residents 12,844 56.1% Owner occupied10,039 43.9% Renter occupied
Language usage in Cicero
English speakers - Total 18.3% of residents of Cicero speak English at home.
80.9% of residents speak Spanish at home 37,474 59.3% Speak English very well25,757 40.7% Speak English less than very well1.5% of residents speak other language at home 961 81.0% Speak English very well225 19.0% Speak English less than very well
English speakers - Born in the United States 38.1% of residents of Cicero speak English at home.
59.5% of residents speak Spanish at home 2,269 80.7% Speak English very well542 19.3% Speak English less than very well0.8% of residents speak other language at home 37 100.0% Speak English very well
English speakers - Native, born elsewhere 15.9% of residents of Cicero speak English at home.
81.3% of residents speak Spanish at home 622 64.3% Speak English very well346 35.7% Speak English less than very well2.4% of residents speak other language at home 28 100.0% Speak English very well
English speakers - Foreign-born 2.8% of residents of Cicero speak English at home.
96.5% of residents speak Spanish at home 9,217 29.5% Speak English very well21,977 70.5% Speak English less than very well2.0% of residents speak other language at home 458 69.5% Speak English very well201 30.5% Speak English less than very well
White (Caucasian) - Speak only English Native:
55.9% (4,880)Foreign-born:
19.2% (350)
White (Caucasian) - Speak another language Native:
44.1% (3,849)Foreign-born:
80.8% (1,477)
Black or African American - Speak only English Native:
91.4% (2,353)Foreign-born:
50.3% (77)
Black or African American - Speak another language Native:
8.7% (224)Foreign-born:
52.7% (81)
American Indian / Alaska Native - Speak only English Native:
17.6% (104)Foreign-born:
4.6% (52)
American Indian / Alaska Native - Speak another language Native:
87.6% (519)Foreign-born:
94.9% (1,065)
Asian - Speak only English Native:
25.3% (32)Foreign-born:
32.5% (113)
Asian - Speak another language Native:
74.5% (93)Foreign-born:
64.4% (225)
Other race - Speak only English Native:
14.4% (3,842)Foreign-born:
1.0% (214)
Other race - Speak another language Native:
85.6% (22,823)Foreign-born:
99.0% (21,029)
Two or more races - Speak only English Native:
34.0% (2,458)Foreign-born:
3.5% (241)
Two or more races - Speak another language Native:
66.0% (4,777)Foreign-born:
96.5% (6,594)
White alone - Speak only English Native:
91.4% (5,221)Foreign-born:
24.9% (130)
White alone - Speak another language Native:
8.6% (490)Foreign-born:
74.0% (385)
Hispanic or Latino - Speak only English Native:
19.0% (7,366)Foreign-born:
1.8% (551)
Hispanic or Latino - Speak another language Native:
81.0% (31,432)Foreign-born:
98.2% (29,932)
Foreign-born residents in Cicero 32,383 residents are foreign born (37.5% Latin America ).
This city:
39.3%Illinois:
14.1%
Marital status for residents in Cicero Marital status - White (Caucasian) population 15 years and over
Males 69.1% Never married23.7% Now married2.4% Separated2.1% Widowed2.7% DivorcedFemales 41.1% Never married40.5% Now married0.0% Separated12.1% Widowed6.4% DivorcedWomen who gave birth in the past 12 months Now married:
28.4% (86)Unmarried:
71.6% (218)
Women who did not give birth in the past 12 months Now married:
33.6% (1,354)Unmarried:
66.4% (2,682)
Marital status - Black or African American population 15 years and over
Males 76.0% Never married14.3% Now married0.0% Separated0.6% Widowed9.2% DivorcedFemales 66.0% Never married17.4% Now married1.9% Separated6.6% Widowed8.1% DivorcedWomen who gave birth in the past 12 months Now married:
0.0% (0)Unmarried:
100.0% (31)
Women who did not give birth in the past 12 months Now married:
13.8% (106)Unmarried:
86.2% (658)
Marital status - American Indian / Alaska Native population 15 years and over
Males 41.9% Never married45.5% Now married5.7% Separated6.2% Widowed0.7% DivorcedFemales 36.2% Never married40.4% Now married1.9% Separated5.2% Widowed16.4% DivorcedWomen who did not give birth in the past 12 months Now married:
26.2% (148)Unmarried:
73.8% (417)
Marital status - Asian population 15 years and over
Males 35.3% Never married55.6% Now married0.0% Separated0.0% Widowed9.2% DivorcedFemales 33.9% Never married40.0% Now married0.0% Separated24.2% Widowed1.9% DivorcedWomen who did not give birth in the past 12 months Now married:
20.3% (25)Unmarried:
79.7% (99)
Marital status - Other race population 15 years and over
Males 49.3% Never married48.2% Now married2.0% Separated0.6% Widowed0.0% DivorcedFemales 49.0% Never married38.5% Now married1.7% Separated5.2% Widowed5.6% DivorcedWomen who gave birth in the past 12 months Now married:
48.7% (128)Unmarried:
51.3% (135)
Women who did not give birth in the past 12 months Now married:
27.6% (4,024)Unmarried:
72.4% (10,552)
Marital status - Two or more races population 15 years and over
Males 48.2% Never married42.7% Now married2.1% Separated1.5% Widowed5.5% DivorcedFemales 48.9% Never married40.0% Now married3.1% Separated3.7% Widowed4.3% DivorcedWomen who gave birth in the past 12 months Now married:
100.0% (132)Unmarried:
0.0% (0)
Women who did not give birth in the past 12 months Now married:
23.7% (1,094)Unmarried:
76.3% (3,516)
Marital status - White alone, not Hispanic / Latino population 15 years and over
Males 59.6% Never married29.3% Now married0.0% Separated4.8% Widowed6.3% DivorcedFemales 32.6% Never married45.4% Now married0.0% Separated20.0% Widowed2.1% DivorcedWomen who gave birth in the past 12 months Now married:
0.0% (0)Unmarried:
100.0% (9)
Women who did not give birth in the past 12 months Now married:
21.1% (208)Unmarried:
78.9% (781)
Marital status - Hispanic or Latino population 15 years and over
Males 53.6% Never married43.4% Now married2.3% Separated0.4% Widowed0.2% DivorcedFemales 50.2% Never married36.7% Now married2.2% Separated4.3% Widowed6.6% DivorcedWomen who gave birth in the past 12 months Now married:
51.1% (260)Unmarried:
48.9% (249)
Women who did not give birth in the past 12 months Now married:
27.4% (5,765)Unmarried:
72.6% (15,289)
Ancestries in Cicero
625 1.0% Polish458 0.7% American420 0.7% Irish252 0.4% Czech214 0.3% German159 0.3% Italian73 0.1% Arab70 0.1% French69 0.1% Lithuanian53 0.08% Croatian47 0.07% Slovene39 0.06% Ukrainian38 0.06% Jamaican36 0.06% Ugandan33 0.05% Palestinian33 0.05% Scottish32 0.05% European28 0.04% Serbian27 0.04% English25 0.04% Romanian18 0.03% Scotch-Irish14 0.02% Eastern European13 0.02% African11 0.02% Armenian11 0.02% Greek9 0.01% Swedish7 0.01% Czechoslovakian7 0.01% Russian
Geographical mobility in Cicero Same house 1 year ago 16,055 91.1% White (Caucasian)2,565 88.3% Black or African American1,583 95.4% American Indian / Alaska Native427 90.4% Asian8 100.0% Native Hawaiian / Pacific Islander53,144 97.6% Other race14,801 94.0% Two or more races5,976 93.1% White alone, not Hispanic / Latino69,221 95.1% Hispanic or LatinoMoved within same county 1,252 7.1% White / Caucasian298 10.3% Black or African American65 3.9% American Indian / Alaska Native7 1.6% Asian1,432 2.6% Other race711 4.5% Two or more races286 4.5% White alone, not Hispanic / Latino3,003 4.1% Hispanic or LatinoMoved within same state 47 0.3% White / Caucasian14 0.5% Black or African American20 4.3% Asian19 0.0% Other race9 0.1% Two or more races44 0.7% White alone, not Hispanic / Latino27 0.0% Hispanic or LatinoMoved from different state 68 0.4% White / Caucasian1 0.0% Black or African American13 2.7% Asian38 0.2% Two or more races70 1.1% White alone, not Hispanic / Latino28 0.0% Hispanic or LatinoMoved from abroad 62 0.4% White168 0.3% Other race57 0.4% Two or more races15 0.2% White alone, not Hispanic / Latino306 0.4% Hispanic or Latino
Children Nativity (place of birth) in Cicero
Children under 6 years - Living with two parents Both parents native 722 100.0% NativeBoth parents foreign-born 594 93.9% Native38 6.1% Foreign-bornOne native, one foreign-born parent 1,032 100.0% NativeChildren under 6 years - Living with one parent Native parent 2,038 100.0% NativeForeign-born parent 662 83.9% Native128 16.1% Foreign-bornChildren 6 to 17 years - Living with two parents Both parents native 1,232 100.0% NativeBoth parents foreign-born 4,917 94.9% Native264 5.1% Foreign-bornOne native, one foreign-born parent 2,025 98.6% Native29 1.4% Foreign-bornChildren 6 to 17 years - Living with one parent Native parent 2,851 100.0% NativeForeign-born parent 3,203 52.8% Native2,860 47.2% Foreign-born
Grandparents responsible for own grandchildren in Cicero
Grandparents (30 to 59 years) White / Caucasian 70 32.0% Responsible for grandchildren147 68.0% Not responsible for grandchildrenBlack or African American 91 100.0% Not responsible for grandchildrenAmerican Indian / Alaska Native 32 100.0% Not responsible for grandchildrenOther race 225 18.4% Responsible for grandchildren998 81.6% Not responsible for grandchildrenTwo or more races 105 46.6% Responsible for grandchildren120 53.4% Not responsible for grandchildrenWhite alone, not Hispanic / Latino 23 100.0% Not responsible for grandchildrenHispanic or Latino 761 47.6% Responsible for grandchildren837 52.4% Not responsible for grandchildrenGrandparents (60 years and over) White / Caucasian 132 47.1% Responsible for grandchildren148 52.9% Not responsible for grandchildrenBlack or African American 77 100.0% Not responsible for grandchildrenAmerican Indian / Alaska Native 223 100.0% Not responsible for grandchildrenOther race 107 14.6% Responsible for grandchildren625 85.4% Not responsible for grandchildrenTwo or more races 233 62.4% Responsible for grandchildren140 37.6% Not responsible for grandchildrenWhite alone, not Hispanic / Latino 161 84.8% Responsible for grandchildren29 15.2% Not responsible for grandchildrenHispanic or Latino 499 33.3% Responsible for grandchildren999 66.7% Not responsible for grandchildren