Races in Chubbuck, Idaho (ID) Detailed Stats
Data:
Races - White alone (%)
Races - White alone (% change since 2000)
Races - Black alone (%)
Races - Black alone (% change since 2000)
Races - American Indian alone (%)
Races - American Indian alone (% change since 2000)
Races - Asian alone (%)
Races - Asian alone (% change since 2000)
Races - Hispanic (%)
Races - Hispanic (% change since 2000)
Races - Native Hawaiian and Other Pacific Islander alone (%)
Races - Native Hawaiian and Other Pacific Islander alone (% change since 2000)
Races - Two or more races(%)
Races - Two or more races(% change since 2000)
Races - Other race alone (%)
Races - Other race alone (% change since 2000)
Racial diversity
Place of birth - Born in state of residence (%)
Place of birth - Born in state of residence (%) - White
Place of birth - Born in state of residence (%) - Black or African American
Place of birth - Born in state of residence (%) - Asian
Place of birth - Born in state of residence (%) - Hispanic or Latino
Place of birth - Born in state of residence (%) - American Indian and Alaska Native
Place of birth - Born in state of residence (%) - Multirace
Place of birth - Born in state of residence (%) - Other Race
Place of birth - Born in other state (%)
Place of birth - Born in other state (%) - White
Place of birth - Born in other state (%) - Black or African American
Place of birth - Born in other state (%) - Asian
Place of birth - Born in other state (%) - Hispanic or Latino
Place of birth - Born in other state (%) - American Indian and Alaska Native
Place of birth - Born in other state (%) - Multirace
Place of birth - Born in other state (%) - Other Race
Place of birth - Native, outside of US (%)
Place of birth - Native, outside of US (%) - White
Place of birth - Native, outside of US (%) - Black or African American
Place of birth - Native, outside of US (%) - Asian
Place of birth - Native, outside of US (%) - Hispanic or Latino
Place of birth - Native, outside of US (%) - American Indian and Alaska Native
Place of birth - Native, outside of US (%) - Multirace
Place of birth - Native, outside of US (%) - Other Race
Place of birth - Foreign born (%)
Place of birth - Foreign born (%) - White
Place of birth - Foreign born (%) - Black or African American
Place of birth - Foreign born (%) - Asian
Place of birth - Foreign born (%) - Hispanic or Latino
Place of birth - Foreign born (%) - American Indian and Alaska Native
Place of birth - Foreign born (%) - Multirace
Place of birth - Foreign born (%) - Other Race
Residents speaking English at home (%)
Residents speaking English at home - Born in the United States (%)
Residents speaking English at home - Native, born elsewhere (%)
Residents speaking English at home - Foreign born (%)
Residents speaking Spanish at home (%)
Residents speaking Spanish at home - Born in the United States (%)
Residents speaking Spanish at home - Native, born elsewhere (%)
Residents speaking Spanish at home - Foreign born (%)
Residents speaking other language at home (%)
Residents speaking other language at home - Born in the United States (%)
Residents speaking other language at home - Native, born elsewhere (%)
Residents speaking other language at home - Foreign born (%)
Marital status - Never married (%)
Marital status - Now married (%)
Marital status - Separated (%)
Marital status - Widowed (%)
Marital status - Divorced (%)
Ancestries Reported - Arab (%)
Ancestries Reported - Czech (%)
Ancestries Reported - Danish (%)
Ancestries Reported - Dutch (%)
Ancestries Reported - English (%)
Ancestries Reported - French (%)
Ancestries Reported - French Canadian (%)
Ancestries Reported - German (%)
Ancestries Reported - Greek (%)
Ancestries Reported - Hungarian (%)
Ancestries Reported - Irish (%)
Ancestries Reported - Italian (%)
Ancestries Reported - Lithuanian (%)
Ancestries Reported - Norwegian (%)
Ancestries Reported - Polish (%)
Ancestries Reported - Portuguese (%)
Ancestries Reported - Russian (%)
Ancestries Reported - Scotch-Irish (%)
Ancestries Reported - Scottish (%)
Ancestries Reported - Slovak (%)
Ancestries Reported - Subsaharan African (%)
Ancestries Reported - Swedish (%)
Ancestries Reported - Swiss (%)
Ancestries Reported - Ukrainian (%)
Ancestries Reported - United States (%)
Ancestries Reported - Welsh (%)
Ancestries Reported - West Indian (%)
Ancestries Reported - Other (%)
Geographical mobility - Same house 1 year ago (%)
Geographical mobility - Same house 1 year ago (%) - White
Geographical mobility - Same house 1 year ago (%) - Black or African American
Geographical mobility - Same house 1 year ago (%) - Asian
Geographical mobility - Same house 1 year ago (%) - Hispanic or Latino
Geographical mobility - Same house 1 year ago (%) - American Indian and Alaska Native
Geographical mobility - Same house 1 year ago (%) - Multirace
Geographical mobility - Same house 1 year ago (%) - Other Race
Geographical mobility - Moved within same county (%)
Geographical mobility - Moved within same county (%) - White
Geographical mobility - Moved within same county (%) - Black or African American
Geographical mobility - Moved within same county (%) - Asian
Geographical mobility - Moved within same county (%) - Hispanic or Latino
Geographical mobility - Moved within same county (%) - American Indian and Alaska Native
Geographical mobility - Moved within same county (%) - Multirace
Geographical mobility - Moved within same county (%) - Other Race
Geographical mobility - Moved from different county within same state (%)
Geographical mobility - Moved from different county within same state (%) - White
Geographical mobility - Moved from different county within same state (%) - Black or African American
Geographical mobility - Moved from different county within same state (%) - Asian
Geographical mobility - Moved from different county within same state (%) - Hispanic or Latino
Geographical mobility - Moved from different county within same state (%) - American Indian and Alaska Native
Geographical mobility - Moved from different county within same state (%) - Multirace
Geographical mobility - Moved from different county within same state (%) - Other Race
Geographical mobility - Moved from different state (%)
Geographical mobility - Moved from different state (%) - White
Geographical mobility - Moved from different state (%) - Black or African American
Geographical mobility - Moved from different state (%) - Asian
Geographical mobility - Moved from different state (%) - Hispanic or Latino
Geographical mobility - Moved from different state (%) - American Indian and Alaska Native
Geographical mobility - Moved from different state (%) - Multirace
Geographical mobility - Moved from different state (%) - Other Race
Geographical mobility - Moved from abroad (%)
Geographical mobility - Moved from abroad (%) - White
Geographical mobility - Moved from abroad (%) - Black or African American
Geographical mobility - Moved from abroad (%) - Asian
Geographical mobility - Moved from abroad (%) - Hispanic or Latino
Geographical mobility - Moved from abroad (%) - American Indian and Alaska Native
Geographical mobility - Moved from abroad (%) - Multirace
Geographical mobility - Moved from abroad (%) - Other Race
Place of birth for the foreign-born population - Ireland (%)
Place of birth for the foreign-born population - Denmark (%)
Place of birth for the foreign-born population - Norway (%)
Place of birth for the foreign-born population - Sweden (%)
Place of birth for the foreign-born population - United Kingdom (%)
Place of birth for the foreign-born population - England (%)
Place of birth for the foreign-born population - Scotland (%)
Place of birth for the foreign-born population - Other Northern Europe (%)
Place of birth for the foreign-born population - Austria (%)
Place of birth for the foreign-born population - Belgium (%)
Place of birth for the foreign-born population - France (%)
Place of birth for the foreign-born population - Germany (%)
Place of birth for the foreign-born population - Netherlands (%)
Place of birth for the foreign-born population - Switzerland (%)
Place of birth for the foreign-born population - Other Western Europe (%)
Place of birth for the foreign-born population - Greece (%)
Place of birth for the foreign-born population - Italy (%)
Place of birth for the foreign-born population - Portugal (%)
Place of birth for the foreign-born population - Spain (%)
Place of birth for the foreign-born population - Other Southern Europe (%)
Place of birth for the foreign-born population - Albania (%)
Place of birth for the foreign-born population - Belarus (%)
Place of birth for the foreign-born population - Bosnia and Herzegovina (%)
Place of birth for the foreign-born population - Bulgaria (%)
Place of birth for the foreign-born population - Croatia (%)
Place of birth for the foreign-born population - Czechoslovakia (%)
Place of birth for the foreign-born population - Hungary (%)
Place of birth for the foreign-born population - Latvia (%)
Place of birth for the foreign-born population - Lithuania (%)
Place of birth for the foreign-born population - North Macedonia (Macedonia) (%)
Place of birth for the foreign-born population - Moldova (%)
Place of birth for the foreign-born population - Poland (%)
Place of birth for the foreign-born population - Romania (%)
Place of birth for the foreign-born population - Russia (%)
Place of birth for the foreign-born population - Serbia (%)
Place of birth for the foreign-born population - Ukraine (%)
Place of birth for the foreign-born population - Other Eastern Europe (%)
Place of birth for the foreign-born population - China (%)
Place of birth for the foreign-born population - Hong Kong (%)
Place of birth for the foreign-born population - Taiwan (%)
Place of birth for the foreign-born population - Japan (%)
Place of birth for the foreign-born population - Korea (%)
Place of birth for the foreign-born population - Other Eastern Asia (%)
Place of birth for the foreign-born population - Afghanistan (%)
Place of birth for the foreign-born population - Bangladesh (%)
Place of birth for the foreign-born population - India (%)
Place of birth for the foreign-born population - Iran (%)
Place of birth for the foreign-born population - Kazakhstan (%)
Place of birth for the foreign-born population - Nepal (%)
Place of birth for the foreign-born population - Pakistan (%)
Place of birth for the foreign-born population - Sri Lanka (%)
Place of birth for the foreign-born population - Uzbekistan (%)
Place of birth for the foreign-born population - Other South Central Asia (%)
Place of birth for the foreign-born population - Burma (%)
Place of birth for the foreign-born population - Cambodia (%)
Place of birth for the foreign-born population - Indonesia (%)
Place of birth for the foreign-born population - Laos (%)
Place of birth for the foreign-born population - Malaysia (%)
Place of birth for the foreign-born population - Philippines (%)
Place of birth for the foreign-born population - Singapore (%)
Place of birth for the foreign-born population - Thailand (%)
Place of birth for the foreign-born population - Vietnam (%)
Place of birth for the foreign-born population - Other South Eastern Asia (%)
Place of birth for the foreign-born population - Armenia (%)
Place of birth for the foreign-born population - Iraq (%)
Place of birth for the foreign-born population - Israel (%)
Place of birth for the foreign-born population - Jordan (%)
Place of birth for the foreign-born population - Kuwait (%)
Place of birth for the foreign-born population - Lebanon (%)
Place of birth for the foreign-born population - Saudi Arabia (%)
Place of birth for the foreign-born population - Syria (%)
Place of birth for the foreign-born population - Turkey (%)
Place of birth for the foreign-born population - Yemen (%)
Place of birth for the foreign-born population - Other Western Asia (%)
Place of birth for the foreign-born population - Eritrea (%)
Place of birth for the foreign-born population - Ethiopia (%)
Place of birth for the foreign-born population - Kenya (%)
Place of birth for the foreign-born population - Somalia (%)
Place of birth for the foreign-born population - Uganda (%)
Place of birth for the foreign-born population - Zimbabwe (%)
Place of birth for the foreign-born population - Other Eastern Africa (%)
Place of birth for the foreign-born population - Cameroon (%)
Place of birth for the foreign-born population - Congo (%)
Place of birth for the foreign-born population - Democratic Republic of Congo (Zaire) (%)
Place of birth for the foreign-born population - Other Middle Africa (%)
Place of birth for the foreign-born population - Egypt (%)
Place of birth for the foreign-born population - Morocco (%)
Place of birth for the foreign-born population - Sudan (%)
Place of birth for the foreign-born population - Other Northern Africa (%)
Place of birth for the foreign-born population - South Africa (%)
Place of birth for the foreign-born population - Other Southern Africa (%)
Place of birth for the foreign-born population - Cabo Verde (%)
Place of birth for the foreign-born population - Ghana (%)
Place of birth for the foreign-born population - Liberia (%)
Place of birth for the foreign-born population - Nigeria (%)
Place of birth for the foreign-born population - Senegal (%)
Place of birth for the foreign-born population - Sierra Leone (%)
Place of birth for the foreign-born population - Other Western Africa (%)
Place of birth for the foreign-born population - Australia (%)
Place of birth for the foreign-born population - New Zealand (%)
Place of birth for the foreign-born population - Fiji (%)
Place of birth for the foreign-born population - Micronesia (%)
Place of birth for the foreign-born population - Bahamas (%)
Place of birth for the foreign-born population - Barbados (%)
Place of birth for the foreign-born population - Cuba (%)
Place of birth for the foreign-born population - Dominica (%)
Place of birth for the foreign-born population - Dominican Republic (%)
Place of birth for the foreign-born population - Grenada (%)
Place of birth for the foreign-born population - Haiti (%)
Place of birth for the foreign-born population - Jamaica (%)
Place of birth for the foreign-born population - St. Vincent and the Grenadines (%)
Place of birth for the foreign-born population - Trinidad and Tobago (%)
Place of birth for the foreign-born population - West Indies (%)
Place of birth for the foreign-born population - Other Caribbean (%)
Place of birth for the foreign-born population - Belize (%)
Place of birth for the foreign-born population - Costa Rica (%)
Place of birth for the foreign-born population - El Salvador (%)
Place of birth for the foreign-born population - Guatemala (%)
Place of birth for the foreign-born population - Honduras (%)
Place of birth for the foreign-born population - Mexico (%)
Place of birth for the foreign-born population - Nicaragua (%)
Place of birth for the foreign-born population - Panama (%)
Place of birth for the foreign-born population - Other Central America (%)
Place of birth for the foreign-born population - Argentina (%)
Place of birth for the foreign-born population - Bolivia (%)
Place of birth for the foreign-born population - Brazil (%)
Place of birth for the foreign-born population - Chile (%)
Place of birth for the foreign-born population - Colombia (%)
Place of birth for the foreign-born population - Ecuador (%)
Place of birth for the foreign-born population - Guyana (%)
Place of birth for the foreign-born population - Peru (%)
Place of birth for the foreign-born population - Uruguay (%)
Place of birth for the foreign-born population - Venezuela (%)
Place of birth for the foreign-born population - Other South America (%)
Place of birth for the foreign-born population - Canada (%)
Place of birth for the foreign-born population - Other Northern America (%)
Place of birth for the foreign-born population - Other (%)
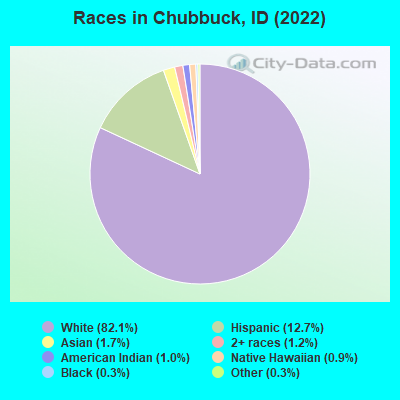
According to 2022 data, the most numerous races in Chubbuck, ID are White alone (13,140 residents), Hispanic (2,039 residents), and Two or more races (198 residents). 90.4% of Chubbuck residents speak English at home. 3.5% of Chubbuck, ID residents are foreign-born (1.5% born in Latin America, 1.2% born in Asia), which is 44.8% less than the foreign-born rate of 5.0% across the entire state of Idaho.
Race distribution in Chubbuck
2000 2022
1,139,291 88.0% White alone 101,690 7.9% Hispanic 18,261 1.4% Two or more races 15,789 1.2% American Indian alone 11,641 0.9% Asian alone 4,889 0.4% Black alone 1,192 0.09% Other race alone 1,200 0.09% Native Hawaiian and Other
1,531,219 79.0% White alone 261,921 13.5% Hispanic 81,112 4.2% Two or more races 25,174 1.3% Asian alone 15,825 0.8% American Indian alone 11,868 0.6% Black alone 8,752 0.5% Other race alone 3,162 0.2% Native Hawaiian and Other
Income and house value in Chubbuck Median household income in 2022 $74,095 White non-Hispanic householders$52,796 Black householders$31,352 American Indian and Alaska Native householders$59,423 Some other race householders$90,685 Two or more races householders$69,426 Hispanic or Latino race householdersMedian 2022 house value $405,246 White Non-Hispanic householders$237,733 American Indian or Alaska Native householders $190,355 Asian householders$377,750 Some other race householders$359,560 Two or more races householders$357,445 Hispanic or Latino householders
Median age by race in Chubbuck
36.8 Median age for White residents34.2 41.2 41.6 Median age for Black or African American residents43.2 -909,836,064.7 26.1 Median age for American Indian / Alaska Native residents20.2 32.9 30.9 Median age for Asian residents39.4 51.4 22.0 Median age for Native Hawaiian / Pacific Islander residents19.8 -679,245,282.3 40.2 Median age for Other race residents36.8 40.3 25.8 Median age for Two or more races residents30.7 18.1 37.3 Median age for White alone residents35.1 40.5 26.9 Median age for Hispanic or Latino residents25.8 31.9
Owner/renter occupied households by race in Chubbuck
House owners and renters - White residents 3,841 75.6% Owner occupied1,236 24.4% Renter occupiedHouse owners and renters - Black or African American residents 17 25.7% Owner occupied49 74.3% Renter occupiedHouse owners and renters - American Indian / Alaska Native residents 152 100.0% Renter occupiedHouse owners and renters - Asian residents 29 16.3% Owner occupied148 83.7% Renter occupiedHouse owners and renters - Native Hawaiian / Pacific Islander residents 22 100.0% Owner occupiedHouse owners and renters - Other race residents 307 77.4% Owner occupied90 22.6% Renter occupiedHouse owners and renters - Two or more races residents 83 70.2% Owner occupied35 29.8% Renter occupiedHouse owners and renters - White alone residents 3,799 76.7% Owner occupied1,152 23.3% Renter occupiedHouse owners and renters - Hispanic or Latino residents 399 62.7% Owner occupied237 37.3% Renter occupied
Language usage in Chubbuck
English speakers - Total 90.4% of residents of Chubbuck speak English at home.
9.9% of residents speak Spanish at home 1,210 80.9% Speak English very well285 19.1% Speak English less than very well1.6% of residents speak other language at home 161 65.2% Speak English very well86 34.8% Speak English less than very well
English speakers - Born in the United States 94.9% of residents of Chubbuck speak English at home.
4.2% of residents speak Spanish at home 187 82.0% Speak English very well41 18.0% Speak English less than very well0.8% of residents speak other language at home 35 85.4% Speak English very well6 14.6% Speak English less than very well
English speakers - Native, born elsewhere 65.4% of residents of Chubbuck speak English at home.
46.2% of residents speak Spanish at home 48 100.0% Speak English very well
English speakers - Foreign-born 19.5% of residents of Chubbuck speak English at home.
60.0% of residents speak Spanish at home 238 56.9% Speak English very well180 43.1% Speak English less than very well28.0% of residents speak other language at home 111 56.9% Speak English very well84 43.1% Speak English less than very well
White (Caucasian) - Speak only English Native:
97.2% (12,210)Foreign-born:
100.0% (99)
White (Caucasian) - Speak another language Native:
2.9% (359)Foreign-born:
7.4% (7)
Asian - Speak only English Native:
100.0% (57)Foreign-born:
6.8% (16)
Native Hawaiian / Pacific Islander - Speak only English Native:
99.5% (106)Foreign-born:
96.3% (8)
Other race - Speak another language Native:
39.4% (268)Foreign-born:
99.1% (116)
Two or more races - Speak another language Native:
25.5% (247)Foreign-born:
97.2% (138)
White alone - Speak only English Native:
97.3% (11,991)Foreign-born:
100.0% (110)
White alone - Speak another language Native:
2.8% (348)Foreign-born:
7.8% (9)
Hispanic or Latino - Speak only English Native:
61.2% (915)Foreign-born:
4.9% (20)
Hispanic or Latino - Speak another language Native:
45.3% (677)Foreign-born:
100.0% (414)
Foreign-born residents in Chubbuck 553 residents are foreign born (1.5% Latin America , 1.2% Asia ).
Marital status for residents in Chubbuck Marital status - White (Caucasian) population 15 years and over
Males 25.3% Never married65.8% Now married0.1% Separated1.4% Widowed7.5% DivorcedFemales 23.2% Never married58.7% Now married1.7% Separated9.3% Widowed7.1% DivorcedWomen who gave birth in the past 12 months Now married:
92.5% (97)Unmarried:
7.5% (8)
Women who did not give birth in the past 12 months Now married:
56.0% (1,517)Unmarried:
44.0% (1,189)
Marital status - American Indian / Alaska Native population 15 years and over
Males 71.4% Never married28.6% Now married0.0% Separated0.0% Widowed0.0% DivorcedFemales 88.6% Never married11.4% Now married0.0% Separated0.0% Widowed0.0% DivorcedWomen who did not give birth in the past 12 months Now married:
11.4% (9)Unmarried:
88.6% (71)
Marital status - Asian population 15 years and over
Males 73.4% Never married7.6% Now married0.0% Separated0.0% Widowed19.0% DivorcedFemales 0.0% Never married78.5% Now married0.0% Separated0.0% Widowed21.5% DivorcedMarital status - Native Hawaiian / Pacific Islander population 15 years and over
Males 79.6% Never married20.4% Now married0.0% Separated0.0% Widowed0.0% DivorcedFemales 0.0% Never married100.0% Now married0.0% Separated0.0% Widowed0.0% DivorcedWomen who did not give birth in the past 12 months Now married:
100.0% (8)Unmarried:
0.0% (0)
Marital status - Other race population 15 years and over
Males 31.1% Never married64.8% Now married0.0% Separated0.0% Widowed4.1% DivorcedFemales 29.3% Never married51.1% Now married2.8% Separated2.8% Widowed14.0% DivorcedWomen who gave birth in the past 12 months Now married:
100.0% (9)Unmarried:
0.0% (0)
Women who did not give birth in the past 12 months Now married:
23.7% (43)Unmarried:
76.3% (139)
Marital status - Two or more races population 15 years and over
Males 67.5% Never married23.2% Now married0.0% Separated9.2% Widowed0.0% DivorcedFemales 54.8% Never married36.8% Now married0.0% Separated0.0% Widowed8.4% DivorcedWomen who gave birth in the past 12 months Now married:
100.0% (68)Unmarried:
0.0% (0)
Women who did not give birth in the past 12 months Now married:
10.7% (28)Unmarried:
89.3% (235)
Marital status - White alone, not Hispanic / Latino population 15 years and over
Males 24.8% Never married67.0% Now married0.1% Separated1.4% Widowed6.7% DivorcedFemales 21.9% Never married61.0% Now married1.0% Separated9.5% Widowed6.5% DivorcedWomen who gave birth in the past 12 months Now married:
92.5% (100)Unmarried:
7.5% (8)
Women who did not give birth in the past 12 months Now married:
57.8% (1,521)Unmarried:
42.2% (1,109)
Marital status - Hispanic or Latino population 15 years and over
Males 45.9% Never married47.4% Now married0.0% Separated0.0% Widowed6.7% DivorcedFemales 48.7% Never married30.5% Now married6.1% Separated2.4% Widowed12.3% DivorcedWomen who gave birth in the past 12 months Now married:
100.0% (64)Unmarried:
0.0% (0)
Women who did not give birth in the past 12 months Now married:
19.0% (107)Unmarried:
81.0% (456)
Ancestries in Chubbuck
1,218 15.6% English788 10.1% German761 9.7% American354 4.5% Norwegian254 3.3% European161 2.1% Irish154 2.0% British131 1.7% Danish124 1.6% Finnish109 1.4% Scottish88 1.1% Swedish63 0.8% Welsh46 0.6% Dutch18 0.2% Ethiopian15 0.2% Italian14 0.2% Scandinavian11 0.1% Brazilian10 0.1% Canadian
Children Nativity (place of birth) in Chubbuck
Children under 6 years - Living with two parents Both parents native 967 100.0% NativeOne native, one foreign-born parent 7 100.0% NativeChildren under 6 years - Living with one parent Native parent 82 100.0% Native
Children 6 to 17 years - Living with two parents Both parents native 2,715 100.0% NativeBoth parents foreign-born 88 100.0% NativeOne native, one foreign-born parent 74 100.0% NativeChildren 6 to 17 years - Living with one parent Native parent 693 100.0% Native
Grandparents responsible for own grandchildren in Chubbuck
Grandparents (30 to 59 years) White / Caucasian 4 38.4% Responsible for grandchildren6 61.6% Not responsible for grandchildrenWhite alone, not Hispanic / Latino 4 40.1% Responsible for grandchildren6 59.9% Not responsible for grandchildrenGrandparents (60 years and over) White / Caucasian 30 56.0% Responsible for grandchildren24 44.0% Not responsible for grandchildrenWhite alone, not Hispanic / Latino 30 55.1% Responsible for grandchildren25 44.9% Not responsible for grandchildren