Races in Chester, Pennsylvania (PA) Detailed Stats
Data:
Races - White alone (%)
Races - White alone (% change since 2000)
Races - Black alone (%)
Races - Black alone (% change since 2000)
Races - American Indian alone (%)
Races - American Indian alone (% change since 2000)
Races - Asian alone (%)
Races - Asian alone (% change since 2000)
Races - Hispanic (%)
Races - Hispanic (% change since 2000)
Races - Native Hawaiian and Other Pacific Islander alone (%)
Races - Native Hawaiian and Other Pacific Islander alone (% change since 2000)
Races - Two or more races(%)
Races - Two or more races(% change since 2000)
Races - Other race alone (%)
Races - Other race alone (% change since 2000)
Racial diversity
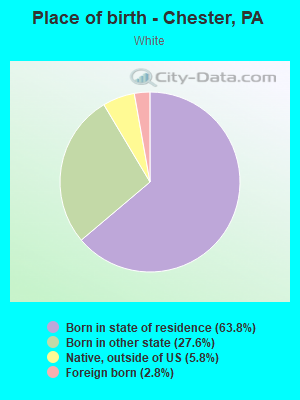
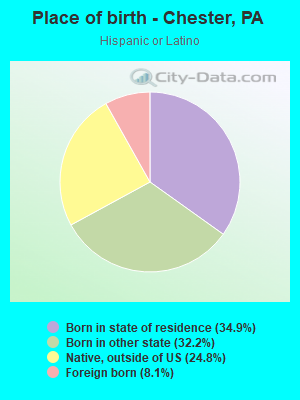
Place of birth - Born in state of residence (%)
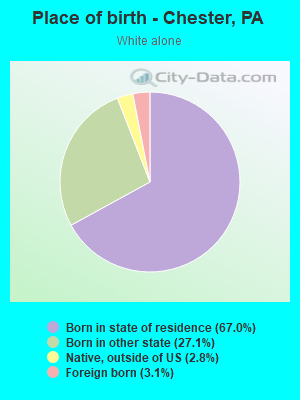
Place of birth - Born in state of residence (%) - White
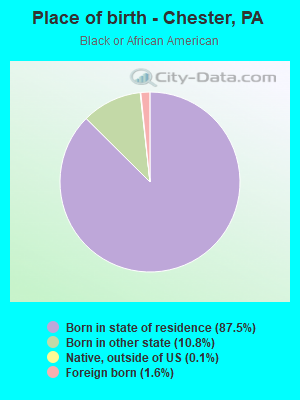
Place of birth - Born in state of residence (%) - Black or African American
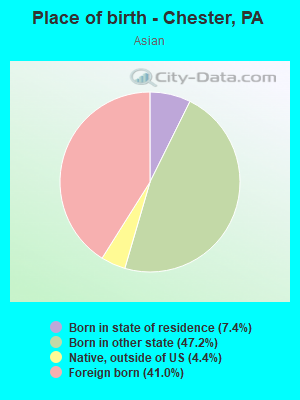
Place of birth - Born in state of residence (%) - Asian
Place of birth - Born in state of residence (%) - Hispanic or Latino
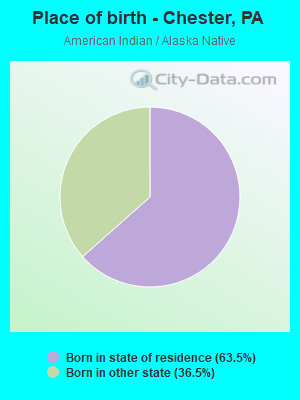
Place of birth - Born in state of residence (%) - American Indian and Alaska Native
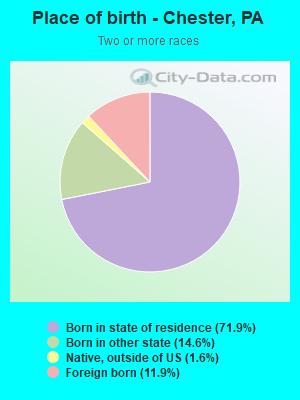
Place of birth - Born in state of residence (%) - Multirace
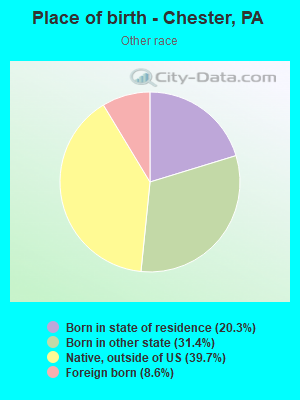
Place of birth - Born in state of residence (%) - Other Race
Place of birth - Born in other state (%)
Place of birth - Born in other state (%) - White
Place of birth - Born in other state (%) - Black or African American
Place of birth - Born in other state (%) - Asian
Place of birth - Born in other state (%) - Hispanic or Latino
Place of birth - Born in other state (%) - American Indian and Alaska Native
Place of birth - Born in other state (%) - Multirace
Place of birth - Born in other state (%) - Other Race
Place of birth - Native, outside of US (%)
Place of birth - Native, outside of US (%) - White
Place of birth - Native, outside of US (%) - Black or African American
Place of birth - Native, outside of US (%) - Asian
Place of birth - Native, outside of US (%) - Hispanic or Latino
Place of birth - Native, outside of US (%) - American Indian and Alaska Native
Place of birth - Native, outside of US (%) - Multirace
Place of birth - Native, outside of US (%) - Other Race
Place of birth - Foreign born (%)
Place of birth - Foreign born (%) - White
Place of birth - Foreign born (%) - Black or African American
Place of birth - Foreign born (%) - Asian
Place of birth - Foreign born (%) - Hispanic or Latino
Place of birth - Foreign born (%) - American Indian and Alaska Native
Place of birth - Foreign born (%) - Multirace
Place of birth - Foreign born (%) - Other Race
Residents speaking English at home (%)
Residents speaking English at home - Born in the United States (%)
Residents speaking English at home - Native, born elsewhere (%)
Residents speaking English at home - Foreign born (%)
Residents speaking Spanish at home (%)
Residents speaking Spanish at home - Born in the United States (%)
Residents speaking Spanish at home - Native, born elsewhere (%)
Residents speaking Spanish at home - Foreign born (%)
Residents speaking other language at home (%)
Residents speaking other language at home - Born in the United States (%)
Residents speaking other language at home - Native, born elsewhere (%)
Residents speaking other language at home - Foreign born (%)
Marital status - Never married (%)
Marital status - Now married (%)
Marital status - Separated (%)
Marital status - Widowed (%)
Marital status - Divorced (%)
Ancestries Reported - Arab (%)
Ancestries Reported - Czech (%)
Ancestries Reported - Danish (%)
Ancestries Reported - Dutch (%)
Ancestries Reported - English (%)
Ancestries Reported - French (%)
Ancestries Reported - French Canadian (%)
Ancestries Reported - German (%)
Ancestries Reported - Greek (%)
Ancestries Reported - Hungarian (%)
Ancestries Reported - Irish (%)
Ancestries Reported - Italian (%)
Ancestries Reported - Lithuanian (%)
Ancestries Reported - Norwegian (%)
Ancestries Reported - Polish (%)
Ancestries Reported - Portuguese (%)
Ancestries Reported - Russian (%)
Ancestries Reported - Scotch-Irish (%)
Ancestries Reported - Scottish (%)
Ancestries Reported - Slovak (%)
Ancestries Reported - Subsaharan African (%)
Ancestries Reported - Swedish (%)
Ancestries Reported - Swiss (%)
Ancestries Reported - Ukrainian (%)
Ancestries Reported - United States (%)
Ancestries Reported - Welsh (%)
Ancestries Reported - West Indian (%)
Ancestries Reported - Other (%)
Geographical mobility - Same house 1 year ago (%)
Geographical mobility - Same house 1 year ago (%) - White
Geographical mobility - Same house 1 year ago (%) - Black or African American
Geographical mobility - Same house 1 year ago (%) - Asian
Geographical mobility - Same house 1 year ago (%) - Hispanic or Latino
Geographical mobility - Same house 1 year ago (%) - American Indian and Alaska Native
Geographical mobility - Same house 1 year ago (%) - Multirace
Geographical mobility - Same house 1 year ago (%) - Other Race
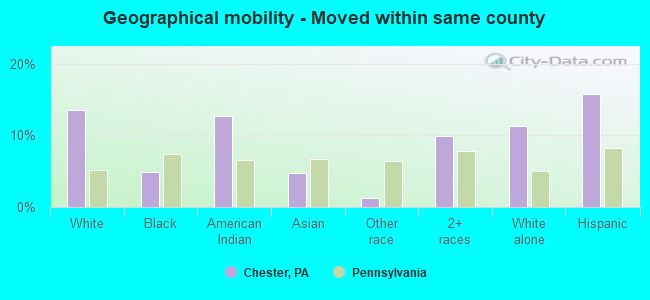
Geographical mobility - Moved within same county (%)
Geographical mobility - Moved within same county (%) - White
Geographical mobility - Moved within same county (%) - Black or African American
Geographical mobility - Moved within same county (%) - Asian
Geographical mobility - Moved within same county (%) - Hispanic or Latino
Geographical mobility - Moved within same county (%) - American Indian and Alaska Native
Geographical mobility - Moved within same county (%) - Multirace
Geographical mobility - Moved within same county (%) - Other Race
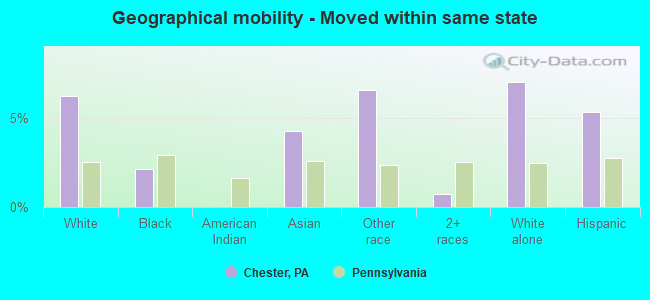
Geographical mobility - Moved from different county within same state (%)
Geographical mobility - Moved from different county within same state (%) - White
Geographical mobility - Moved from different county within same state (%) - Black or African American
Geographical mobility - Moved from different county within same state (%) - Asian
Geographical mobility - Moved from different county within same state (%) - Hispanic or Latino
Geographical mobility - Moved from different county within same state (%) - American Indian and Alaska Native
Geographical mobility - Moved from different county within same state (%) - Multirace
Geographical mobility - Moved from different county within same state (%) - Other Race
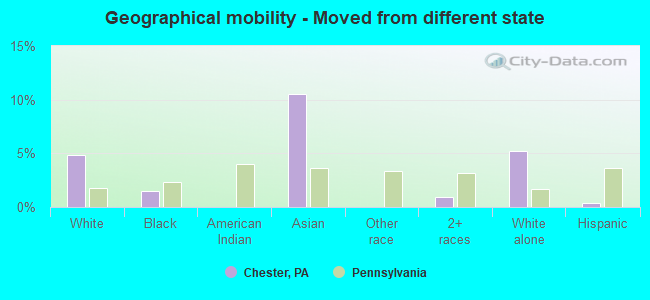
Geographical mobility - Moved from different state (%)
Geographical mobility - Moved from different state (%) - White
Geographical mobility - Moved from different state (%) - Black or African American
Geographical mobility - Moved from different state (%) - Asian
Geographical mobility - Moved from different state (%) - Hispanic or Latino
Geographical mobility - Moved from different state (%) - American Indian and Alaska Native
Geographical mobility - Moved from different state (%) - Multirace
Geographical mobility - Moved from different state (%) - Other Race
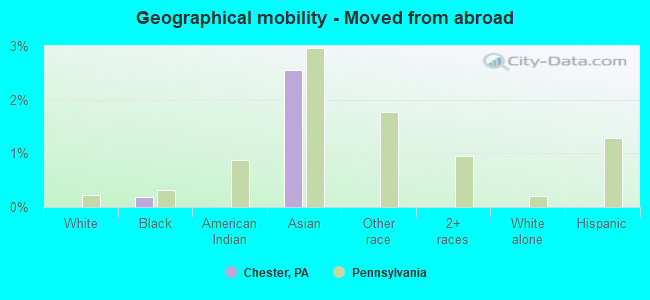
Geographical mobility - Moved from abroad (%)
Geographical mobility - Moved from abroad (%) - White
Geographical mobility - Moved from abroad (%) - Black or African American
Geographical mobility - Moved from abroad (%) - Asian
Geographical mobility - Moved from abroad (%) - Hispanic or Latino
Geographical mobility - Moved from abroad (%) - American Indian and Alaska Native
Geographical mobility - Moved from abroad (%) - Multirace
Geographical mobility - Moved from abroad (%) - Other Race
Place of birth for the foreign-born population - Ireland (%)
Place of birth for the foreign-born population - Denmark (%)
Place of birth for the foreign-born population - Norway (%)
Place of birth for the foreign-born population - Sweden (%)
Place of birth for the foreign-born population - United Kingdom (%)
Place of birth for the foreign-born population - England (%)
Place of birth for the foreign-born population - Scotland (%)
Place of birth for the foreign-born population - Other Northern Europe (%)
Place of birth for the foreign-born population - Austria (%)
Place of birth for the foreign-born population - Belgium (%)
Place of birth for the foreign-born population - France (%)
Place of birth for the foreign-born population - Germany (%)
Place of birth for the foreign-born population - Netherlands (%)
Place of birth for the foreign-born population - Switzerland (%)
Place of birth for the foreign-born population - Other Western Europe (%)
Place of birth for the foreign-born population - Greece (%)
Place of birth for the foreign-born population - Italy (%)
Place of birth for the foreign-born population - Portugal (%)
Place of birth for the foreign-born population - Spain (%)
Place of birth for the foreign-born population - Other Southern Europe (%)
Place of birth for the foreign-born population - Albania (%)
Place of birth for the foreign-born population - Belarus (%)
Place of birth for the foreign-born population - Bosnia and Herzegovina (%)
Place of birth for the foreign-born population - Bulgaria (%)
Place of birth for the foreign-born population - Croatia (%)
Place of birth for the foreign-born population - Czechoslovakia (%)
Place of birth for the foreign-born population - Hungary (%)
Place of birth for the foreign-born population - Latvia (%)
Place of birth for the foreign-born population - Lithuania (%)
Place of birth for the foreign-born population - North Macedonia (Macedonia) (%)
Place of birth for the foreign-born population - Moldova (%)
Place of birth for the foreign-born population - Poland (%)
Place of birth for the foreign-born population - Romania (%)
Place of birth for the foreign-born population - Russia (%)
Place of birth for the foreign-born population - Serbia (%)
Place of birth for the foreign-born population - Ukraine (%)
Place of birth for the foreign-born population - Other Eastern Europe (%)
Place of birth for the foreign-born population - China (%)
Place of birth for the foreign-born population - Hong Kong (%)
Place of birth for the foreign-born population - Taiwan (%)
Place of birth for the foreign-born population - Japan (%)
Place of birth for the foreign-born population - Korea (%)
Place of birth for the foreign-born population - Other Eastern Asia (%)
Place of birth for the foreign-born population - Afghanistan (%)
Place of birth for the foreign-born population - Bangladesh (%)
Place of birth for the foreign-born population - India (%)
Place of birth for the foreign-born population - Iran (%)
Place of birth for the foreign-born population - Kazakhstan (%)
Place of birth for the foreign-born population - Nepal (%)
Place of birth for the foreign-born population - Pakistan (%)
Place of birth for the foreign-born population - Sri Lanka (%)
Place of birth for the foreign-born population - Uzbekistan (%)
Place of birth for the foreign-born population - Other South Central Asia (%)
Place of birth for the foreign-born population - Burma (%)
Place of birth for the foreign-born population - Cambodia (%)
Place of birth for the foreign-born population - Indonesia (%)
Place of birth for the foreign-born population - Laos (%)
Place of birth for the foreign-born population - Malaysia (%)
Place of birth for the foreign-born population - Philippines (%)
Place of birth for the foreign-born population - Singapore (%)
Place of birth for the foreign-born population - Thailand (%)
Place of birth for the foreign-born population - Vietnam (%)
Place of birth for the foreign-born population - Other South Eastern Asia (%)
Place of birth for the foreign-born population - Armenia (%)
Place of birth for the foreign-born population - Iraq (%)
Place of birth for the foreign-born population - Israel (%)
Place of birth for the foreign-born population - Jordan (%)
Place of birth for the foreign-born population - Kuwait (%)
Place of birth for the foreign-born population - Lebanon (%)
Place of birth for the foreign-born population - Saudi Arabia (%)
Place of birth for the foreign-born population - Syria (%)
Place of birth for the foreign-born population - Turkey (%)
Place of birth for the foreign-born population - Yemen (%)
Place of birth for the foreign-born population - Other Western Asia (%)
Place of birth for the foreign-born population - Eritrea (%)
Place of birth for the foreign-born population - Ethiopia (%)
Place of birth for the foreign-born population - Kenya (%)
Place of birth for the foreign-born population - Somalia (%)
Place of birth for the foreign-born population - Uganda (%)
Place of birth for the foreign-born population - Zimbabwe (%)
Place of birth for the foreign-born population - Other Eastern Africa (%)
Place of birth for the foreign-born population - Cameroon (%)
Place of birth for the foreign-born population - Congo (%)
Place of birth for the foreign-born population - Democratic Republic of Congo (Zaire) (%)
Place of birth for the foreign-born population - Other Middle Africa (%)
Place of birth for the foreign-born population - Egypt (%)
Place of birth for the foreign-born population - Morocco (%)
Place of birth for the foreign-born population - Sudan (%)
Place of birth for the foreign-born population - Other Northern Africa (%)
Place of birth for the foreign-born population - South Africa (%)
Place of birth for the foreign-born population - Other Southern Africa (%)
Place of birth for the foreign-born population - Cabo Verde (%)
Place of birth for the foreign-born population - Ghana (%)
Place of birth for the foreign-born population - Liberia (%)
Place of birth for the foreign-born population - Nigeria (%)
Place of birth for the foreign-born population - Senegal (%)
Place of birth for the foreign-born population - Sierra Leone (%)
Place of birth for the foreign-born population - Other Western Africa (%)
Place of birth for the foreign-born population - Australia (%)
Place of birth for the foreign-born population - New Zealand (%)
Place of birth for the foreign-born population - Fiji (%)
Place of birth for the foreign-born population - Micronesia (%)
Place of birth for the foreign-born population - Bahamas (%)
Place of birth for the foreign-born population - Barbados (%)
Place of birth for the foreign-born population - Cuba (%)
Place of birth for the foreign-born population - Dominica (%)
Place of birth for the foreign-born population - Dominican Republic (%)
Place of birth for the foreign-born population - Grenada (%)
Place of birth for the foreign-born population - Haiti (%)
Place of birth for the foreign-born population - Jamaica (%)
Place of birth for the foreign-born population - St. Vincent and the Grenadines (%)
Place of birth for the foreign-born population - Trinidad and Tobago (%)
Place of birth for the foreign-born population - West Indies (%)
Place of birth for the foreign-born population - Other Caribbean (%)
Place of birth for the foreign-born population - Belize (%)
Place of birth for the foreign-born population - Costa Rica (%)
Place of birth for the foreign-born population - El Salvador (%)
Place of birth for the foreign-born population - Guatemala (%)
Place of birth for the foreign-born population - Honduras (%)
Place of birth for the foreign-born population - Mexico (%)
Place of birth for the foreign-born population - Nicaragua (%)
Place of birth for the foreign-born population - Panama (%)
Place of birth for the foreign-born population - Other Central America (%)
Place of birth for the foreign-born population - Argentina (%)
Place of birth for the foreign-born population - Bolivia (%)
Place of birth for the foreign-born population - Brazil (%)
Place of birth for the foreign-born population - Chile (%)
Place of birth for the foreign-born population - Colombia (%)
Place of birth for the foreign-born population - Ecuador (%)
Place of birth for the foreign-born population - Guyana (%)
Place of birth for the foreign-born population - Peru (%)
Place of birth for the foreign-born population - Uruguay (%)
Place of birth for the foreign-born population - Venezuela (%)
Place of birth for the foreign-born population - Other South America (%)
Place of birth for the foreign-born population - Canada (%)
Place of birth for the foreign-born population - Other Northern America (%)
Place of birth for the foreign-born population - Other (%)
Latest news about races in Chester, PA collected exclusively by city-data.com from local newspapers, TV, and radio stations
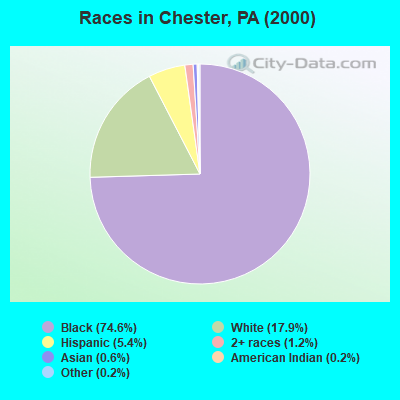
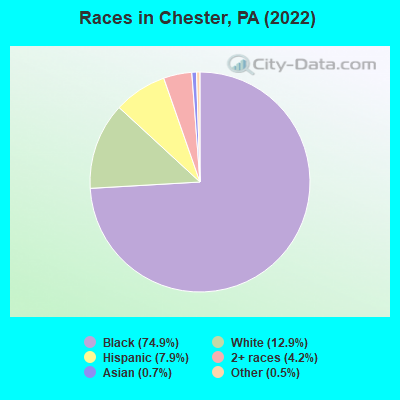
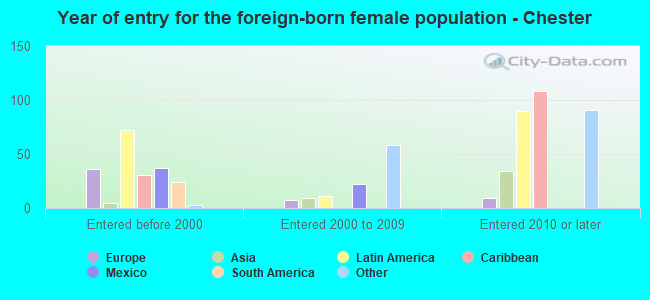
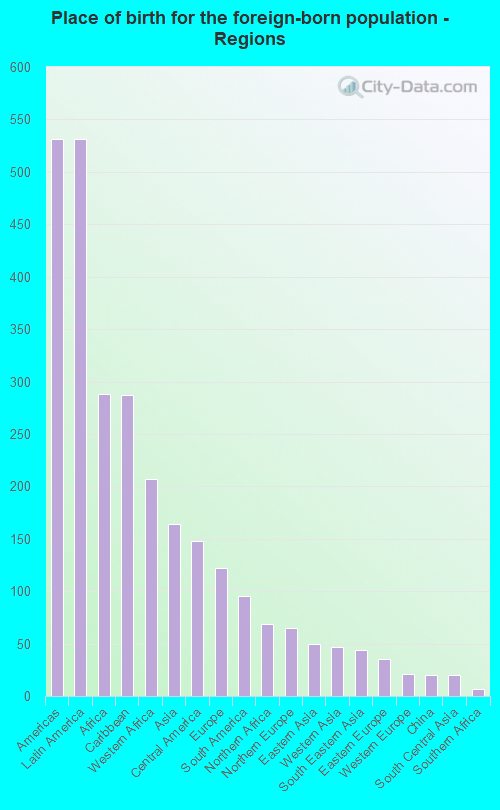
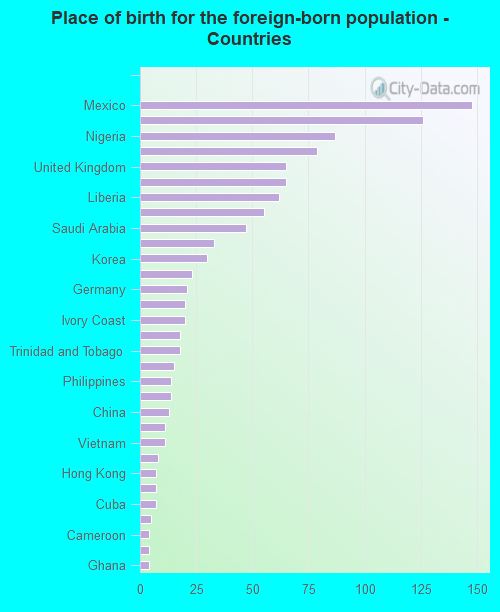
According to 2022 data, the most numerous races in Chester, PA are White alone (4,246 residents), Black alone (24,755 residents), and Hispanic (2,601 residents). 93.2% of Chester residents speak English at home. 3.4% of Chester, PA residents are foreign-born (1.5% born in Latin America, 0.8% born in Africa, 0.5% born in Asia, 0.4% born in Europe), which is 108.9% less than the foreign-born rate of 7.0% across the entire state of Pennsylvania.
Race distribution in Chester
2000 2022
10,322,455 84.1% White alone 1,202,437 9.8% Black alone 394,088 3.2% Hispanic 218,296 1.8% Asian alone 113,097 0.9% Two or more races 13,086 0.1% Other race alone 14,904 0.1% American Indian alone 2,691 0.02% Native Hawaiian and Other
9,487,228 73.1% White alone 1,311,581 10.1% Black alone 1,115,997 8.6% Hispanic 493,942 3.8% Two or more races 487,124 3.8% Asian alone 63,582 0.5% Other race alone 10,130 0.08% American Indian alone 2,424 0.02% Native Hawaiian and Other
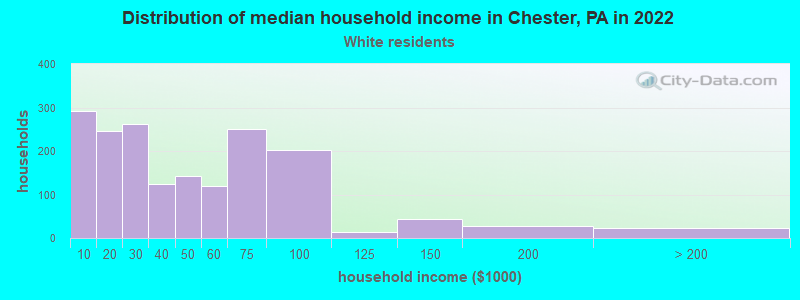
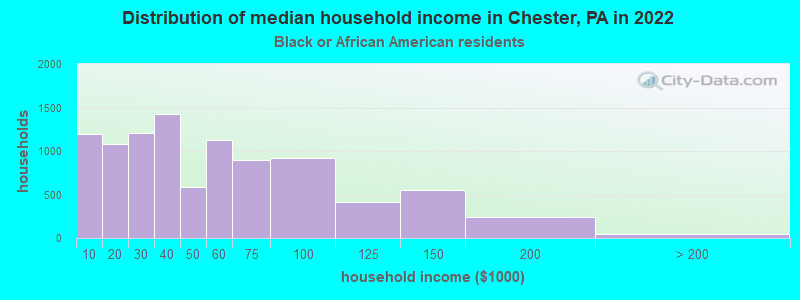
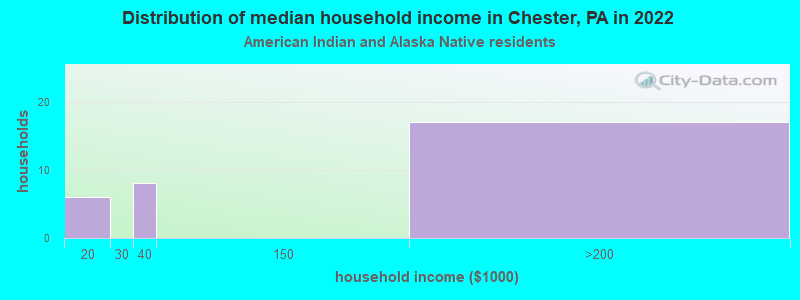
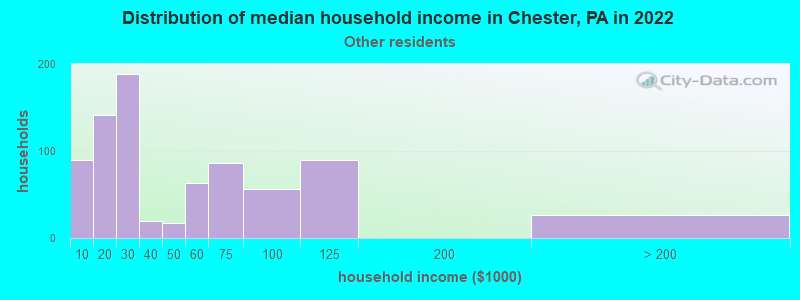
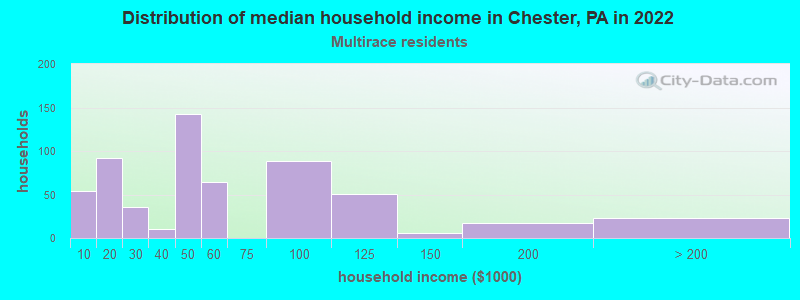
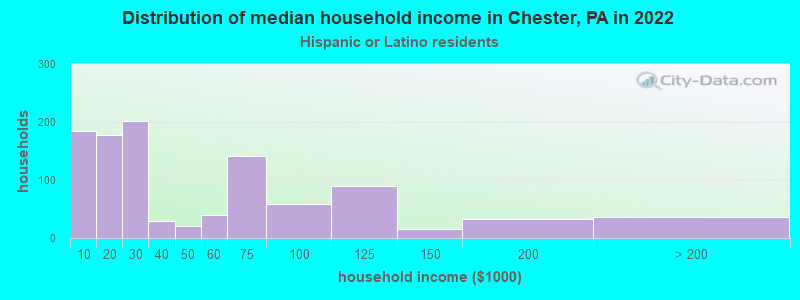
Income and house value in Chester Median household income in 2022 $35,957 White non-Hispanic householders$38,587 Black householders$19,612 Some other race householders$48,263 Two or more races householders$18,622 Hispanic or Latino race householdersMedian 2022 house value $93,486 White Non-Hispanic householders$86,765 Black or African American householders $35,643 Asian householders$60,898 Some other race householders$75,766 Two or more races householders$67,008 Hispanic or Latino householders
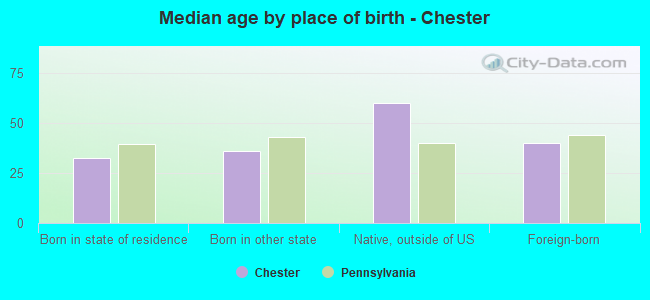
Median age by race in Chester
33.8 Median age for White residents34.5 32.3 34.3 Median age for Black or African American residents31.8 36.5 26.9 Median age for American Indian / Alaska Native residents-1,478,964,399.8 50.9 22.1 Median age for Asian residents21.5 22.5 -680,432,644.4 Median age for Native Hawaiian / Pacific Islander residents-666,666,666.0 -747,474,746.7 37.8 Median age for Other race residents35.1 39.3 33.7 Median age for Two or more races residents31.9 42.1 36.2 Median age for White alone residents35.2 37.6 33.6 Median age for Hispanic or Latino residents39.4 30.3
Owner/renter occupied households by race in Chester
House owners and renters - White residents 666 39.2% Owner occupied1,032 60.8% Renter occupiedHouse owners and renters - Black or African American residents 3,922 41.4% Owner occupied5,560 58.6% Renter occupiedHouse owners and renters - American Indian / Alaska Native residents 75 98.0% Owner occupied2 2.0% Renter occupiedHouse owners and renters - Asian residents 19 100.0% Owner occupiedHouse owners and renters - Other race residents 321 37.5% Owner occupied534 62.5% Renter occupiedHouse owners and renters - Two or more races residents 329 52.5% Owner occupied297 47.5% Renter occupiedHouse owners and renters - White alone residents 621 40.9% Owner occupied900 59.1% Renter occupiedHouse owners and renters - Hispanic or Latino residents 452 43.4% Owner occupied589 56.6% Renter occupied
Language usage in Chester
English speakers - Total 93.2% of residents of Chester speak English at home.
5.6% of residents speak Spanish at home 891 51.6% Speak English very well837 48.4% Speak English less than very well1.8% of residents speak other language at home 332 60.1% Speak English very well220 39.9% Speak English less than very well
English speakers - Born in the United States 86.5% of residents of Chester speak English at home.
11.6% of residents speak Spanish at home 477 82.8% Speak English very well99 17.2% Speak English less than very well2.1% of residents speak other language at home 90 86.5% Speak English very well14 13.5% Speak English less than very well
English speakers - Native, born elsewhere 13.9% of residents of Chester speak English at home.
88.2% of residents speak Spanish at home 150 16.3% Speak English very well771 83.7% Speak English less than very well9.0% of residents speak other language at home 83 88.3% Speak English very well11 11.7% Speak English less than very well
English speakers - Foreign-born 43.8% of residents of Chester speak English at home.
20.0% of residents speak Spanish at home 108 55.1% Speak English very well88 44.9% Speak English less than very well35.5% of residents speak other language at home 149 42.9% Speak English very well198 57.1% Speak English less than very well
White (Caucasian) - Speak only English Native:
90.9% (4,047)Foreign-born:
48.0% (64)
White (Caucasian) - Speak another language Native:
7.6% (340)Foreign-born:
54.4% (73)
Black or African American - Speak only English Native:
99.3% (23,091)Foreign-born:
68.7% (285)
Black or African American - Speak another language Native:
0.7% (159)Foreign-born:
31.9% (132)
Asian - Speak only English Native:
40.4% (53)Foreign-born:
19.0% (19)
Asian - Speak another language Native:
59.6% (79)Foreign-born:
82.5% (84)
Other race - Speak another language Native:
77.9% (1,473)Foreign-born:
100.0% (184)
Two or more races - Speak only English Native:
94.6% (1,229)Foreign-born:
21.9% (36)
Two or more races - Speak another language Native:
6.1% (80)Foreign-born:
76.7% (125)
White alone - Speak only English Native:
98.4% (3,977)Foreign-born:
49.4% (65)
White alone - Speak another language Native:
1.7% (67)Foreign-born:
52.3% (69)
Hispanic or Latino - Speak only English Native:
31.2% (710)Foreign-born:
3.1% (6)
Hispanic or Latino - Speak another language Native:
65.8% (1,496)Foreign-born:
98.0% (181)
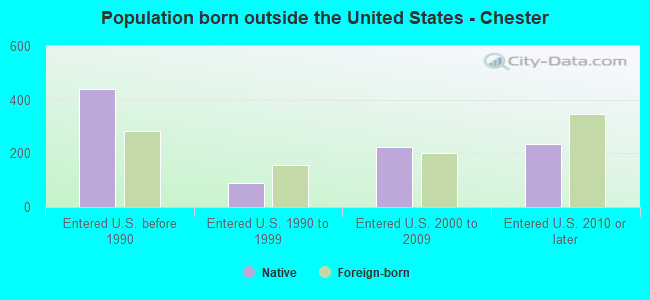
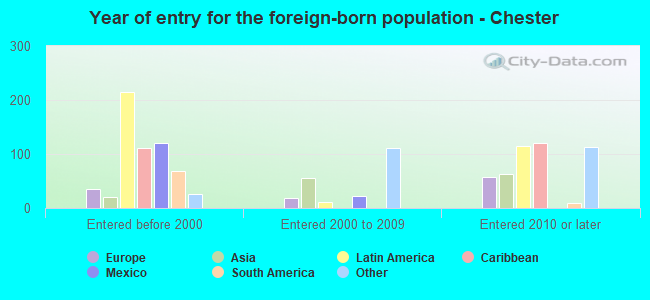
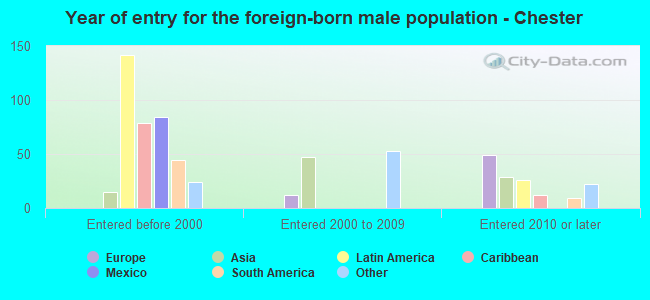
Foreign-born residents in Chester 1,107 residents are foreign born (1.5% Latin America , 0.8% Africa , 0.5% Asia , 0.4% Europe ).
This city:
3.4%Pennsylvania:
7.3%
Marital status for residents in Chester Marital status - White (Caucasian) population 15 years and over
Males 67.7% Never married15.6% Now married2.2% Separated2.1% Widowed12.4% DivorcedFemales 70.4% Never married16.5% Now married0.6% Separated5.7% Widowed6.8% DivorcedWomen who gave birth in the past 12 months Now married:
0.0% (0)Unmarried:
100.0% (54)
Women who did not give birth in the past 12 months Now married:
13.0% (171)Unmarried:
87.0% (1,140)
Marital status - Black or African American population 15 years and over
Males 64.2% Never married20.3% Now married3.3% Separated4.0% Widowed8.3% DivorcedFemales 61.9% Never married15.5% Now married3.5% Separated8.9% Widowed10.2% DivorcedWomen who gave birth in the past 12 months Now married:
59.7% (162)Unmarried:
40.3% (109)
Women who did not give birth in the past 12 months Now married:
11.9% (762)Unmarried:
88.1% (5,641)
Marital status - Asian population 15 years and over
Males 83.9% Never married16.1% Now married0.0% Separated0.0% Widowed0.0% DivorcedFemales 82.3% Never married17.7% Now married0.0% Separated0.0% Widowed0.0% DivorcedWomen who did not give birth in the past 12 months Now married:
16.2% (19)Unmarried:
83.8% (97)
Marital status - Other race population 15 years and over
Males 43.0% Never married31.8% Now married1.1% Separated1.5% Widowed22.5% DivorcedFemales 53.9% Never married20.7% Now married0.0% Separated15.2% Widowed10.2% DivorcedWomen who did not give birth in the past 12 months Now married:
14.6% (81)Unmarried:
85.4% (475)
Marital status - Two or more races population 15 years and over
Males 67.2% Never married20.3% Now married1.7% Separated2.8% Widowed8.1% DivorcedFemales 55.0% Never married7.9% Now married1.3% Separated17.0% Widowed18.8% DivorcedWomen who gave birth in the past 12 months Now married:
0.0% (0)Unmarried:
100.0% (11)
Women who did not give birth in the past 12 months Now married:
15.6% (40)Unmarried:
84.4% (215)
Marital status - White alone, not Hispanic / Latino population 15 years and over
Males 67.1% Never married15.5% Now married2.3% Separated2.2% Widowed12.8% DivorcedFemales 70.4% Never married16.0% Now married0.3% Separated6.2% Widowed7.1% DivorcedWomen who gave birth in the past 12 months Now married:
0.0% (0)Unmarried:
100.0% (32)
Women who did not give birth in the past 12 months Now married:
13.0% (155)Unmarried:
87.0% (1,041)
Marital status - Hispanic or Latino population 15 years and over
Males 48.8% Never married28.7% Now married2.3% Separated1.2% Widowed19.0% DivorcedFemales 53.7% Never married24.6% Now married0.8% Separated10.9% Widowed9.9% DivorcedWomen who gave birth in the past 12 months Now married:
58.9% (36)Unmarried:
41.1% (25)
Women who did not give birth in the past 12 months Now married:
14.3% (90)Unmarried:
85.7% (543)
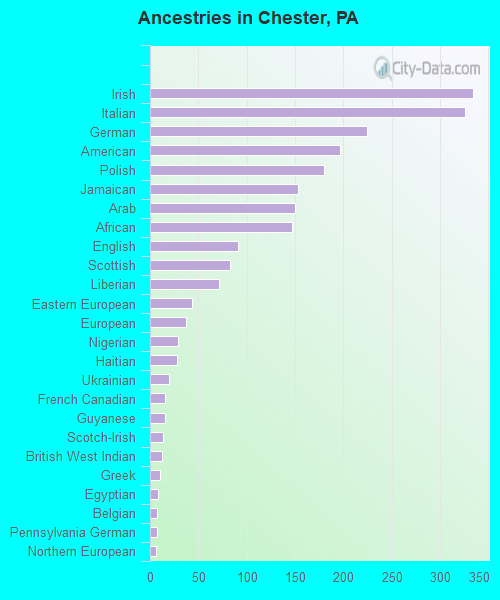
Ancestries in Chester
334 1.4% Irish326 1.3% Italian225 0.9% German197 0.8% American180 0.7% Polish153 0.6% Jamaican150 0.6% Arab147 0.6% African91 0.4% English83 0.3% Scottish71 0.3% Liberian43 0.2% Eastern European37 0.2% European29 0.1% Nigerian28 0.1% Haitian20 0.08% Ukrainian16 0.07% French Canadian16 0.07% Guyanese13 0.05% Scotch-Irish12 0.05% British West Indian10 0.04% Greek8 0.03% Egyptian7 0.03% Belgian7 0.03% Pennsylvania German6 0.02% Northern European2 0.01% Trinidadian and Tobagonian
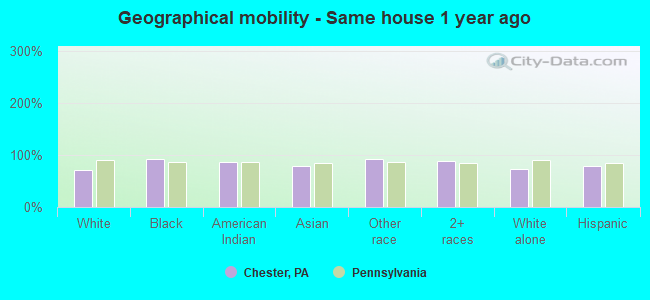
Geographical mobility in Chester Same house 1 year ago 3,360 71.0% White (Caucasian)22,665 91.9% Black or African American108 87.5% American Indian / Alaska Native173 79.6% Asian1,757 92.3% Other race1,430 89.6% Two or more races3,077 72.5% White alone, not Hispanic / Latino2,042 79.7% Hispanic or LatinoMoved within same county 640 13.5% White / Caucasian1,221 4.9% Black or African American16 12.8% American Indian / Alaska Native10 4.7% Asian25 1.3% Other race159 10.0% Two or more races479 11.3% White alone, not Hispanic / Latino406 15.9% Hispanic or LatinoMoved within same state 293 6.2% White / Caucasian528 2.1% Black or African American9 4.3% Asian124 6.5% Other race12 0.7% Two or more races296 7.0% White alone, not Hispanic / Latino135 5.3% Hispanic or LatinoMoved from different state 230 4.9% White / Caucasian377 1.5% Black or African American23 10.5% Asian14 0.9% Two or more races221 5.2% White alone, not Hispanic / Latino9 0.4% Hispanic or LatinoMoved from abroad 45 0.2% Black or African American6 2.6% Asian
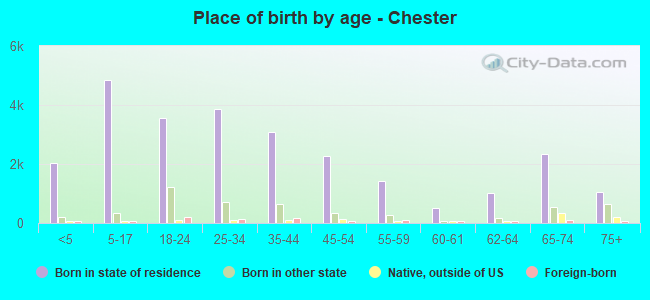
Children Nativity (place of birth) in Chester
Children under 6 years - Living with two parents Both parents native 408 100.0% NativeBoth parents foreign-born 37 100.0% NativeOne native, one foreign-born parent 4 100.0% NativeChildren under 6 years - Living with one parent Native parent 1,916 100.0% NativeChildren 6 to 17 years - Living with two parents Both parents native 616 100.0% NativeBoth parents foreign-born 28 100.0% NativeOne native, one foreign-born parent 54 100.0% NativeChildren 6 to 17 years - Living with one parent Native parent 3,305 99.1% Native32 0.9% Foreign-bornForeign-born parent 149 67.0% Native73 33.0% Foreign-born
Grandparents responsible for own grandchildren in Chester
Grandparents (30 to 59 years) White / Caucasian 6 100.0% Not responsible for grandchildrenBlack or African American 105 37.0% Responsible for grandchildren179 63.0% Not responsible for grandchildrenOther race 17 100.0% Responsible for grandchildrenHispanic or Latino 11 100.0% Not responsible for grandchildrenGrandparents (60 years and over) White / Caucasian 12 100.0% Not responsible for grandchildrenBlack or African American 115 43.9% Responsible for grandchildren147 56.1% Not responsible for grandchildrenOther race 34 100.0% Not responsible for grandchildrenHispanic or Latino 39 100.0% Not responsible for grandchildren