Races in Charleston, South Carolina (SC) Detailed Stats
Data:
Races - White alone (%)
Races - White alone (% change since 2000)
Races - Black alone (%)
Races - Black alone (% change since 2000)
Races - American Indian alone (%)
Races - American Indian alone (% change since 2000)
Races - Asian alone (%)
Races - Asian alone (% change since 2000)
Races - Hispanic (%)
Races - Hispanic (% change since 2000)
Races - Native Hawaiian and Other Pacific Islander alone (%)
Races - Native Hawaiian and Other Pacific Islander alone (% change since 2000)
Races - Two or more races(%)
Races - Two or more races(% change since 2000)
Races - Other race alone (%)
Races - Other race alone (% change since 2000)
Racial diversity
Place of birth - Born in state of residence (%)
Place of birth - Born in state of residence (%) - White
Place of birth - Born in state of residence (%) - Black or African American
Place of birth - Born in state of residence (%) - Asian
Place of birth - Born in state of residence (%) - Hispanic or Latino
Place of birth - Born in state of residence (%) - American Indian and Alaska Native
Place of birth - Born in state of residence (%) - Multirace
Place of birth - Born in state of residence (%) - Other Race
Place of birth - Born in other state (%)
Place of birth - Born in other state (%) - White
Place of birth - Born in other state (%) - Black or African American
Place of birth - Born in other state (%) - Asian
Place of birth - Born in other state (%) - Hispanic or Latino
Place of birth - Born in other state (%) - American Indian and Alaska Native
Place of birth - Born in other state (%) - Multirace
Place of birth - Born in other state (%) - Other Race
Place of birth - Native, outside of US (%)
Place of birth - Native, outside of US (%) - White
Place of birth - Native, outside of US (%) - Black or African American
Place of birth - Native, outside of US (%) - Asian
Place of birth - Native, outside of US (%) - Hispanic or Latino
Place of birth - Native, outside of US (%) - American Indian and Alaska Native
Place of birth - Native, outside of US (%) - Multirace
Place of birth - Native, outside of US (%) - Other Race
Place of birth - Foreign born (%)
Place of birth - Foreign born (%) - White
Place of birth - Foreign born (%) - Black or African American
Place of birth - Foreign born (%) - Asian
Place of birth - Foreign born (%) - Hispanic or Latino
Place of birth - Foreign born (%) - American Indian and Alaska Native
Place of birth - Foreign born (%) - Multirace
Place of birth - Foreign born (%) - Other Race
Residents speaking English at home (%)
Residents speaking English at home - Born in the United States (%)
Residents speaking English at home - Native, born elsewhere (%)
Residents speaking English at home - Foreign born (%)
Residents speaking Spanish at home (%)
Residents speaking Spanish at home - Born in the United States (%)
Residents speaking Spanish at home - Native, born elsewhere (%)
Residents speaking Spanish at home - Foreign born (%)
Residents speaking other language at home (%)
Residents speaking other language at home - Born in the United States (%)
Residents speaking other language at home - Native, born elsewhere (%)
Residents speaking other language at home - Foreign born (%)
Marital status - Never married (%)
Marital status - Now married (%)
Marital status - Separated (%)
Marital status - Widowed (%)
Marital status - Divorced (%)
Ancestries Reported - Arab (%)
Ancestries Reported - Czech (%)
Ancestries Reported - Danish (%)
Ancestries Reported - Dutch (%)
Ancestries Reported - English (%)
Ancestries Reported - French (%)
Ancestries Reported - French Canadian (%)
Ancestries Reported - German (%)
Ancestries Reported - Greek (%)
Ancestries Reported - Hungarian (%)
Ancestries Reported - Irish (%)
Ancestries Reported - Italian (%)
Ancestries Reported - Lithuanian (%)
Ancestries Reported - Norwegian (%)
Ancestries Reported - Polish (%)
Ancestries Reported - Portuguese (%)
Ancestries Reported - Russian (%)
Ancestries Reported - Scotch-Irish (%)
Ancestries Reported - Scottish (%)
Ancestries Reported - Slovak (%)
Ancestries Reported - Subsaharan African (%)
Ancestries Reported - Swedish (%)
Ancestries Reported - Swiss (%)
Ancestries Reported - Ukrainian (%)
Ancestries Reported - United States (%)
Ancestries Reported - Welsh (%)
Ancestries Reported - West Indian (%)
Ancestries Reported - Other (%)
Geographical mobility - Same house 1 year ago (%)
Geographical mobility - Same house 1 year ago (%) - White
Geographical mobility - Same house 1 year ago (%) - Black or African American
Geographical mobility - Same house 1 year ago (%) - Asian
Geographical mobility - Same house 1 year ago (%) - Hispanic or Latino
Geographical mobility - Same house 1 year ago (%) - American Indian and Alaska Native
Geographical mobility - Same house 1 year ago (%) - Multirace
Geographical mobility - Same house 1 year ago (%) - Other Race
Geographical mobility - Moved within same county (%)
Geographical mobility - Moved within same county (%) - White
Geographical mobility - Moved within same county (%) - Black or African American
Geographical mobility - Moved within same county (%) - Asian
Geographical mobility - Moved within same county (%) - Hispanic or Latino
Geographical mobility - Moved within same county (%) - American Indian and Alaska Native
Geographical mobility - Moved within same county (%) - Multirace
Geographical mobility - Moved within same county (%) - Other Race
Geographical mobility - Moved from different county within same state (%)
Geographical mobility - Moved from different county within same state (%) - White
Geographical mobility - Moved from different county within same state (%) - Black or African American
Geographical mobility - Moved from different county within same state (%) - Asian
Geographical mobility - Moved from different county within same state (%) - Hispanic or Latino
Geographical mobility - Moved from different county within same state (%) - American Indian and Alaska Native
Geographical mobility - Moved from different county within same state (%) - Multirace
Geographical mobility - Moved from different county within same state (%) - Other Race
Geographical mobility - Moved from different state (%)
Geographical mobility - Moved from different state (%) - White
Geographical mobility - Moved from different state (%) - Black or African American
Geographical mobility - Moved from different state (%) - Asian
Geographical mobility - Moved from different state (%) - Hispanic or Latino
Geographical mobility - Moved from different state (%) - American Indian and Alaska Native
Geographical mobility - Moved from different state (%) - Multirace
Geographical mobility - Moved from different state (%) - Other Race
Geographical mobility - Moved from abroad (%)
Geographical mobility - Moved from abroad (%) - White
Geographical mobility - Moved from abroad (%) - Black or African American
Geographical mobility - Moved from abroad (%) - Asian
Geographical mobility - Moved from abroad (%) - Hispanic or Latino
Geographical mobility - Moved from abroad (%) - American Indian and Alaska Native
Geographical mobility - Moved from abroad (%) - Multirace
Geographical mobility - Moved from abroad (%) - Other Race
Place of birth for the foreign-born population - Ireland (%)
Place of birth for the foreign-born population - Denmark (%)
Place of birth for the foreign-born population - Norway (%)
Place of birth for the foreign-born population - Sweden (%)
Place of birth for the foreign-born population - United Kingdom (%)
Place of birth for the foreign-born population - England (%)
Place of birth for the foreign-born population - Scotland (%)
Place of birth for the foreign-born population - Other Northern Europe (%)
Place of birth for the foreign-born population - Austria (%)
Place of birth for the foreign-born population - Belgium (%)
Place of birth for the foreign-born population - France (%)
Place of birth for the foreign-born population - Germany (%)
Place of birth for the foreign-born population - Netherlands (%)
Place of birth for the foreign-born population - Switzerland (%)
Place of birth for the foreign-born population - Other Western Europe (%)
Place of birth for the foreign-born population - Greece (%)
Place of birth for the foreign-born population - Italy (%)
Place of birth for the foreign-born population - Portugal (%)
Place of birth for the foreign-born population - Spain (%)
Place of birth for the foreign-born population - Other Southern Europe (%)
Place of birth for the foreign-born population - Albania (%)
Place of birth for the foreign-born population - Belarus (%)
Place of birth for the foreign-born population - Bosnia and Herzegovina (%)
Place of birth for the foreign-born population - Bulgaria (%)
Place of birth for the foreign-born population - Croatia (%)
Place of birth for the foreign-born population - Czechoslovakia (%)
Place of birth for the foreign-born population - Hungary (%)
Place of birth for the foreign-born population - Latvia (%)
Place of birth for the foreign-born population - Lithuania (%)
Place of birth for the foreign-born population - North Macedonia (Macedonia) (%)
Place of birth for the foreign-born population - Moldova (%)
Place of birth for the foreign-born population - Poland (%)
Place of birth for the foreign-born population - Romania (%)
Place of birth for the foreign-born population - Russia (%)
Place of birth for the foreign-born population - Serbia (%)
Place of birth for the foreign-born population - Ukraine (%)
Place of birth for the foreign-born population - Other Eastern Europe (%)
Place of birth for the foreign-born population - China (%)
Place of birth for the foreign-born population - Hong Kong (%)
Place of birth for the foreign-born population - Taiwan (%)
Place of birth for the foreign-born population - Japan (%)
Place of birth for the foreign-born population - Korea (%)
Place of birth for the foreign-born population - Other Eastern Asia (%)
Place of birth for the foreign-born population - Afghanistan (%)
Place of birth for the foreign-born population - Bangladesh (%)
Place of birth for the foreign-born population - India (%)
Place of birth for the foreign-born population - Iran (%)
Place of birth for the foreign-born population - Kazakhstan (%)
Place of birth for the foreign-born population - Nepal (%)
Place of birth for the foreign-born population - Pakistan (%)
Place of birth for the foreign-born population - Sri Lanka (%)
Place of birth for the foreign-born population - Uzbekistan (%)
Place of birth for the foreign-born population - Other South Central Asia (%)
Place of birth for the foreign-born population - Burma (%)
Place of birth for the foreign-born population - Cambodia (%)
Place of birth for the foreign-born population - Indonesia (%)
Place of birth for the foreign-born population - Laos (%)
Place of birth for the foreign-born population - Malaysia (%)
Place of birth for the foreign-born population - Philippines (%)
Place of birth for the foreign-born population - Singapore (%)
Place of birth for the foreign-born population - Thailand (%)
Place of birth for the foreign-born population - Vietnam (%)
Place of birth for the foreign-born population - Other South Eastern Asia (%)
Place of birth for the foreign-born population - Armenia (%)
Place of birth for the foreign-born population - Iraq (%)
Place of birth for the foreign-born population - Israel (%)
Place of birth for the foreign-born population - Jordan (%)
Place of birth for the foreign-born population - Kuwait (%)
Place of birth for the foreign-born population - Lebanon (%)
Place of birth for the foreign-born population - Saudi Arabia (%)
Place of birth for the foreign-born population - Syria (%)
Place of birth for the foreign-born population - Turkey (%)
Place of birth for the foreign-born population - Yemen (%)
Place of birth for the foreign-born population - Other Western Asia (%)
Place of birth for the foreign-born population - Eritrea (%)
Place of birth for the foreign-born population - Ethiopia (%)
Place of birth for the foreign-born population - Kenya (%)
Place of birth for the foreign-born population - Somalia (%)
Place of birth for the foreign-born population - Uganda (%)
Place of birth for the foreign-born population - Zimbabwe (%)
Place of birth for the foreign-born population - Other Eastern Africa (%)
Place of birth for the foreign-born population - Cameroon (%)
Place of birth for the foreign-born population - Congo (%)
Place of birth for the foreign-born population - Democratic Republic of Congo (Zaire) (%)
Place of birth for the foreign-born population - Other Middle Africa (%)
Place of birth for the foreign-born population - Egypt (%)
Place of birth for the foreign-born population - Morocco (%)
Place of birth for the foreign-born population - Sudan (%)
Place of birth for the foreign-born population - Other Northern Africa (%)
Place of birth for the foreign-born population - South Africa (%)
Place of birth for the foreign-born population - Other Southern Africa (%)
Place of birth for the foreign-born population - Cabo Verde (%)
Place of birth for the foreign-born population - Ghana (%)
Place of birth for the foreign-born population - Liberia (%)
Place of birth for the foreign-born population - Nigeria (%)
Place of birth for the foreign-born population - Senegal (%)
Place of birth for the foreign-born population - Sierra Leone (%)
Place of birth for the foreign-born population - Other Western Africa (%)
Place of birth for the foreign-born population - Australia (%)
Place of birth for the foreign-born population - New Zealand (%)
Place of birth for the foreign-born population - Fiji (%)
Place of birth for the foreign-born population - Micronesia (%)
Place of birth for the foreign-born population - Bahamas (%)
Place of birth for the foreign-born population - Barbados (%)
Place of birth for the foreign-born population - Cuba (%)
Place of birth for the foreign-born population - Dominica (%)
Place of birth for the foreign-born population - Dominican Republic (%)
Place of birth for the foreign-born population - Grenada (%)
Place of birth for the foreign-born population - Haiti (%)
Place of birth for the foreign-born population - Jamaica (%)
Place of birth for the foreign-born population - St. Vincent and the Grenadines (%)
Place of birth for the foreign-born population - Trinidad and Tobago (%)
Place of birth for the foreign-born population - West Indies (%)
Place of birth for the foreign-born population - Other Caribbean (%)
Place of birth for the foreign-born population - Belize (%)
Place of birth for the foreign-born population - Costa Rica (%)
Place of birth for the foreign-born population - El Salvador (%)
Place of birth for the foreign-born population - Guatemala (%)
Place of birth for the foreign-born population - Honduras (%)
Place of birth for the foreign-born population - Mexico (%)
Place of birth for the foreign-born population - Nicaragua (%)
Place of birth for the foreign-born population - Panama (%)
Place of birth for the foreign-born population - Other Central America (%)
Place of birth for the foreign-born population - Argentina (%)
Place of birth for the foreign-born population - Bolivia (%)
Place of birth for the foreign-born population - Brazil (%)
Place of birth for the foreign-born population - Chile (%)
Place of birth for the foreign-born population - Colombia (%)
Place of birth for the foreign-born population - Ecuador (%)
Place of birth for the foreign-born population - Guyana (%)
Place of birth for the foreign-born population - Peru (%)
Place of birth for the foreign-born population - Uruguay (%)
Place of birth for the foreign-born population - Venezuela (%)
Place of birth for the foreign-born population - Other South America (%)
Place of birth for the foreign-born population - Canada (%)
Place of birth for the foreign-born population - Other Northern America (%)
Place of birth for the foreign-born population - Other (%)
Latest news about races in Charleston, SC collected exclusively by city-data.com from local newspapers, TV, and radio stations
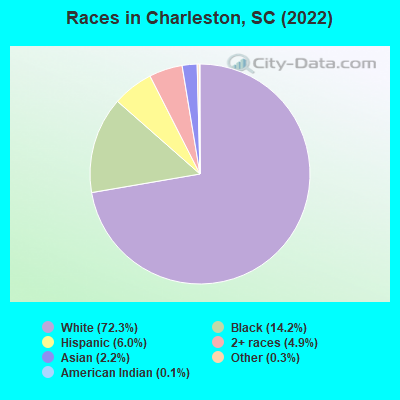
According to 2022 data, the most numerous races in Charleston, SC are White alone (111,177 residents), Black alone (21,883 residents), and Hispanic (9,151 residents). 91.2% of Charleston residents speak English at home. 5.3% of Charleston, SC residents are foreign-born (1.8% born in Latin America, 1.7% born in Asia, 1.3% born in Europe), which is 5.8% greater than the foreign-born rate of 5.0% across the entire state of South Carolina.
Race distribution in Charleston
2000 2022
2,652,291 66.1% White alone 1,178,486 29.4% Black alone 95,076 2.4% Hispanic 35,568 0.9% Asian alone 33,290 0.8% Two or more races 12,765 0.3% American Indian alone 3,266 0.08% Other race alone 1,270 0.03% Native Hawaiian and Other
3,301,739 62.5% White alone 1,313,290 24.9% Black alone 343,783 6.5% Hispanic 190,508 3.6% Two or more races 89,888 1.7% Asian alone 29,390 0.6% Other race alone 12,112 0.2% American Indian alone 1,924 0.04% Native Hawaiian and Other
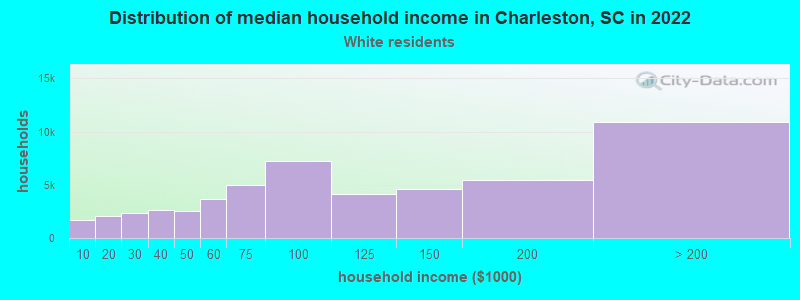
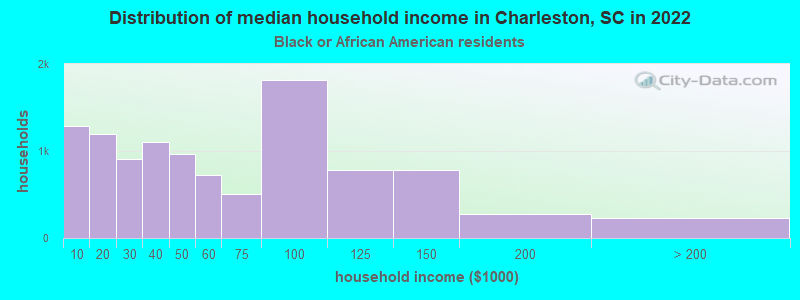
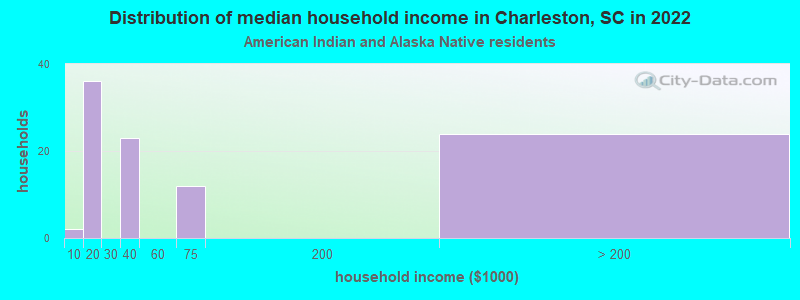
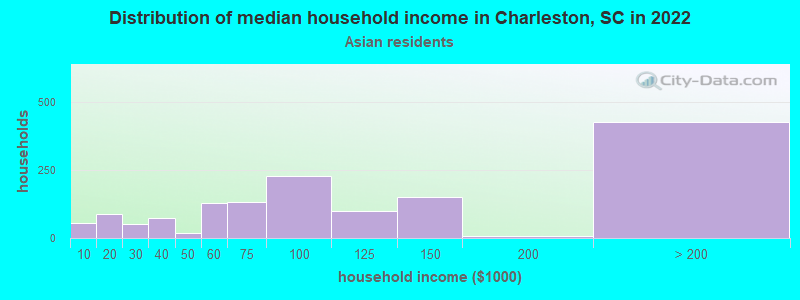
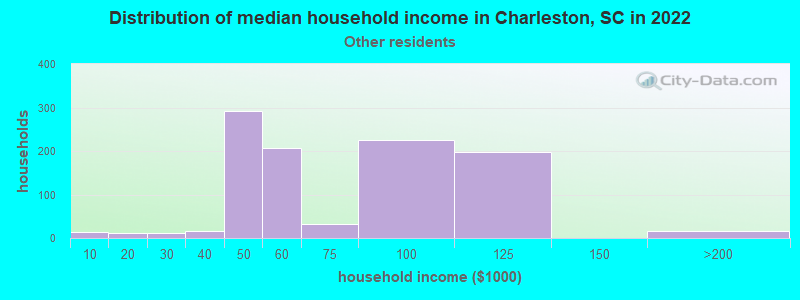
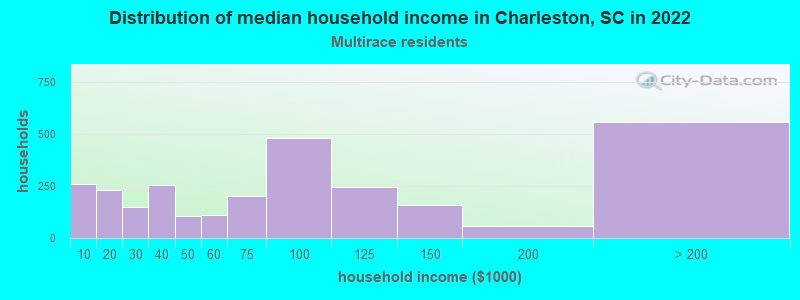
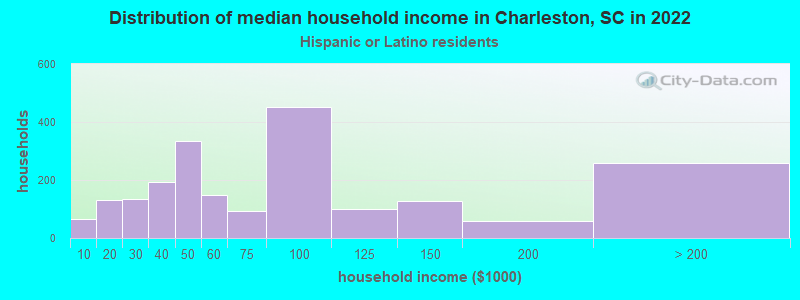
Income and house value in Charleston Median household income in 2022 $96,018 White non-Hispanic householders$44,591 Black householders$58,204 Asian householders$53,027 Some other race householders$53,520 Two or more races householders$80,521 Hispanic or Latino race householdersMedian 2022 house value $571,673 White Non-Hispanic householders$312,149 Black or African American householders$550,767 American Indian or Alaska Native householders $444,795 Asian householders$273,221 Some other race householders$420,645 Two or more races householders$490,572 Hispanic or Latino householders
Median age by race in Charleston
38.5 Median age for White residents37.1 40.0 40.3 Median age for Black or African American residents34.8 44.2 17.6 Median age for American Indian / Alaska Native residents15.8 36.2 41.5 Median age for Asian residents35.2 44.3 -666,666,666.0 Median age for Native Hawaiian / Pacific Islander residents-666,666,666.0 -666,666,666.0 31.5 Median age for Other race residents31.6 30.3 24.5 Median age for Two or more races residents25.0 24.2 38.6 Median age for White alone residents37.1 40.2 26.0 Median age for Hispanic or Latino residents19.7 32.8
Owner/renter occupied households by race in Charleston
House owners and renters - White residents 31,938 61.3% Owner occupied20,125 38.7% Renter occupiedHouse owners and renters - Black or African American residents 5,020 47.5% Owner occupied5,556 52.5% Renter occupiedHouse owners and renters - American Indian / Alaska Native residents 18 23.0% Owner occupied60 77.0% Renter occupiedHouse owners and renters - Asian residents 679 56.7% Owner occupied519 43.3% Renter occupiedHouse owners and renters - Native Hawaiian / Pacific Islander residents 20 33.1% Owner occupied40 66.9% Renter occupiedHouse owners and renters - Other race residents 209 28.6% Owner occupied522 71.4% Renter occupiedHouse owners and renters - Two or more races residents 904 24.6% Owner occupied2,777 75.4% Renter occupiedHouse owners and renters - White alone residents 31,895 61.8% Owner occupied19,754 38.2% Renter occupiedHouse owners and renters - Hispanic or Latino residents 625 32.1% Owner occupied1,323 67.9% Renter occupied
Language usage in Charleston
English speakers - Total 91.2% of residents of Charleston speak English at home.
5.4% of residents speak Spanish at home 6,593 81.4% Speak English very well1,505 18.6% Speak English less than very well3.4% of residents speak other language at home 4,033 79.7% Speak English very well1,027 20.3% Speak English less than very well
English speakers - Born in the United States 95.7% of residents of Charleston speak English at home.
2.3% of residents speak Spanish at home 1,532 83.9% Speak English very well294 16.1% Speak English less than very well1.9% of residents speak other language at home 1,261 83.0% Speak English very well258 17.0% Speak English less than very well
English speakers - Native, born elsewhere 73.6% of residents of Charleston speak English at home.
24.2% of residents speak Spanish at home 441 63.5% Speak English very well254 36.5% Speak English less than very well2.2% of residents speak other language at home 62 100.0% Speak English less than very well
English speakers - Foreign-born 28.1% of residents of Charleston speak English at home.
40.3% of residents speak Spanish at home 2,851 84.2% Speak English very well533 15.8% Speak English less than very well31.6% of residents speak other language at home 1,948 73.4% Speak English very well707 26.6% Speak English less than very well
White (Caucasian) - Speak only English Native:
98.3% (104,510)Foreign-born:
63.9% (1,396)
White (Caucasian) - Speak another language Native:
1.7% (1,847)Foreign-born:
36.1% (789)
Black or African American - Speak only English Native:
98.3% (24,684)Foreign-born:
57.4% (231)
Black or African American - Speak another language Native:
1.7% (427)Foreign-born:
23.2% (94)
American Indian / Alaska Native - Speak another language Native:
66.4% (176)Foreign-born:
100.0% (735)
Asian - Speak only English Native:
41.6% (719)Foreign-born:
22.1% (363)
Asian - Speak another language Native:
58.4% (1,011)Foreign-born:
77.9% (1,277)
Other race - Speak only English Native:
63.5% (1,111)Foreign-born:
28.1% (261)
Other race - Speak another language Native:
36.7% (643)Foreign-born:
77.2% (717)
Two or more races - Speak only English Native:
88.8% (8,237)Foreign-born:
24.8% (396)
Two or more races - Speak another language Native:
11.2% (1,038)Foreign-born:
75.2% (1,202)
White alone - Speak only English Native:
98.3% (103,470)Foreign-born:
64.8% (1,396)
White alone - Speak another language Native:
1.7% (1,765)Foreign-born:
35.2% (759)
Hispanic or Latino - Speak only English Native:
57.0% (3,047)Foreign-born:
6.9% (248)
Hispanic or Latino - Speak another language Native:
43.0% (2,294)Foreign-born:
93.1% (3,359)
Foreign-born residents in Charleston 8,144 residents are foreign born (1.8% Latin America , 1.7% Asia , 1.3% Europe ).
This city:
5.3%South Carolina:
5.3%
Marital status for residents in Charleston Marital status - White (Caucasian) population 15 years and over
Males 36.1% Never married54.5% Now married0.7% Separated1.1% Widowed7.6% DivorcedFemales 34.0% Never married45.7% Now married1.9% Separated4.6% Widowed13.8% DivorcedWomen who gave birth in the past 12 months Now married:
80.3% (723)Unmarried:
19.7% (177)
Women who did not give birth in the past 12 months Now married:
39.7% (12,170)Unmarried:
60.3% (18,477)
Marital status - Black or African American population 15 years and over
Males 60.1% Never married28.8% Now married0.9% Separated4.4% Widowed5.8% DivorcedFemales 48.2% Never married18.3% Now married1.8% Separated10.0% Widowed21.6% DivorcedWomen who gave birth in the past 12 months Now married:
11.8% (63)Unmarried:
88.2% (469)
Women who did not give birth in the past 12 months Now married:
20.3% (1,087)Unmarried:
79.7% (4,267)
Marital status - American Indian / Alaska Native population 15 years and over
Males 64.8% Never married4.8% Now married23.0% Separated0.0% Widowed7.4% DivorcedFemales 39.6% Never married30.7% Now married24.8% Separated0.0% Widowed5.0% DivorcedWomen who did not give birth in the past 12 months Now married:
57.4% (148)Unmarried:
42.6% (110)
Marital status - Asian population 15 years and over
Males 38.5% Never married51.7% Now married7.4% Separated0.0% Widowed2.3% DivorcedFemales 32.5% Never married51.6% Now married0.0% Separated5.2% Widowed10.8% DivorcedWomen who gave birth in the past 12 months Now married:
100.0% (63)Unmarried:
0.0% (0)
Women who did not give birth in the past 12 months Now married:
44.5% (489)Unmarried:
55.5% (611)
Marital status - Native Hawaiian / Pacific Islander population 15 years and over
Males 46.2% Never married53.8% Now married0.0% Separated0.0% Widowed0.0% DivorcedFemales 0.0% Never married87.5% Now married0.0% Separated12.5% Widowed0.0% DivorcedWomen who did not give birth in the past 12 months Now married:
100.0% (24)Unmarried:
0.0% (0)
Marital status - Other race population 15 years and over
Males 38.4% Never married57.0% Now married0.0% Separated0.0% Widowed4.6% DivorcedFemales 16.2% Never married59.5% Now married0.0% Separated10.4% Widowed14.0% DivorcedWomen who gave birth in the past 12 months Now married:
100.0% (81)Unmarried:
0.0% (0)
Women who did not give birth in the past 12 months Now married:
32.6% (162)Unmarried:
67.4% (336)
Marital status - Two or more races population 15 years and over
Males 67.5% Never married27.1% Now married0.9% Separated0.0% Widowed4.5% DivorcedFemales 66.2% Never married18.9% Now married0.0% Separated0.6% Widowed14.3% DivorcedWomen who gave birth in the past 12 months Now married:
100.0% (97)Unmarried:
0.0% (0)
Women who did not give birth in the past 12 months Now married:
20.1% (450)Unmarried:
79.9% (1,790)
Marital status - White alone, not Hispanic / Latino population 15 years and over
Males 36.0% Never married54.6% Now married0.7% Separated1.1% Widowed7.7% DivorcedFemales 33.9% Never married45.4% Now married1.9% Separated4.7% Widowed14.1% DivorcedWomen who gave birth in the past 12 months Now married:
80.3% (723)Unmarried:
19.7% (177)
Women who did not give birth in the past 12 months Now married:
39.2% (11,660)Unmarried:
60.8% (18,113)
Marital status - Hispanic or Latino population 15 years and over
Males 79.0% Never married21.0% Now married0.0% Separated0.0% Widowed0.0% DivorcedFemales 33.6% Never married42.2% Now married10.5% Separated2.9% Widowed10.8% DivorcedWomen who gave birth in the past 12 months Now married:
100.0% (172)Unmarried:
0.0% (0)
Women who did not give birth in the past 12 months Now married:
55.1% (1,527)Unmarried:
44.9% (1,245)
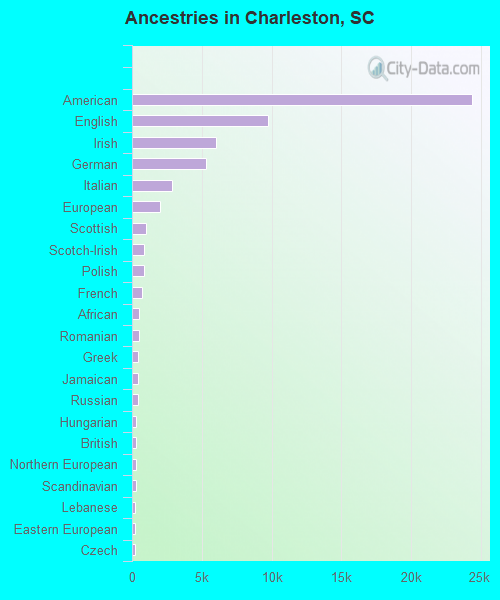
Ancestries in Charleston
24,346 28.2% American9,758 11.3% English6,007 7.0% Irish5,298 6.1% German2,840 3.3% Italian1,980 2.3% European974 1.1% Scottish894 1.0% Scotch-Irish894 1.0% Polish730 0.8% French526 0.6% African505 0.6% Romanian452 0.5% Greek415 0.5% Jamaican399 0.5% Russian314 0.4% Hungarian314 0.4% British307 0.4% Northern European295 0.3% Scandinavian250 0.3% Lebanese228 0.3% Eastern European227 0.3% Czech213 0.2% Welsh212 0.2% Swedish212 0.2% South African190 0.2% Norwegian183 0.2% French Canadian170 0.2% Palestinian166 0.2% Ukrainian134 0.2% Dutch113 0.1% Finnish98 0.1% Nigerian94 0.1% Slovak85 0.10% Austrian84 0.10% Egyptian78 0.09% Turkish70 0.08% Canadian59 0.07% Australian58 0.07% Iranian53 0.06% Portuguese53 0.06% Danish49 0.06% Trinidadian and Tobagonian40 0.05% Ethiopian39 0.05% Lithuanian36 0.04% Albanian33 0.04% Brazilian32 0.04% Swiss27 0.03% Armenian26 0.03% Alsatian23 0.03% Czechoslovakian23 0.03% Arab20 0.02% Jordanian19 0.02% Serbian18 0.02% Pennsylvania German15 0.02% Croatian14 0.02% Slavic12 0.01% Barbadian10 0.01% Syrian8 0.01% Cajun8 0.01% Belgian8 0.01% Basque5 0.01% Israeli5 0.01% Icelander5 0.01% Haitian
Geographical mobility in Charleston Same house 1 year ago 89,499 80.1% White (Caucasian)19,702 90.6% Black or African American917 93.5% American Indian / Alaska Native2,781 83.6% Asian214 100.0% Native Hawaiian / Pacific Islander2,178 76.0% Other race8,535 75.6% Two or more races88,629 80.2% White alone, not Hispanic / Latino6,436 71.1% Hispanic or LatinoMoved within same county 8,653 7.7% White / Caucasian927 4.3% Black or African American16 1.6% American Indian / Alaska Native247 7.4% Asian54 1.9% Other race258 2.3% Two or more races8,598 7.8% White alone, not Hispanic / Latino177 2.0% Hispanic or LatinoMoved within same state 3,781 3.4% White / Caucasian695 3.2% Black or African American258 7.8% Asian56 2.0% Other race1,071 9.5% Two or more races3,728 3.4% White alone, not Hispanic / Latino353 3.9% Hispanic or LatinoMoved from different state 9,407 8.4% White / Caucasian418 1.9% Black or African American27 2.7% American Indian / Alaska Native68 2.1% Asian629 21.9% Other race836 7.4% Two or more races9,233 8.4% White alone, not Hispanic / Latino1,308 14.4% Hispanic or LatinoMoved from abroad 365 0.3% White15 0.1% Black or African American28 0.8% Asian85 3.0% Other race591 5.2% Two or more races365 0.3% White alone, not Hispanic / Latino778 8.6% Hispanic or Latino
Children Nativity (place of birth) in Charleston
Children under 6 years - Living with two parents Both parents native 5,954 99.8% Native13 0.2% Foreign-bornBoth parents foreign-born 481 83.9% Native92 16.1% Foreign-bornOne native, one foreign-born parent 467 100.0% NativeChildren under 6 years - Living with one parent Native parent 1,797 100.0% NativeForeign-born parent 393 100.0% NativeChildren 6 to 17 years - Living with two parents Both parents native 8,253 99.1% Native76 0.9% Foreign-bornBoth parents foreign-born 325 70.0% Native139 30.0% Foreign-bornOne native, one foreign-born parent 1,782 94.6% Native102 5.4% Foreign-bornChildren 6 to 17 years - Living with one parent Native parent 3,839 97.7% Native92 2.3% Foreign-bornForeign-born parent 388 73.9% Native137 26.1% Foreign-born
Grandparents responsible for own grandchildren in Charleston
Grandparents (30 to 59 years) White / Caucasian 40 22.8% Responsible for grandchildren136 77.2% Not responsible for grandchildrenBlack or African American 88 50.8% Responsible for grandchildren85 49.2% Not responsible for grandchildrenTwo or more races 9 100.0% Responsible for grandchildrenWhite alone, not Hispanic / Latino 41 23.2% Responsible for grandchildren134 76.8% Not responsible for grandchildrenGrandparents (60 years and over) White / Caucasian 163 34.6% Responsible for grandchildren308 65.4% Not responsible for grandchildrenBlack or African American 85 21.6% Responsible for grandchildren308 78.4% Not responsible for grandchildrenTwo or more races 62 100.0% Responsible for grandchildrenWhite alone, not Hispanic / Latino 165 34.3% Responsible for grandchildren317 65.7% Not responsible for grandchildren
Zip codes: 29401 , 29403 , 29405 , 29407 , 29409 , 29412 , 29414 , 29424 , 29445 , 29450 , 29455 , 29464 , 29487 , 29492 .