Races in Centralia, Illinois (IL) Detailed Stats
Data:
Races - White alone (%)
Races - White alone (% change since 2000)
Races - Black alone (%)
Races - Black alone (% change since 2000)
Races - American Indian alone (%)
Races - American Indian alone (% change since 2000)
Races - Asian alone (%)
Races - Asian alone (% change since 2000)
Races - Hispanic (%)
Races - Hispanic (% change since 2000)
Races - Native Hawaiian and Other Pacific Islander alone (%)
Races - Native Hawaiian and Other Pacific Islander alone (% change since 2000)
Races - Two or more races(%)
Races - Two or more races(% change since 2000)
Races - Other race alone (%)
Races - Other race alone (% change since 2000)
Racial diversity
Place of birth - Born in state of residence (%)
Place of birth - Born in state of residence (%) - White
Place of birth - Born in state of residence (%) - Black or African American
Place of birth - Born in state of residence (%) - Asian
Place of birth - Born in state of residence (%) - Hispanic or Latino
Place of birth - Born in state of residence (%) - American Indian and Alaska Native
Place of birth - Born in state of residence (%) - Multirace
Place of birth - Born in state of residence (%) - Other Race
Place of birth - Born in other state (%)
Place of birth - Born in other state (%) - White
Place of birth - Born in other state (%) - Black or African American
Place of birth - Born in other state (%) - Asian
Place of birth - Born in other state (%) - Hispanic or Latino
Place of birth - Born in other state (%) - American Indian and Alaska Native
Place of birth - Born in other state (%) - Multirace
Place of birth - Born in other state (%) - Other Race
Place of birth - Native, outside of US (%)
Place of birth - Native, outside of US (%) - White
Place of birth - Native, outside of US (%) - Black or African American
Place of birth - Native, outside of US (%) - Asian
Place of birth - Native, outside of US (%) - Hispanic or Latino
Place of birth - Native, outside of US (%) - American Indian and Alaska Native
Place of birth - Native, outside of US (%) - Multirace
Place of birth - Native, outside of US (%) - Other Race
Place of birth - Foreign born (%)
Place of birth - Foreign born (%) - White
Place of birth - Foreign born (%) - Black or African American
Place of birth - Foreign born (%) - Asian
Place of birth - Foreign born (%) - Hispanic or Latino
Place of birth - Foreign born (%) - American Indian and Alaska Native
Place of birth - Foreign born (%) - Multirace
Place of birth - Foreign born (%) - Other Race
Residents speaking English at home (%)
Residents speaking English at home - Born in the United States (%)
Residents speaking English at home - Native, born elsewhere (%)
Residents speaking English at home - Foreign born (%)
Residents speaking Spanish at home (%)
Residents speaking Spanish at home - Born in the United States (%)
Residents speaking Spanish at home - Native, born elsewhere (%)
Residents speaking Spanish at home - Foreign born (%)
Residents speaking other language at home (%)
Residents speaking other language at home - Born in the United States (%)
Residents speaking other language at home - Native, born elsewhere (%)
Residents speaking other language at home - Foreign born (%)
Marital status - Never married (%)
Marital status - Now married (%)
Marital status - Separated (%)
Marital status - Widowed (%)
Marital status - Divorced (%)
Ancestries Reported - Arab (%)
Ancestries Reported - Czech (%)
Ancestries Reported - Danish (%)
Ancestries Reported - Dutch (%)
Ancestries Reported - English (%)
Ancestries Reported - French (%)
Ancestries Reported - French Canadian (%)
Ancestries Reported - German (%)
Ancestries Reported - Greek (%)
Ancestries Reported - Hungarian (%)
Ancestries Reported - Irish (%)
Ancestries Reported - Italian (%)
Ancestries Reported - Lithuanian (%)
Ancestries Reported - Norwegian (%)
Ancestries Reported - Polish (%)
Ancestries Reported - Portuguese (%)
Ancestries Reported - Russian (%)
Ancestries Reported - Scotch-Irish (%)
Ancestries Reported - Scottish (%)
Ancestries Reported - Slovak (%)
Ancestries Reported - Subsaharan African (%)
Ancestries Reported - Swedish (%)
Ancestries Reported - Swiss (%)
Ancestries Reported - Ukrainian (%)
Ancestries Reported - United States (%)
Ancestries Reported - Welsh (%)
Ancestries Reported - West Indian (%)
Ancestries Reported - Other (%)
Geographical mobility - Same house 1 year ago (%)
Geographical mobility - Same house 1 year ago (%) - White
Geographical mobility - Same house 1 year ago (%) - Black or African American
Geographical mobility - Same house 1 year ago (%) - Asian
Geographical mobility - Same house 1 year ago (%) - Hispanic or Latino
Geographical mobility - Same house 1 year ago (%) - American Indian and Alaska Native
Geographical mobility - Same house 1 year ago (%) - Multirace
Geographical mobility - Same house 1 year ago (%) - Other Race
Geographical mobility - Moved within same county (%)
Geographical mobility - Moved within same county (%) - White
Geographical mobility - Moved within same county (%) - Black or African American
Geographical mobility - Moved within same county (%) - Asian
Geographical mobility - Moved within same county (%) - Hispanic or Latino
Geographical mobility - Moved within same county (%) - American Indian and Alaska Native
Geographical mobility - Moved within same county (%) - Multirace
Geographical mobility - Moved within same county (%) - Other Race
Geographical mobility - Moved from different county within same state (%)
Geographical mobility - Moved from different county within same state (%) - White
Geographical mobility - Moved from different county within same state (%) - Black or African American
Geographical mobility - Moved from different county within same state (%) - Asian
Geographical mobility - Moved from different county within same state (%) - Hispanic or Latino
Geographical mobility - Moved from different county within same state (%) - American Indian and Alaska Native
Geographical mobility - Moved from different county within same state (%) - Multirace
Geographical mobility - Moved from different county within same state (%) - Other Race
Geographical mobility - Moved from different state (%)
Geographical mobility - Moved from different state (%) - White
Geographical mobility - Moved from different state (%) - Black or African American
Geographical mobility - Moved from different state (%) - Asian
Geographical mobility - Moved from different state (%) - Hispanic or Latino
Geographical mobility - Moved from different state (%) - American Indian and Alaska Native
Geographical mobility - Moved from different state (%) - Multirace
Geographical mobility - Moved from different state (%) - Other Race
Geographical mobility - Moved from abroad (%)
Geographical mobility - Moved from abroad (%) - White
Geographical mobility - Moved from abroad (%) - Black or African American
Geographical mobility - Moved from abroad (%) - Asian
Geographical mobility - Moved from abroad (%) - Hispanic or Latino
Geographical mobility - Moved from abroad (%) - American Indian and Alaska Native
Geographical mobility - Moved from abroad (%) - Multirace
Geographical mobility - Moved from abroad (%) - Other Race
Place of birth for the foreign-born population - Ireland (%)
Place of birth for the foreign-born population - Denmark (%)
Place of birth for the foreign-born population - Norway (%)
Place of birth for the foreign-born population - Sweden (%)
Place of birth for the foreign-born population - United Kingdom (%)
Place of birth for the foreign-born population - England (%)
Place of birth for the foreign-born population - Scotland (%)
Place of birth for the foreign-born population - Other Northern Europe (%)
Place of birth for the foreign-born population - Austria (%)
Place of birth for the foreign-born population - Belgium (%)
Place of birth for the foreign-born population - France (%)
Place of birth for the foreign-born population - Germany (%)
Place of birth for the foreign-born population - Netherlands (%)
Place of birth for the foreign-born population - Switzerland (%)
Place of birth for the foreign-born population - Other Western Europe (%)
Place of birth for the foreign-born population - Greece (%)
Place of birth for the foreign-born population - Italy (%)
Place of birth for the foreign-born population - Portugal (%)
Place of birth for the foreign-born population - Spain (%)
Place of birth for the foreign-born population - Other Southern Europe (%)
Place of birth for the foreign-born population - Albania (%)
Place of birth for the foreign-born population - Belarus (%)
Place of birth for the foreign-born population - Bosnia and Herzegovina (%)
Place of birth for the foreign-born population - Bulgaria (%)
Place of birth for the foreign-born population - Croatia (%)
Place of birth for the foreign-born population - Czechoslovakia (%)
Place of birth for the foreign-born population - Hungary (%)
Place of birth for the foreign-born population - Latvia (%)
Place of birth for the foreign-born population - Lithuania (%)
Place of birth for the foreign-born population - North Macedonia (Macedonia) (%)
Place of birth for the foreign-born population - Moldova (%)
Place of birth for the foreign-born population - Poland (%)
Place of birth for the foreign-born population - Romania (%)
Place of birth for the foreign-born population - Russia (%)
Place of birth for the foreign-born population - Serbia (%)
Place of birth for the foreign-born population - Ukraine (%)
Place of birth for the foreign-born population - Other Eastern Europe (%)
Place of birth for the foreign-born population - China (%)
Place of birth for the foreign-born population - Hong Kong (%)
Place of birth for the foreign-born population - Taiwan (%)
Place of birth for the foreign-born population - Japan (%)
Place of birth for the foreign-born population - Korea (%)
Place of birth for the foreign-born population - Other Eastern Asia (%)
Place of birth for the foreign-born population - Afghanistan (%)
Place of birth for the foreign-born population - Bangladesh (%)
Place of birth for the foreign-born population - India (%)
Place of birth for the foreign-born population - Iran (%)
Place of birth for the foreign-born population - Kazakhstan (%)
Place of birth for the foreign-born population - Nepal (%)
Place of birth for the foreign-born population - Pakistan (%)
Place of birth for the foreign-born population - Sri Lanka (%)
Place of birth for the foreign-born population - Uzbekistan (%)
Place of birth for the foreign-born population - Other South Central Asia (%)
Place of birth for the foreign-born population - Burma (%)
Place of birth for the foreign-born population - Cambodia (%)
Place of birth for the foreign-born population - Indonesia (%)
Place of birth for the foreign-born population - Laos (%)
Place of birth for the foreign-born population - Malaysia (%)
Place of birth for the foreign-born population - Philippines (%)
Place of birth for the foreign-born population - Singapore (%)
Place of birth for the foreign-born population - Thailand (%)
Place of birth for the foreign-born population - Vietnam (%)
Place of birth for the foreign-born population - Other South Eastern Asia (%)
Place of birth for the foreign-born population - Armenia (%)
Place of birth for the foreign-born population - Iraq (%)
Place of birth for the foreign-born population - Israel (%)
Place of birth for the foreign-born population - Jordan (%)
Place of birth for the foreign-born population - Kuwait (%)
Place of birth for the foreign-born population - Lebanon (%)
Place of birth for the foreign-born population - Saudi Arabia (%)
Place of birth for the foreign-born population - Syria (%)
Place of birth for the foreign-born population - Turkey (%)
Place of birth for the foreign-born population - Yemen (%)
Place of birth for the foreign-born population - Other Western Asia (%)
Place of birth for the foreign-born population - Eritrea (%)
Place of birth for the foreign-born population - Ethiopia (%)
Place of birth for the foreign-born population - Kenya (%)
Place of birth for the foreign-born population - Somalia (%)
Place of birth for the foreign-born population - Uganda (%)
Place of birth for the foreign-born population - Zimbabwe (%)
Place of birth for the foreign-born population - Other Eastern Africa (%)
Place of birth for the foreign-born population - Cameroon (%)
Place of birth for the foreign-born population - Congo (%)
Place of birth for the foreign-born population - Democratic Republic of Congo (Zaire) (%)
Place of birth for the foreign-born population - Other Middle Africa (%)
Place of birth for the foreign-born population - Egypt (%)
Place of birth for the foreign-born population - Morocco (%)
Place of birth for the foreign-born population - Sudan (%)
Place of birth for the foreign-born population - Other Northern Africa (%)
Place of birth for the foreign-born population - South Africa (%)
Place of birth for the foreign-born population - Other Southern Africa (%)
Place of birth for the foreign-born population - Cabo Verde (%)
Place of birth for the foreign-born population - Ghana (%)
Place of birth for the foreign-born population - Liberia (%)
Place of birth for the foreign-born population - Nigeria (%)
Place of birth for the foreign-born population - Senegal (%)
Place of birth for the foreign-born population - Sierra Leone (%)
Place of birth for the foreign-born population - Other Western Africa (%)
Place of birth for the foreign-born population - Australia (%)
Place of birth for the foreign-born population - New Zealand (%)
Place of birth for the foreign-born population - Fiji (%)
Place of birth for the foreign-born population - Micronesia (%)
Place of birth for the foreign-born population - Bahamas (%)
Place of birth for the foreign-born population - Barbados (%)
Place of birth for the foreign-born population - Cuba (%)
Place of birth for the foreign-born population - Dominica (%)
Place of birth for the foreign-born population - Dominican Republic (%)
Place of birth for the foreign-born population - Grenada (%)
Place of birth for the foreign-born population - Haiti (%)
Place of birth for the foreign-born population - Jamaica (%)
Place of birth for the foreign-born population - St. Vincent and the Grenadines (%)
Place of birth for the foreign-born population - Trinidad and Tobago (%)
Place of birth for the foreign-born population - West Indies (%)
Place of birth for the foreign-born population - Other Caribbean (%)
Place of birth for the foreign-born population - Belize (%)
Place of birth for the foreign-born population - Costa Rica (%)
Place of birth for the foreign-born population - El Salvador (%)
Place of birth for the foreign-born population - Guatemala (%)
Place of birth for the foreign-born population - Honduras (%)
Place of birth for the foreign-born population - Mexico (%)
Place of birth for the foreign-born population - Nicaragua (%)
Place of birth for the foreign-born population - Panama (%)
Place of birth for the foreign-born population - Other Central America (%)
Place of birth for the foreign-born population - Argentina (%)
Place of birth for the foreign-born population - Bolivia (%)
Place of birth for the foreign-born population - Brazil (%)
Place of birth for the foreign-born population - Chile (%)
Place of birth for the foreign-born population - Colombia (%)
Place of birth for the foreign-born population - Ecuador (%)
Place of birth for the foreign-born population - Guyana (%)
Place of birth for the foreign-born population - Peru (%)
Place of birth for the foreign-born population - Uruguay (%)
Place of birth for the foreign-born population - Venezuela (%)
Place of birth for the foreign-born population - Other South America (%)
Place of birth for the foreign-born population - Canada (%)
Place of birth for the foreign-born population - Other Northern America (%)
Place of birth for the foreign-born population - Other (%)
Latest news about races in Centralia, IL collected exclusively by city-data.com from local newspapers, TV, and radio stations
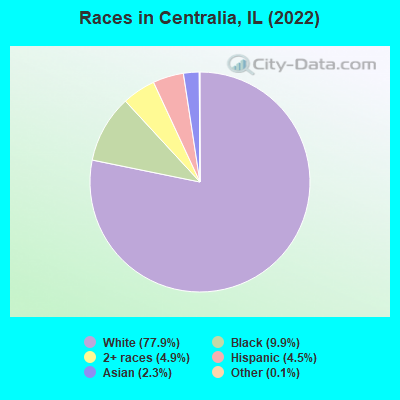
According to 2022 data, the most numerous races in Centralia, IL are White alone (9,287 residents), Hispanic (536 residents), and Black alone (1,177 residents). 94.8% of Centralia residents speak English at home. 3.4% of Centralia, IL residents are foreign-born (1.8% born in Asia, 1.4% born in Latin America), which is 307.4% less than the foreign-born rate of 14.0% across the entire state of Illinois.
Race distribution in Centralia
2000 2022
8,424,140 67.8% White alone 1,856,152 14.9% Black alone 1,530,262 12.3% Hispanic 419,916 3.4% Asian alone 153,996 1.2% Two or more races 13,479 0.1% Other race alone 18,232 0.1% American Indian alone 3,116 0.03% Native Hawaiian and Other
7,356,301 58.5% White alone 2,299,726 18.3% Hispanic 1,660,423 13.2% Black alone 747,296 5.9% Asian alone 458,599 3.6% Two or more races 45,386 0.4% Other race alone 10,405 0.08% American Indian alone 3,896 0.03% Native Hawaiian and Other
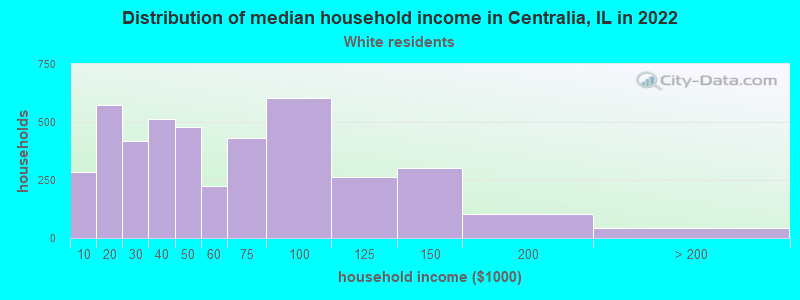
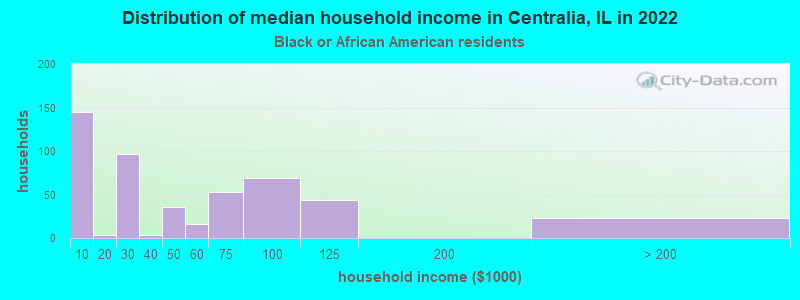
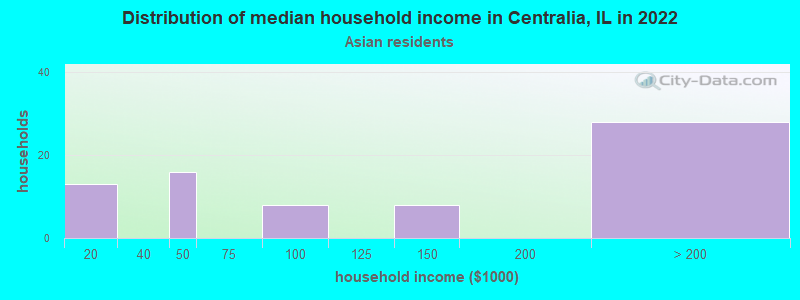
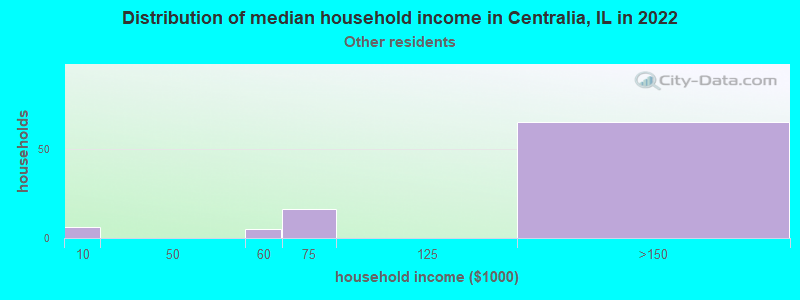
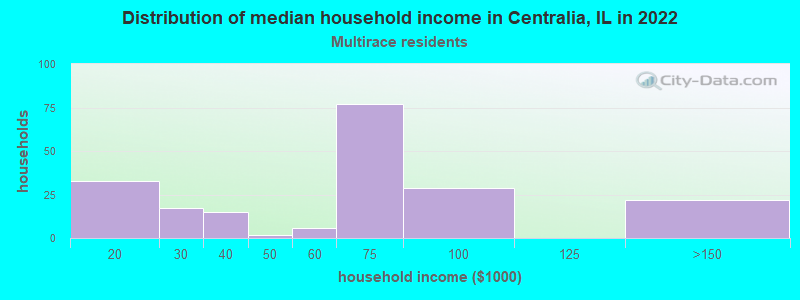
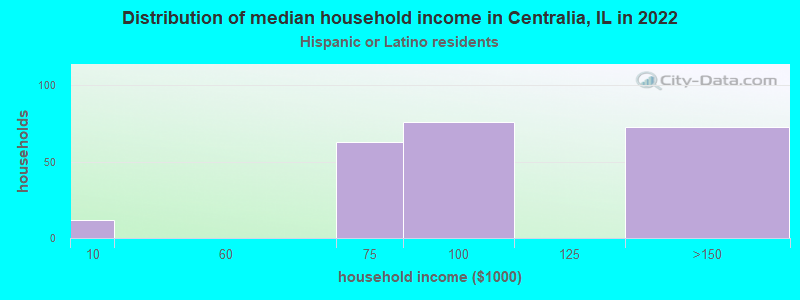
Income and house value in Centralia Median household income in 2022 $43,457 White non-Hispanic householders$38,666 Black householders$154,250 Some other race householders$68,015 Two or more races householders$95,833 Hispanic or Latino race householdersMedian 2022 house value $93,187 White Non-Hispanic householders$64,954 Black or African American householders $238,412 Asian householders$119,944 Native Hawaiian and other Pacific Islander householders$75,288 Some other race householders$85,806 Two or more races householders$112,563 Hispanic or Latino householders
Median age by race in Centralia
44.3 Median age for White residents41.1 50.6 28.5 Median age for Black or African American residents29.6 28.5 -696,696,696.0 Median age for American Indian / Alaska Native residents-720,238,094.5 -688,956,432.9 53.6 Median age for Asian residents33.7 54.1 -593,236,714.4 Median age for Native Hawaiian / Pacific Islander residents-658,536,584.7 -576,015,108.0 45.5 Median age for Other race residents46.2 42.3 16.1 Median age for Two or more races residents15.8 17.4 44.0 Median age for White alone residents40.2 50.4 37.7 Median age for Hispanic or Latino residents45.5 19.6
Owner/renter occupied households by race in Centralia
House owners and renters - White residents 2,866 68.4% Owner occupied1,321 31.6% Renter occupiedHouse owners and renters - Black or African American residents 225 47.0% Owner occupied253 53.0% Renter occupiedHouse owners and renters - American Indian / Alaska Native residents 7 100.0% Owner occupiedHouse owners and renters - Asian residents 47 64.1% Owner occupied27 35.9% Renter occupiedHouse owners and renters - Other race residents 75 79.8% Owner occupied19 20.2% Renter occupiedHouse owners and renters - Two or more races residents 87 44.4% Owner occupied110 55.6% Renter occupiedHouse owners and renters - White alone residents 2,874 67.4% Owner occupied1,392 32.6% Renter occupiedHouse owners and renters - Hispanic or Latino residents 153 70.3% Owner occupied65 29.7% Renter occupied
Language usage in Centralia
English speakers - Total 94.8% of residents of Centralia speak English at home.
2.3% of residents speak Spanish at home 144 56.5% Speak English very well111 43.5% Speak English less than very well2.4% of residents speak other language at home 113 42.3% Speak English very well154 57.7% Speak English less than very well
English speakers - Born in the United States 97.6% of residents of Centralia speak English at home.
1.4% of residents speak Spanish at home 24 80.0% Speak English very well6 20.0% Speak English less than very well0.7% of residents speak other language at home 3 20.0% Speak English very well12 80.0% Speak English less than very well
English speakers - Native, born elsewhere 68.6% of residents of Centralia speak English at home.
25.5% of residents speak Spanish at home 13 100.0% Speak English very well5.9% of residents speak other language at home 3 100.0% Speak English very well
English speakers - Foreign-born 14.9% of residents of Centralia speak English at home.
37.8% of residents speak Spanish at home 61 39.4% Speak English very well94 60.6% Speak English less than very well46.6% of residents speak other language at home 91 47.6% Speak English very well100 52.4% Speak English less than very well
White (Caucasian) - Speak only English Native:
100.0% (8,554)Foreign-born:
55.5% (24)
White (Caucasian) - Speak another language Native:
0.5% (40)Foreign-born:
49.0% (21)
Black or African American - Speak only English Native:
100.0% (1,136)Foreign-born:
100.0% (10)
Asian - Speak only English Native:
30.8% (25)Foreign-born:
12.1% (23)
Asian - Speak another language Native:
69.9% (57)Foreign-born:
87.7% (167)
Other race - Speak another language Native:
48.4% (17)Foreign-born:
99.9% (108)
Two or more races - Speak another language Native:
11.1% (72)Foreign-born:
100.0% (92)
White alone - Speak only English Native:
99.2% (8,622)Foreign-born:
46.4% (26)
White alone - Speak another language Native:
0.7% (58)Foreign-born:
50.9% (28)
Hispanic or Latino - Speak another language Native:
17.1% (47)Foreign-born:
100.0% (156)
Foreign-born residents in Centralia 410 residents are foreign born (1.8% Asia , 1.4% Latin America ).
This city:
3.4%Illinois:
14.1%
Marital status for residents in Centralia Marital status - White (Caucasian) population 15 years and over
Males 32.1% Never married44.8% Now married2.3% Separated5.3% Widowed15.5% DivorcedFemales 25.8% Never married37.4% Now married3.0% Separated15.1% Widowed18.6% DivorcedWomen who gave birth in the past 12 months Now married:
73.0% (58)Unmarried:
27.0% (21)
Women who did not give birth in the past 12 months Now married:
34.8% (538)Unmarried:
65.2% (1,007)
Marital status - Black or African American population 15 years and over
Males 60.8% Never married30.4% Now married0.9% Separated0.0% Widowed7.9% DivorcedFemales 47.3% Never married35.1% Now married0.0% Separated8.2% Widowed9.5% DivorcedWomen who gave birth in the past 12 months Now married:
100.0% (44)Unmarried:
0.0% (0)
Women who did not give birth in the past 12 months Now married:
4.7% (12)Unmarried:
95.3% (250)
Marital status - Asian population 15 years and over
Males 42.8% Never married57.2% Now married0.0% Separated0.0% Widowed0.0% DivorcedFemales 25.2% Never married72.4% Now married0.0% Separated2.4% Widowed0.0% DivorcedWomen who gave birth in the past 12 months Now married:
100.0% (16)Unmarried:
0.0% (0)
Women who did not give birth in the past 12 months Now married:
0.0% (0)Unmarried:
100.0% (32)
Marital status - Other race population 15 years and over
Males 38.0% Never married62.0% Now married0.0% Separated0.0% Widowed0.0% DivorcedFemales 11.1% Never married88.9% Now married0.0% Separated0.0% Widowed0.0% DivorcedWomen who did not give birth in the past 12 months Now married:
88.9% (47)Unmarried:
11.1% (6)
Marital status - Two or more races population 15 years and over
Males 41.4% Never married29.7% Now married4.7% Separated0.8% Widowed23.4% DivorcedFemales 49.7% Never married44.6% Now married0.0% Separated2.5% Widowed3.2% DivorcedWomen who did not give birth in the past 12 months Now married:
43.7% (76)Unmarried:
56.3% (97)
Marital status - White alone, not Hispanic / Latino population 15 years and over
Males 32.2% Never married44.2% Now married2.4% Separated5.4% Widowed15.7% DivorcedFemales 25.3% Never married37.7% Now married3.0% Separated15.2% Widowed18.8% DivorcedWomen who gave birth in the past 12 months Now married:
73.0% (62)Unmarried:
27.0% (23)
Women who did not give birth in the past 12 months Now married:
35.4% (574)Unmarried:
64.6% (1,045)
Marital status - Hispanic or Latino population 15 years and over
Males 28.9% Never married54.3% Now married0.0% Separated0.0% Widowed16.8% DivorcedFemales 40.5% Never married59.5% Now married0.0% Separated0.0% Widowed0.0% DivorcedWomen who did not give birth in the past 12 months Now married:
54.2% (72)Unmarried:
45.8% (61)
Ancestries in Centralia
1,094 20.0% German669 12.2% American565 10.3% Irish488 8.9% English166 3.0% Scotch-Irish98 1.8% European98 1.8% Lithuanian71 1.3% Polish39 0.7% French36 0.7% Swiss26 0.5% Scottish24 0.4% Italian18 0.3% Greek16 0.3% Swedish15 0.3% British14 0.3% Iraqi13 0.2% Welsh10 0.2% Jamaican8 0.1% Egyptian7 0.1% Dutch5 0.09% African4 0.07% Danish4 0.07% French Canadian3 0.05% Czech
Children Nativity (place of birth) in Centralia
Children under 6 years - Living with two parents Both parents native 286 100.0% NativeChildren under 6 years - Living with one parent Native parent 503 100.0% Native
Children 6 to 17 years - Living with two parents Both parents native 803 100.0% NativeBoth parents foreign-born 52 100.0% NativeChildren 6 to 17 years - Living with one parent Native parent 805 100.0% Native
Grandparents responsible for own grandchildren in Centralia
Grandparents (30 to 59 years) White / Caucasian 34 93.3% Responsible for grandchildren2 6.7% Not responsible for grandchildrenBlack or African American 35 100.0% Responsible for grandchildrenWhite alone, not Hispanic / Latino 37 92.6% Responsible for grandchildren3 7.4% Not responsible for grandchildrenGrandparents (60 years and over) White / Caucasian 67 55.4% Responsible for grandchildren54 44.6% Not responsible for grandchildrenBlack or African American 13 100.0% Responsible for grandchildrenWhite alone, not Hispanic / Latino 72 54.3% Responsible for grandchildren61 45.7% Not responsible for grandchildren