Races in Central Whidbey, Washington (WA) Detailed Stats
Ancestries, Foreign-born residents, place of birth
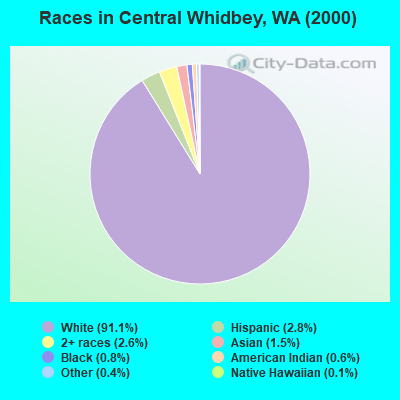
Race distribution in Central Whidbey

- 9,85491.1%White alone
- 3052.8%Hispanic
- 2842.6%Two or more races
- 1631.5%Asian alone
- 910.8%Black alone
- 630.6%American Indian alone
- 400.4%Other race alone
- 120.1%Native Hawaiian and Other
Pacific Islander alone
2000
2022
-
- 4,652,49078.9%White alone
- 441,5097.5%Hispanic
- 319,4015.4%Asian alone
- 184,6313.1%Black alone
- 175,9263.0%Two or more races
- 85,3961.4%American Indian alone
- 22,7790.4%Native Hawaiian and Other
Pacific Islander alone - 11,9890.2%Other race alone

-
- 4,941,45663.5%White alone
- 1,093,31314.0%Hispanic
- 755,8329.7%Asian alone
- 523,4486.7%Two or more races
- 299,5373.8%Black alone
- 69,0240.9%American Indian alone
- 52,2310.7%Native Hawaiian and Other
Pacific Islander alone - 50,9450.7%Other race alone

Income and house value in Central Whidbey
- Median household income in 2022
- $84,903White non-Hispanic householders
- $33,210Black householders
- $90,744American Indian and Alaska Native householders
- $90,215Asian householders
- $76,133Some other race householders
- $60,176Two or more races householders
- $129,341Hispanic or Latino race householders
- Median 2022 house value
- $615,409White Non-Hispanic householders
- $527,595American Indian or Alaska Native householders
- $577,724Asian householders
- $666,604Native Hawaiian and other Pacific Islander householders
- $481,377Some other race householders
- $540,038Two or more races householders
- $565,636Hispanic or Latino householders
Household income for White non-Hispanic householders

Household income for Black householders

Household income for American Indian and Alaska Native householders

Household income for Asian householders

Household income for Native Hawaiian and other Pacific Islander householders

Household income for Two or more races householders

Household income for Hispanic or Latino race householders

Zip code: 98239