Races in Central Falls, Rhode Island (RI) Detailed Stats
Data:
Races - White alone (%)
Races - White alone (% change since 2000)
Races - Black alone (%)
Races - Black alone (% change since 2000)
Races - American Indian alone (%)
Races - American Indian alone (% change since 2000)
Races - Asian alone (%)
Races - Asian alone (% change since 2000)
Races - Hispanic (%)
Races - Hispanic (% change since 2000)
Races - Native Hawaiian and Other Pacific Islander alone (%)
Races - Native Hawaiian and Other Pacific Islander alone (% change since 2000)
Races - Two or more races(%)
Races - Two or more races(% change since 2000)
Races - Other race alone (%)
Races - Other race alone (% change since 2000)
Racial diversity
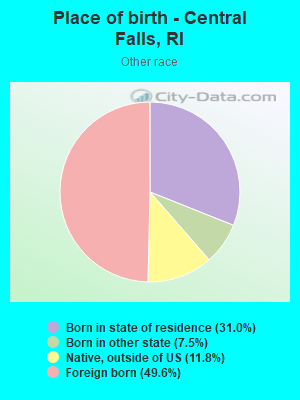
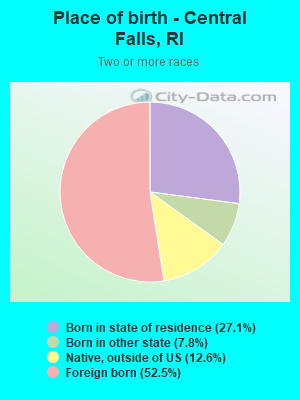
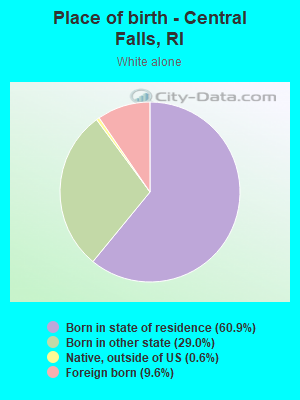
Place of birth - Born in state of residence (%)
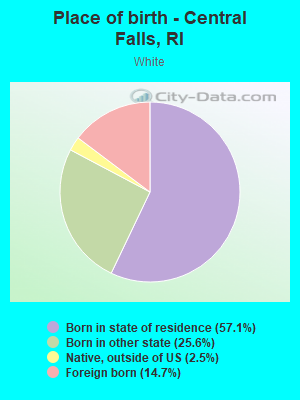
Place of birth - Born in state of residence (%) - White
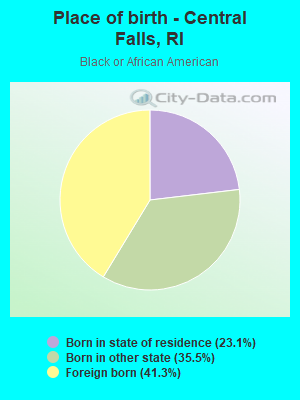
Place of birth - Born in state of residence (%) - Black or African American
Place of birth - Born in state of residence (%) - Asian
Place of birth - Born in state of residence (%) - Hispanic or Latino
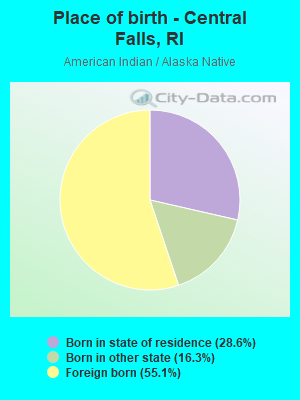
Place of birth - Born in state of residence (%) - American Indian and Alaska Native
Place of birth - Born in state of residence (%) - Multirace
Place of birth - Born in state of residence (%) - Other Race
Place of birth - Born in other state (%)
Place of birth - Born in other state (%) - White
Place of birth - Born in other state (%) - Black or African American
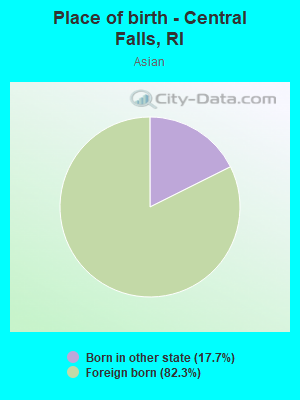
Place of birth - Born in other state (%) - Asian
Place of birth - Born in other state (%) - Hispanic or Latino
Place of birth - Born in other state (%) - American Indian and Alaska Native
Place of birth - Born in other state (%) - Multirace
Place of birth - Born in other state (%) - Other Race
Place of birth - Native, outside of US (%)
Place of birth - Native, outside of US (%) - White
Place of birth - Native, outside of US (%) - Black or African American
Place of birth - Native, outside of US (%) - Asian
Place of birth - Native, outside of US (%) - Hispanic or Latino
Place of birth - Native, outside of US (%) - American Indian and Alaska Native
Place of birth - Native, outside of US (%) - Multirace
Place of birth - Native, outside of US (%) - Other Race
Place of birth - Foreign born (%)
Place of birth - Foreign born (%) - White
Place of birth - Foreign born (%) - Black or African American
Place of birth - Foreign born (%) - Asian
Place of birth - Foreign born (%) - Hispanic or Latino
Place of birth - Foreign born (%) - American Indian and Alaska Native
Place of birth - Foreign born (%) - Multirace
Place of birth - Foreign born (%) - Other Race
Residents speaking English at home (%)
Residents speaking English at home - Born in the United States (%)
Residents speaking English at home - Native, born elsewhere (%)
Residents speaking English at home - Foreign born (%)
Residents speaking Spanish at home (%)
Residents speaking Spanish at home - Born in the United States (%)
Residents speaking Spanish at home - Native, born elsewhere (%)
Residents speaking Spanish at home - Foreign born (%)
Residents speaking other language at home (%)
Residents speaking other language at home - Born in the United States (%)
Residents speaking other language at home - Native, born elsewhere (%)
Residents speaking other language at home - Foreign born (%)
Marital status - Never married (%)
Marital status - Now married (%)
Marital status - Separated (%)
Marital status - Widowed (%)
Marital status - Divorced (%)
Ancestries Reported - Arab (%)
Ancestries Reported - Czech (%)
Ancestries Reported - Danish (%)
Ancestries Reported - Dutch (%)
Ancestries Reported - English (%)
Ancestries Reported - French (%)
Ancestries Reported - French Canadian (%)
Ancestries Reported - German (%)
Ancestries Reported - Greek (%)
Ancestries Reported - Hungarian (%)
Ancestries Reported - Irish (%)
Ancestries Reported - Italian (%)
Ancestries Reported - Lithuanian (%)
Ancestries Reported - Norwegian (%)
Ancestries Reported - Polish (%)
Ancestries Reported - Portuguese (%)
Ancestries Reported - Russian (%)
Ancestries Reported - Scotch-Irish (%)
Ancestries Reported - Scottish (%)
Ancestries Reported - Slovak (%)
Ancestries Reported - Subsaharan African (%)
Ancestries Reported - Swedish (%)
Ancestries Reported - Swiss (%)
Ancestries Reported - Ukrainian (%)
Ancestries Reported - United States (%)
Ancestries Reported - Welsh (%)
Ancestries Reported - West Indian (%)
Ancestries Reported - Other (%)
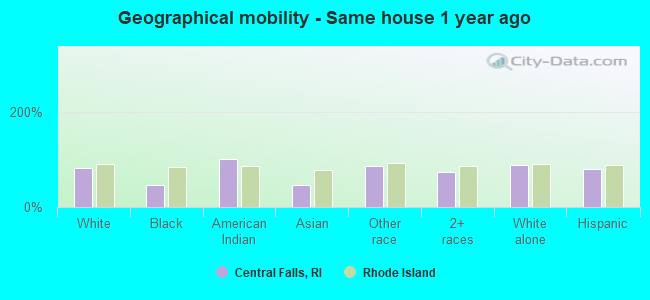
Geographical mobility - Same house 1 year ago (%)
Geographical mobility - Same house 1 year ago (%) - White
Geographical mobility - Same house 1 year ago (%) - Black or African American
Geographical mobility - Same house 1 year ago (%) - Asian
Geographical mobility - Same house 1 year ago (%) - Hispanic or Latino
Geographical mobility - Same house 1 year ago (%) - American Indian and Alaska Native
Geographical mobility - Same house 1 year ago (%) - Multirace
Geographical mobility - Same house 1 year ago (%) - Other Race
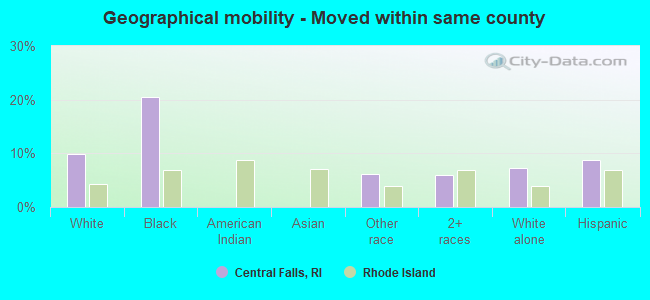
Geographical mobility - Moved within same county (%)
Geographical mobility - Moved within same county (%) - White
Geographical mobility - Moved within same county (%) - Black or African American
Geographical mobility - Moved within same county (%) - Asian
Geographical mobility - Moved within same county (%) - Hispanic or Latino
Geographical mobility - Moved within same county (%) - American Indian and Alaska Native
Geographical mobility - Moved within same county (%) - Multirace
Geographical mobility - Moved within same county (%) - Other Race
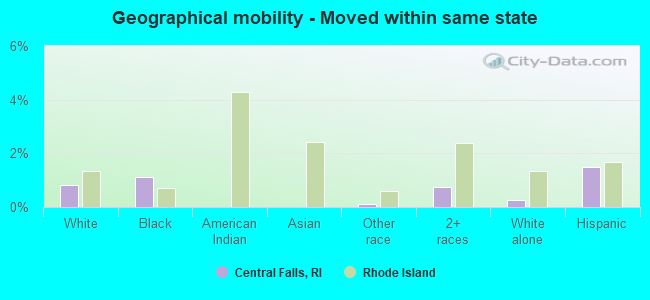
Geographical mobility - Moved from different county within same state (%)
Geographical mobility - Moved from different county within same state (%) - White
Geographical mobility - Moved from different county within same state (%) - Black or African American
Geographical mobility - Moved from different county within same state (%) - Asian
Geographical mobility - Moved from different county within same state (%) - Hispanic or Latino
Geographical mobility - Moved from different county within same state (%) - American Indian and Alaska Native
Geographical mobility - Moved from different county within same state (%) - Multirace
Geographical mobility - Moved from different county within same state (%) - Other Race
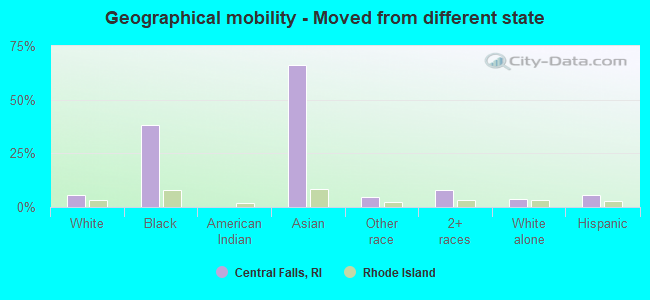
Geographical mobility - Moved from different state (%)
Geographical mobility - Moved from different state (%) - White
Geographical mobility - Moved from different state (%) - Black or African American
Geographical mobility - Moved from different state (%) - Asian
Geographical mobility - Moved from different state (%) - Hispanic or Latino
Geographical mobility - Moved from different state (%) - American Indian and Alaska Native
Geographical mobility - Moved from different state (%) - Multirace
Geographical mobility - Moved from different state (%) - Other Race
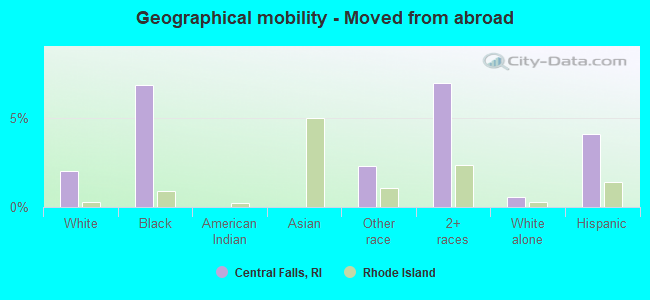
Geographical mobility - Moved from abroad (%)
Geographical mobility - Moved from abroad (%) - White
Geographical mobility - Moved from abroad (%) - Black or African American
Geographical mobility - Moved from abroad (%) - Asian
Geographical mobility - Moved from abroad (%) - Hispanic or Latino
Geographical mobility - Moved from abroad (%) - American Indian and Alaska Native
Geographical mobility - Moved from abroad (%) - Multirace
Geographical mobility - Moved from abroad (%) - Other Race
Place of birth for the foreign-born population - Ireland (%)
Place of birth for the foreign-born population - Denmark (%)
Place of birth for the foreign-born population - Norway (%)
Place of birth for the foreign-born population - Sweden (%)
Place of birth for the foreign-born population - United Kingdom (%)
Place of birth for the foreign-born population - England (%)
Place of birth for the foreign-born population - Scotland (%)
Place of birth for the foreign-born population - Other Northern Europe (%)
Place of birth for the foreign-born population - Austria (%)
Place of birth for the foreign-born population - Belgium (%)
Place of birth for the foreign-born population - France (%)
Place of birth for the foreign-born population - Germany (%)
Place of birth for the foreign-born population - Netherlands (%)
Place of birth for the foreign-born population - Switzerland (%)
Place of birth for the foreign-born population - Other Western Europe (%)
Place of birth for the foreign-born population - Greece (%)
Place of birth for the foreign-born population - Italy (%)
Place of birth for the foreign-born population - Portugal (%)
Place of birth for the foreign-born population - Spain (%)
Place of birth for the foreign-born population - Other Southern Europe (%)
Place of birth for the foreign-born population - Albania (%)
Place of birth for the foreign-born population - Belarus (%)
Place of birth for the foreign-born population - Bosnia and Herzegovina (%)
Place of birth for the foreign-born population - Bulgaria (%)
Place of birth for the foreign-born population - Croatia (%)
Place of birth for the foreign-born population - Czechoslovakia (%)
Place of birth for the foreign-born population - Hungary (%)
Place of birth for the foreign-born population - Latvia (%)
Place of birth for the foreign-born population - Lithuania (%)
Place of birth for the foreign-born population - North Macedonia (Macedonia) (%)
Place of birth for the foreign-born population - Moldova (%)
Place of birth for the foreign-born population - Poland (%)
Place of birth for the foreign-born population - Romania (%)
Place of birth for the foreign-born population - Russia (%)
Place of birth for the foreign-born population - Serbia (%)
Place of birth for the foreign-born population - Ukraine (%)
Place of birth for the foreign-born population - Other Eastern Europe (%)
Place of birth for the foreign-born population - China (%)
Place of birth for the foreign-born population - Hong Kong (%)
Place of birth for the foreign-born population - Taiwan (%)
Place of birth for the foreign-born population - Japan (%)
Place of birth for the foreign-born population - Korea (%)
Place of birth for the foreign-born population - Other Eastern Asia (%)
Place of birth for the foreign-born population - Afghanistan (%)
Place of birth for the foreign-born population - Bangladesh (%)
Place of birth for the foreign-born population - India (%)
Place of birth for the foreign-born population - Iran (%)
Place of birth for the foreign-born population - Kazakhstan (%)
Place of birth for the foreign-born population - Nepal (%)
Place of birth for the foreign-born population - Pakistan (%)
Place of birth for the foreign-born population - Sri Lanka (%)
Place of birth for the foreign-born population - Uzbekistan (%)
Place of birth for the foreign-born population - Other South Central Asia (%)
Place of birth for the foreign-born population - Burma (%)
Place of birth for the foreign-born population - Cambodia (%)
Place of birth for the foreign-born population - Indonesia (%)
Place of birth for the foreign-born population - Laos (%)
Place of birth for the foreign-born population - Malaysia (%)
Place of birth for the foreign-born population - Philippines (%)
Place of birth for the foreign-born population - Singapore (%)
Place of birth for the foreign-born population - Thailand (%)
Place of birth for the foreign-born population - Vietnam (%)
Place of birth for the foreign-born population - Other South Eastern Asia (%)
Place of birth for the foreign-born population - Armenia (%)
Place of birth for the foreign-born population - Iraq (%)
Place of birth for the foreign-born population - Israel (%)
Place of birth for the foreign-born population - Jordan (%)
Place of birth for the foreign-born population - Kuwait (%)
Place of birth for the foreign-born population - Lebanon (%)
Place of birth for the foreign-born population - Saudi Arabia (%)
Place of birth for the foreign-born population - Syria (%)
Place of birth for the foreign-born population - Turkey (%)
Place of birth for the foreign-born population - Yemen (%)
Place of birth for the foreign-born population - Other Western Asia (%)
Place of birth for the foreign-born population - Eritrea (%)
Place of birth for the foreign-born population - Ethiopia (%)
Place of birth for the foreign-born population - Kenya (%)
Place of birth for the foreign-born population - Somalia (%)
Place of birth for the foreign-born population - Uganda (%)
Place of birth for the foreign-born population - Zimbabwe (%)
Place of birth for the foreign-born population - Other Eastern Africa (%)
Place of birth for the foreign-born population - Cameroon (%)
Place of birth for the foreign-born population - Congo (%)
Place of birth for the foreign-born population - Democratic Republic of Congo (Zaire) (%)
Place of birth for the foreign-born population - Other Middle Africa (%)
Place of birth for the foreign-born population - Egypt (%)
Place of birth for the foreign-born population - Morocco (%)
Place of birth for the foreign-born population - Sudan (%)
Place of birth for the foreign-born population - Other Northern Africa (%)
Place of birth for the foreign-born population - South Africa (%)
Place of birth for the foreign-born population - Other Southern Africa (%)
Place of birth for the foreign-born population - Cabo Verde (%)
Place of birth for the foreign-born population - Ghana (%)
Place of birth for the foreign-born population - Liberia (%)
Place of birth for the foreign-born population - Nigeria (%)
Place of birth for the foreign-born population - Senegal (%)
Place of birth for the foreign-born population - Sierra Leone (%)
Place of birth for the foreign-born population - Other Western Africa (%)
Place of birth for the foreign-born population - Australia (%)
Place of birth for the foreign-born population - New Zealand (%)
Place of birth for the foreign-born population - Fiji (%)
Place of birth for the foreign-born population - Micronesia (%)
Place of birth for the foreign-born population - Bahamas (%)
Place of birth for the foreign-born population - Barbados (%)
Place of birth for the foreign-born population - Cuba (%)
Place of birth for the foreign-born population - Dominica (%)
Place of birth for the foreign-born population - Dominican Republic (%)
Place of birth for the foreign-born population - Grenada (%)
Place of birth for the foreign-born population - Haiti (%)
Place of birth for the foreign-born population - Jamaica (%)
Place of birth for the foreign-born population - St. Vincent and the Grenadines (%)
Place of birth for the foreign-born population - Trinidad and Tobago (%)
Place of birth for the foreign-born population - West Indies (%)
Place of birth for the foreign-born population - Other Caribbean (%)
Place of birth for the foreign-born population - Belize (%)
Place of birth for the foreign-born population - Costa Rica (%)
Place of birth for the foreign-born population - El Salvador (%)
Place of birth for the foreign-born population - Guatemala (%)
Place of birth for the foreign-born population - Honduras (%)
Place of birth for the foreign-born population - Mexico (%)
Place of birth for the foreign-born population - Nicaragua (%)
Place of birth for the foreign-born population - Panama (%)
Place of birth for the foreign-born population - Other Central America (%)
Place of birth for the foreign-born population - Argentina (%)
Place of birth for the foreign-born population - Bolivia (%)
Place of birth for the foreign-born population - Brazil (%)
Place of birth for the foreign-born population - Chile (%)
Place of birth for the foreign-born population - Colombia (%)
Place of birth for the foreign-born population - Ecuador (%)
Place of birth for the foreign-born population - Guyana (%)
Place of birth for the foreign-born population - Peru (%)
Place of birth for the foreign-born population - Uruguay (%)
Place of birth for the foreign-born population - Venezuela (%)
Place of birth for the foreign-born population - Other South America (%)
Place of birth for the foreign-born population - Canada (%)
Place of birth for the foreign-born population - Other Northern America (%)
Place of birth for the foreign-born population - Other (%)
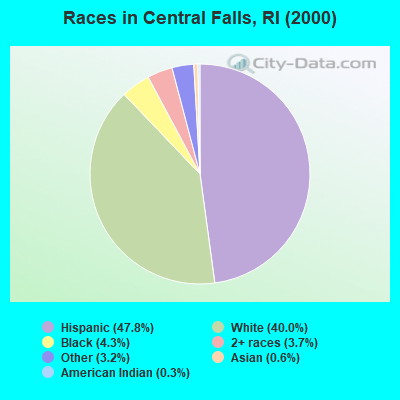
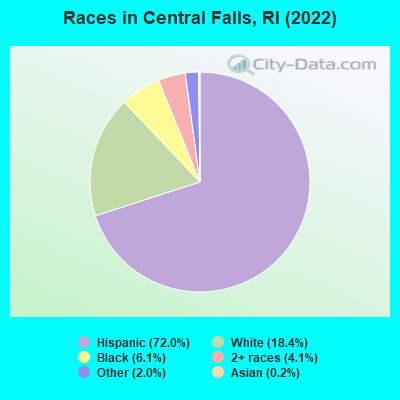
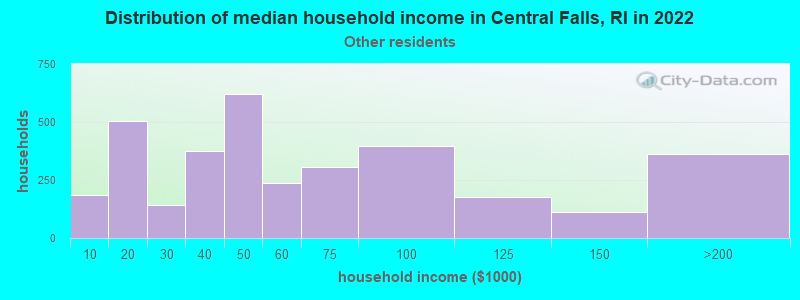
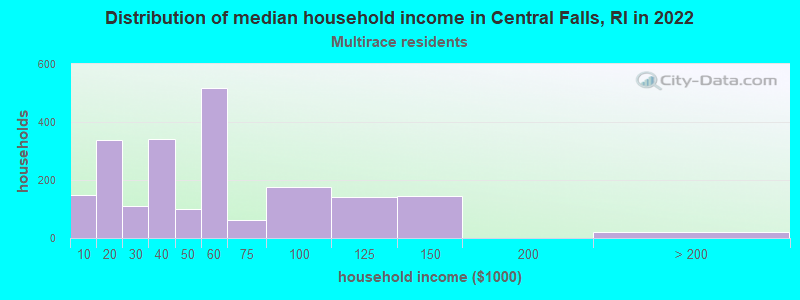
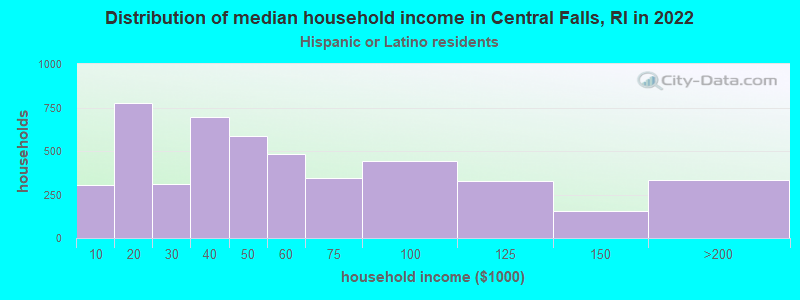
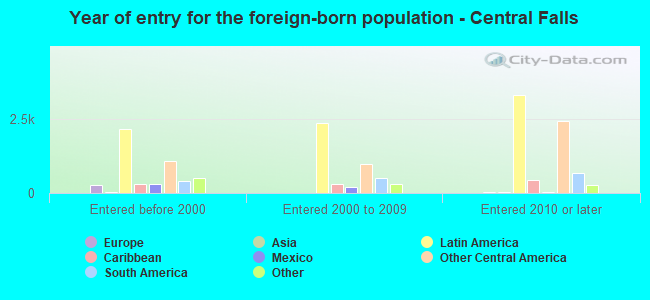
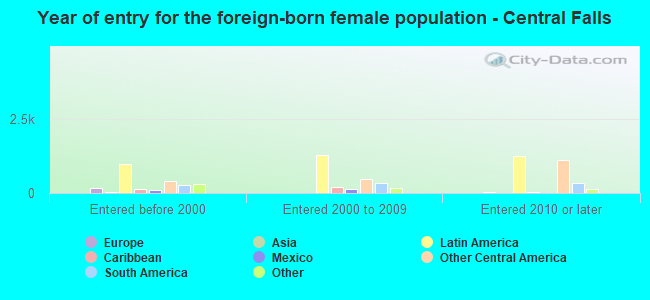
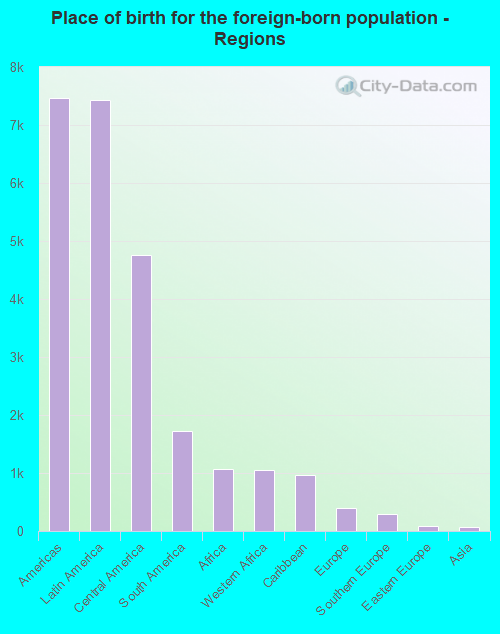
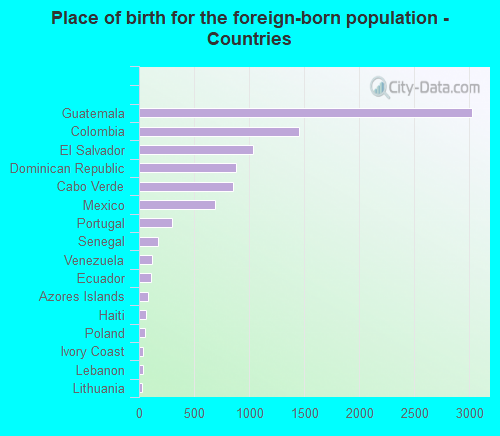
According to 2022 data, the most numerous races in Central Falls, RI are White alone (4,104 residents), Hispanic (16,076 residents), and Two or more races (905 residents). 30.3% of Central Falls residents speak English at home. 40.3% of Central Falls, RI residents are foreign-born (32.6% born in Latin America, 4.7% born in Africa), which is 65.2% greater than the foreign-born rate of 14.0% across the entire state of Rhode Island.
Race distribution in Central Falls
2000 2022
858,433 81.9% White alone 90,820 8.7% Hispanic 41,922 4.0% Black alone 23,416 2.2% Asian alone 20,816 2.0% Two or more races 8,411 0.8% Other race alone 4,181 0.4% American Indian alone 320 0.03% Native Hawaiian and Other
745,825 68.2% White alone 191,979 17.6% Hispanic 56,738 5.2% Two or more races 51,326 4.7% Black alone 37,234 3.4% Asian alone 9,514 0.9% Other race alone 978 0.09% American Indian alone 140 0.01% Native Hawaiian and Other
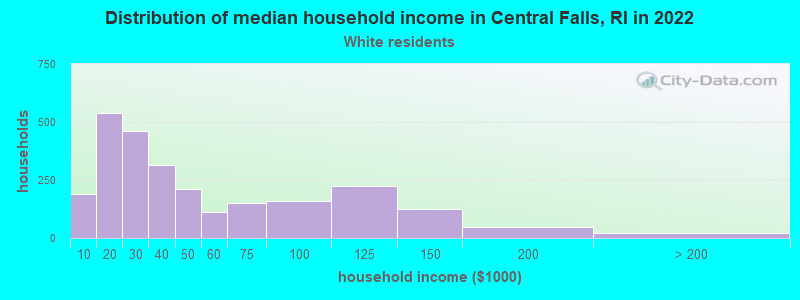
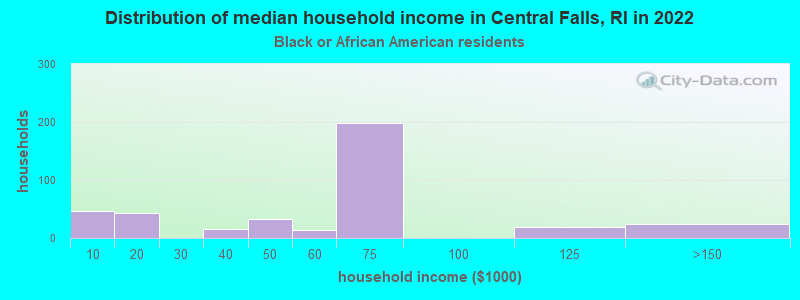
Income and house value in Central Falls Median household income in 2022 $33,034 White non-Hispanic householders$63,773 Black householders$51,404 Some other race householders$44,084 Two or more races householders$47,435 Hispanic or Latino race householdersMedian 2022 house value $267,061 White Non-Hispanic householders$342,190 Black or African American householders $494,275 Asian householders$267,061 Some other race householders$342,190 Two or more races householders$260,369 Hispanic or Latino householders
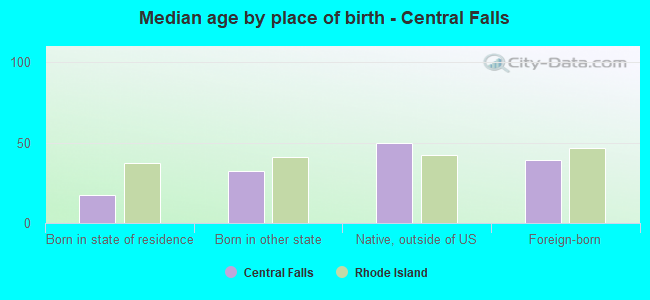
Median age by race in Central Falls
40.4 Median age for White residents34.3 41.5 32.5 Median age for Black or African American residents32.8 34.2 13.0 Median age for American Indian / Alaska Native residents15.0 -606,811,144.9 34.2 Median age for Asian residents-713,131,312.4 -670,744,138.0 -713,991,768.8 Median age for Native Hawaiian / Pacific Islander residents-668,724,279.2 -670,599,802.7 30.6 Median age for Other race residents31.2 31.3 30.8 Median age for Two or more races residents31.4 32.3 49.2 Median age for White alone residents40.9 58.0 28.6 Median age for Hispanic or Latino residents29.3 27.9
Owner/renter occupied households by race in Central Falls
House owners and renters - White residents 870 32.9% Owner occupied1,772 67.1% Renter occupiedHouse owners and renters - Black or African American residents 21 6.2% Owner occupied311 93.8% Renter occupiedHouse owners and renters - American Indian / Alaska Native residents 41 100.0% Owner occupiedHouse owners and renters - Asian residents 9 100.0% Owner occupiedHouse owners and renters - Other race residents 724 21.6% Owner occupied2,621 78.4% Renter occupiedHouse owners and renters - Two or more races residents 473 22.9% Owner occupied1,594 77.1% Renter occupiedHouse owners and renters - White alone residents 726 36.3% Owner occupied1,272 63.7% Renter occupiedHouse owners and renters - Hispanic or Latino residents 1,088 22.3% Owner occupied3,791 77.7% Renter occupied
Language usage in Central Falls
English speakers - Total 30.3% of residents of Central Falls speak English at home.
60.3% of residents speak Spanish at home 6,252 50.6% Speak English very well6,102 49.4% Speak English less than very well9.6% of residents speak other language at home 1,077 54.6% Speak English very well896 45.4% Speak English less than very well
English speakers - Born in the United States 67.9% of residents of Central Falls speak English at home.
28.6% of residents speak Spanish at home 715 83.9% Speak English very well137 16.1% Speak English less than very well3.1% of residents speak other language at home 71 78.0% Speak English very well20 22.0% Speak English less than very well
English speakers - Native, born elsewhere 6.6% of residents of Central Falls speak English at home.
85.1% of residents speak Spanish at home 811 52.1% Speak English very well746 47.9% Speak English less than very well4.3% of residents speak other language at home 43 54.4% Speak English very well36 45.6% Speak English less than very well
English speakers - Foreign-born 6.1% of residents of Central Falls speak English at home.
80.8% of residents speak Spanish at home 2,166 30.2% Speak English very well5,010 69.8% Speak English less than very well15.9% of residents speak other language at home 551 38.9% Speak English very well865 61.1% Speak English less than very well
White (Caucasian) - Speak only English Native:
72.3% (3,594)Foreign-born:
4.3% (38)
White (Caucasian) - Speak another language Native:
20.1% (1,001)Foreign-born:
97.7% (882)
Black or African American - Speak only English Native:
86.5% (609)Foreign-born:
5.3% (36)
Black or African American - Speak another language Native:
13.5% (95)Foreign-born:
80.2% (550)
American Indian / Alaska Native - Speak only English Native:
29.8% (22)Foreign-born:
15.3% (17)
American Indian / Alaska Native - Speak another language Native:
77.2% (57)Foreign-born:
82.9% (90)
Other race - Speak only English Native:
24.0% (1,147)Foreign-born:
11.1% (558)
Other race - Speak another language Native:
73.9% (3,534)Foreign-born:
90.2% (4,557)
Two or more races - Speak only English Native:
26.9% (602)Foreign-born:
6.8% (221)
Two or more races - Speak another language Native:
76.2% (1,703)Foreign-born:
92.7% (3,022)
White alone - Speak another language Native:
10.6% (367)Foreign-born:
100.0% (379)
Hispanic or Latino - Speak only English Native:
22.2% (1,558)Foreign-born:
6.7% (515)
Hispanic or Latino - Speak another language Native:
76.3% (5,363)Foreign-born:
93.4% (7,188)
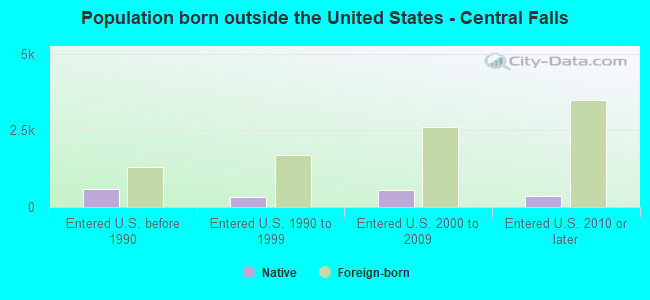
Foreign-born residents in Central Falls 8,994 residents are foreign born (32.6% Latin America , 4.7% Africa ).
This city:
40.3%Rhode Island:
14.4%
Marital status for residents in Central Falls Marital status - White (Caucasian) population 15 years and over
Males 53.0% Never married29.9% Now married2.4% Separated2.2% Widowed12.5% DivorcedFemales 37.2% Never married31.5% Now married0.0% Separated12.1% Widowed19.2% DivorcedWomen who gave birth in the past 12 months Now married:
0.0% (0)Unmarried:
100.0% (76)
Women who did not give birth in the past 12 months Now married:
26.3% (326)Unmarried:
73.7% (915)
Marital status - Black or African American population 15 years and over
Males 46.4% Never married41.3% Now married4.4% Separated0.0% Widowed7.9% DivorcedFemales 43.1% Never married25.8% Now married14.2% Separated0.0% Widowed16.9% DivorcedWomen who gave birth in the past 12 months Now married:
100.0% (73)Unmarried:
0.0% (0)
Women who did not give birth in the past 12 months Now married:
39.3% (138)Unmarried:
60.7% (213)
Marital status - American Indian / Alaska Native population 15 years and over
Males 47.7% Never married52.3% Now married0.0% Separated0.0% Widowed0.0% DivorcedFemales 0.0% Never married100.0% Now married0.0% Separated0.0% Widowed0.0% DivorcedWomen who did not give birth in the past 12 months Now married:
100.0% (24)Unmarried:
0.0% (0)
Marital status - Asian population 15 years and over
Males 26.7% Never married73.3% Now married0.0% Separated0.0% Widowed0.0% DivorcedFemales 0.0% Never married100.0% Now married0.0% Separated0.0% Widowed0.0% DivorcedMarital status - Other race population 15 years and over
Males 52.8% Never married40.5% Now married2.2% Separated0.0% Widowed4.5% DivorcedFemales 48.3% Never married37.5% Now married0.9% Separated2.0% Widowed11.3% DivorcedWomen who gave birth in the past 12 months Now married:
91.1% (199)Unmarried:
8.9% (20)
Women who did not give birth in the past 12 months Now married:
30.2% (690)Unmarried:
69.8% (1,593)
Marital status - Two or more races population 15 years and over
Males 37.5% Never married54.4% Now married1.8% Separated0.0% Widowed6.3% DivorcedFemales 39.4% Never married38.6% Now married0.0% Separated5.0% Widowed17.0% DivorcedWomen who gave birth in the past 12 months Now married:
100.0% (27)Unmarried:
0.0% (0)
Women who did not give birth in the past 12 months Now married:
35.5% (549)Unmarried:
64.5% (996)
Marital status - White alone, not Hispanic / Latino population 15 years and over
Males 49.2% Never married28.6% Now married1.9% Separated3.7% Widowed16.6% DivorcedFemales 29.8% Never married32.6% Now married0.0% Separated14.0% Widowed23.5% DivorcedWomen who gave birth in the past 12 months Now married:
0.0% (0)Unmarried:
100.0% (45)
Women who did not give birth in the past 12 months Now married:
31.9% (237)Unmarried:
68.1% (508)
Marital status - Hispanic or Latino population 15 years and over
Males 49.5% Never married42.5% Now married2.5% Separated0.0% Widowed5.6% DivorcedFemales 47.4% Never married35.5% Now married0.5% Separated3.5% Widowed13.1% DivorcedWomen who gave birth in the past 12 months Now married:
76.0% (182)Unmarried:
24.0% (58)
Women who did not give birth in the past 12 months Now married:
29.8% (1,102)Unmarried:
70.2% (2,601)
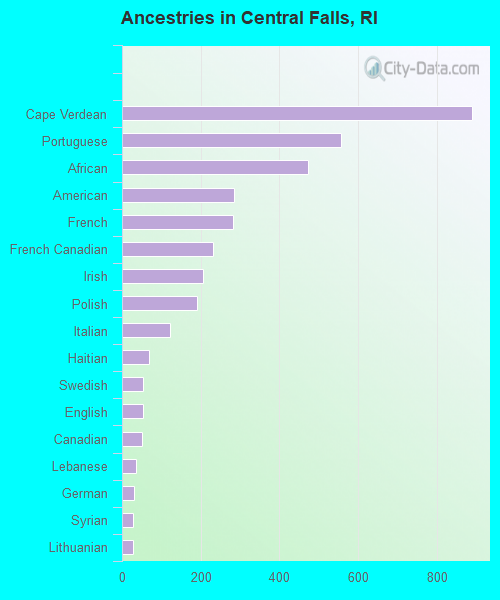
Ancestries in Central Falls
889 6.0% Cape Verdean558 3.8% Portuguese474 3.2% African286 1.9% American282 1.9% French231 1.6% French Canadian206 1.4% Irish191 1.3% Polish122 0.8% Italian68 0.5% Haitian54 0.4% Swedish53 0.4% English50 0.3% Canadian36 0.2% Lebanese30 0.2% German29 0.2% Syrian29 0.2% Lithuanian8 0.05% Arab2 0.01% Armenian
Geographical mobility in Central Falls Same house 1 year ago 5,291 81.0% White (Caucasian)698 46.3% Black or African American159 100.0% American Indian / Alaska Native21 47.1% Asian8,764 85.9% Other race4,334 74.3% Two or more races3,583 88.2% White alone, not Hispanic / Latino12,654 79.9% Hispanic or LatinoMoved within same county 647 9.9% White / Caucasian308 20.4% Black or African American628 6.2% Other race343 5.9% Two or more races294 7.2% White alone, not Hispanic / Latino1,390 8.8% Hispanic or LatinoMoved within same state 54 0.8% White / Caucasian17 1.1% Black or African American10 0.1% Other race43 0.7% Two or more races11 0.3% White alone, not Hispanic / Latino239 1.5% Hispanic or LatinoMoved from different state 362 5.5% White / Caucasian577 38.2% Black or African American30 66.3% Asian499 4.9% Other race475 8.1% Two or more races153 3.8% White alone, not Hispanic / Latino867 5.5% Hispanic or LatinoMoved from abroad 132 2.0% White103 6.8% Black or African American235 2.3% Other race403 6.9% Two or more races24 0.6% White alone, not Hispanic / Latino649 4.1% Hispanic or Latino
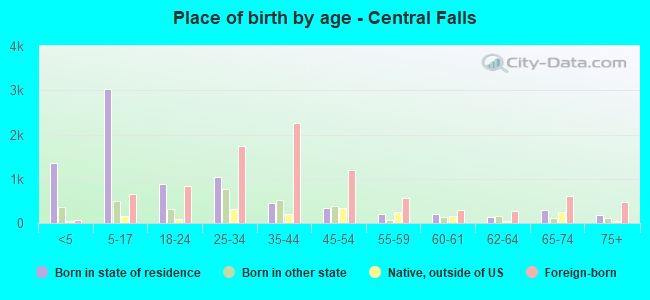
Children Nativity (place of birth) in Central Falls
Children under 6 years - Living with two parents Both parents native 183 96.0% Native8 4.0% Foreign-bornBoth parents foreign-born 686 82.7% Native143 17.3% Foreign-bornOne native, one foreign-born parent 85 100.0% NativeChildren under 6 years - Living with one parent Native parent 415 100.0% NativeForeign-born parent 567 92.3% Native47 7.7% Foreign-bornChildren 6 to 17 years - Living with two parents Both parents native 998 99.9% Native1 0.1% Foreign-bornBoth parents foreign-born 1,030 84.7% Native185 15.3% Foreign-bornOne native, one foreign-born parent 256 100.0% NativeChildren 6 to 17 years - Living with one parent Native parent 564 100.0% NativeForeign-born parent 628 60.1% Native417 39.9% Foreign-born
Grandparents responsible for own grandchildren in Central Falls
Grandparents (30 to 59 years) White / Caucasian 11 100.0% Not responsible for grandchildrenBlack or African American 50 100.0% Not responsible for grandchildrenOther race 163 100.0% Not responsible for grandchildrenTwo or more races 36 100.0% Not responsible for grandchildrenHispanic or Latino 177 100.0% Not responsible for grandchildrenGrandparents (60 years and over) White / Caucasian 17 24.0% Responsible for grandchildren55 76.0% Not responsible for grandchildrenTwo or more races 23 40.0% Responsible for grandchildren35 60.0% Not responsible for grandchildrenHispanic or Latino 21 100.0% Responsible for grandchildren