Races in Cedar Grove, New Jersey (NJ) Detailed Stats
Ancestries, Foreign-born residents, place of birth

Recent posts about races in Cedar Grove, New Jersey on our local forum with over 2,400,000 registered users:

11.0% of Cedar Grove, NJ residents are foreign-born (4.5% born in Asia, 3.7% born in Europe, 1.9% born in Latin America), which is 109.7% less than the foreign-born rate of 23.0% across the entire state of New Jersey.
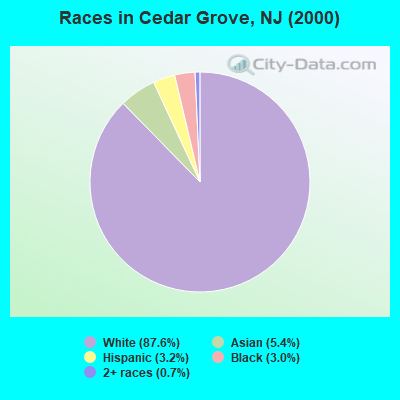
Race distribution in Cedar Grove

- 10,77787.6%White alone
- 6665.4%Asian alone
- 3933.2%Hispanic
- 3643.0%Black alone
- 870.7%Two or more races
- 70.06%Other race alone
- 40.03%American Indian alone
- 20.02%Native Hawaiian and Other
Pacific Islander alone
2000
2022
-
- 5,557,20966.0%White alone
- 1,117,19113.3%Hispanic
- 1,096,17113.0%Black alone
- 477,0125.7%Asian alone
- 133,6891.6%Two or more races
- 19,5650.2%Other race alone
- 11,3380.1%American Indian alone
- 2,1750.03%Native Hawaiian and Other
Pacific Islander alone

-
- 4,766,47651.5%White alone
- 2,028,47021.9%Hispanic
- 1,111,63212.0%Black alone
- 923,54610.0%Asian alone
- 332,2373.6%Two or more races
- 89,8471.0%Other race alone
- 8,5570.09%American Indian alone
- 9340.01%Native Hawaiian and Other
Pacific Islander alone

Income and house value in Cedar Grove
- Median household income in 2022
- $141,205White non-Hispanic householders
- $128,054Black householders
- $59,417American Indian and Alaska Native householders
- over $200,000Asian householders
- $114,709Some other race householders
- $147,277Two or more races householders
- $181,437Hispanic or Latino race householders
- Median 2022 house value
- $618,936White Non-Hispanic householders
- $616,313Black or African American householders
- $777,342American Indian or Alaska Native householders
- $685,288Asian householders
- $765,015Some other race householders
- $541,044Two or more races householders
- $655,652Hispanic or Latino householders
Household income for White non-Hispanic householders

Household income for Black householders

Household income for American Indian and Alaska Native householders

Household income for Asian householders

Household income for Native Hawaiian and other Pacific Islander householders

Household income for Two or more races householders

Household income for Hispanic or Latino race householders

Foreign-born residents in Cedar Grove
1,349 residents are foreign born (4.5% Asia, 3.7% Europe, 1.9% Latin America).
| This city: | 11.0% |
| New Jersey: | 17.5% |
Ancestries in Cedar Grove

- 4,27829.7%Italian
- 2,67118.5%Irish
- 2,04714.2%Other
- 1,48810.3%German
- 8265.7%Polish
- 7525.2%English
- 3922.7%United States
- 3502.4%Russian
- 2461.7%Hungarian
- 1741.2%Dutch
- 1611.1%Scotch-Irish
- 1511.0%Swedish
- 1330.9%French
- 1220.8%Scottish
- 1150.8%Ukrainian
- 890.6%Lithuanian
- 630.4%Arab
- 530.4%West Indian
- 520.4%Portuguese
- 430.3%Subsaharan African
- 400.3%Greek
- 340.2%Czech
- 330.2%Norwegian
- 320.2%Slovak
- 290.2%Swiss
- 160.1%Welsh
- 140.10%Danish
- 110.08%French Canadian

Zip codes: 07009.