Races in Cave Spring, Virginia (VA) Detailed Stats
Data:
Races - White alone (%)
Races - White alone (% change since 2000)
Races - Black alone (%)
Races - Black alone (% change since 2000)
Races - American Indian alone (%)
Races - American Indian alone (% change since 2000)
Races - Asian alone (%)
Races - Asian alone (% change since 2000)
Races - Hispanic (%)
Races - Hispanic (% change since 2000)
Races - Native Hawaiian and Other Pacific Islander alone (%)
Races - Native Hawaiian and Other Pacific Islander alone (% change since 2000)
Races - Two or more races(%)
Races - Two or more races(% change since 2000)
Races - Other race alone (%)
Races - Other race alone (% change since 2000)
Racial diversity
Place of birth - Born in state of residence (%)
Place of birth - Born in state of residence (%) - White
Place of birth - Born in state of residence (%) - Black or African American
Place of birth - Born in state of residence (%) - Asian
Place of birth - Born in state of residence (%) - Hispanic or Latino
Place of birth - Born in state of residence (%) - American Indian and Alaska Native
Place of birth - Born in state of residence (%) - Multirace
Place of birth - Born in state of residence (%) - Other Race
Place of birth - Born in other state (%)
Place of birth - Born in other state (%) - White
Place of birth - Born in other state (%) - Black or African American
Place of birth - Born in other state (%) - Asian
Place of birth - Born in other state (%) - Hispanic or Latino
Place of birth - Born in other state (%) - American Indian and Alaska Native
Place of birth - Born in other state (%) - Multirace
Place of birth - Born in other state (%) - Other Race
Place of birth - Native, outside of US (%)
Place of birth - Native, outside of US (%) - White
Place of birth - Native, outside of US (%) - Black or African American
Place of birth - Native, outside of US (%) - Asian
Place of birth - Native, outside of US (%) - Hispanic or Latino
Place of birth - Native, outside of US (%) - American Indian and Alaska Native
Place of birth - Native, outside of US (%) - Multirace
Place of birth - Native, outside of US (%) - Other Race
Place of birth - Foreign born (%)
Place of birth - Foreign born (%) - White
Place of birth - Foreign born (%) - Black or African American
Place of birth - Foreign born (%) - Asian
Place of birth - Foreign born (%) - Hispanic or Latino
Place of birth - Foreign born (%) - American Indian and Alaska Native
Place of birth - Foreign born (%) - Multirace
Place of birth - Foreign born (%) - Other Race
Residents speaking English at home (%)
Residents speaking English at home - Born in the United States (%)
Residents speaking English at home - Native, born elsewhere (%)
Residents speaking English at home - Foreign born (%)
Residents speaking Spanish at home (%)
Residents speaking Spanish at home - Born in the United States (%)
Residents speaking Spanish at home - Native, born elsewhere (%)
Residents speaking Spanish at home - Foreign born (%)
Residents speaking other language at home (%)
Residents speaking other language at home - Born in the United States (%)
Residents speaking other language at home - Native, born elsewhere (%)
Residents speaking other language at home - Foreign born (%)
Marital status - Never married (%)
Marital status - Now married (%)
Marital status - Separated (%)
Marital status - Widowed (%)
Marital status - Divorced (%)
Ancestries Reported - Arab (%)
Ancestries Reported - Czech (%)
Ancestries Reported - Danish (%)
Ancestries Reported - Dutch (%)
Ancestries Reported - English (%)
Ancestries Reported - French (%)
Ancestries Reported - French Canadian (%)
Ancestries Reported - German (%)
Ancestries Reported - Greek (%)
Ancestries Reported - Hungarian (%)
Ancestries Reported - Irish (%)
Ancestries Reported - Italian (%)
Ancestries Reported - Lithuanian (%)
Ancestries Reported - Norwegian (%)
Ancestries Reported - Polish (%)
Ancestries Reported - Portuguese (%)
Ancestries Reported - Russian (%)
Ancestries Reported - Scotch-Irish (%)
Ancestries Reported - Scottish (%)
Ancestries Reported - Slovak (%)
Ancestries Reported - Subsaharan African (%)
Ancestries Reported - Swedish (%)
Ancestries Reported - Swiss (%)
Ancestries Reported - Ukrainian (%)
Ancestries Reported - United States (%)
Ancestries Reported - Welsh (%)
Ancestries Reported - West Indian (%)
Ancestries Reported - Other (%)
Geographical mobility - Same house 1 year ago (%)
Geographical mobility - Same house 1 year ago (%) - White
Geographical mobility - Same house 1 year ago (%) - Black or African American
Geographical mobility - Same house 1 year ago (%) - Asian
Geographical mobility - Same house 1 year ago (%) - Hispanic or Latino
Geographical mobility - Same house 1 year ago (%) - American Indian and Alaska Native
Geographical mobility - Same house 1 year ago (%) - Multirace
Geographical mobility - Same house 1 year ago (%) - Other Race
Geographical mobility - Moved within same county (%)
Geographical mobility - Moved within same county (%) - White
Geographical mobility - Moved within same county (%) - Black or African American
Geographical mobility - Moved within same county (%) - Asian
Geographical mobility - Moved within same county (%) - Hispanic or Latino
Geographical mobility - Moved within same county (%) - American Indian and Alaska Native
Geographical mobility - Moved within same county (%) - Multirace
Geographical mobility - Moved within same county (%) - Other Race
Geographical mobility - Moved from different county within same state (%)
Geographical mobility - Moved from different county within same state (%) - White
Geographical mobility - Moved from different county within same state (%) - Black or African American
Geographical mobility - Moved from different county within same state (%) - Asian
Geographical mobility - Moved from different county within same state (%) - Hispanic or Latino
Geographical mobility - Moved from different county within same state (%) - American Indian and Alaska Native
Geographical mobility - Moved from different county within same state (%) - Multirace
Geographical mobility - Moved from different county within same state (%) - Other Race
Geographical mobility - Moved from different state (%)
Geographical mobility - Moved from different state (%) - White
Geographical mobility - Moved from different state (%) - Black or African American
Geographical mobility - Moved from different state (%) - Asian
Geographical mobility - Moved from different state (%) - Hispanic or Latino
Geographical mobility - Moved from different state (%) - American Indian and Alaska Native
Geographical mobility - Moved from different state (%) - Multirace
Geographical mobility - Moved from different state (%) - Other Race
Geographical mobility - Moved from abroad (%)
Geographical mobility - Moved from abroad (%) - White
Geographical mobility - Moved from abroad (%) - Black or African American
Geographical mobility - Moved from abroad (%) - Asian
Geographical mobility - Moved from abroad (%) - Hispanic or Latino
Geographical mobility - Moved from abroad (%) - American Indian and Alaska Native
Geographical mobility - Moved from abroad (%) - Multirace
Geographical mobility - Moved from abroad (%) - Other Race
Place of birth for the foreign-born population - Ireland (%)
Place of birth for the foreign-born population - Denmark (%)
Place of birth for the foreign-born population - Norway (%)
Place of birth for the foreign-born population - Sweden (%)
Place of birth for the foreign-born population - United Kingdom (%)
Place of birth for the foreign-born population - England (%)
Place of birth for the foreign-born population - Scotland (%)
Place of birth for the foreign-born population - Other Northern Europe (%)
Place of birth for the foreign-born population - Austria (%)
Place of birth for the foreign-born population - Belgium (%)
Place of birth for the foreign-born population - France (%)
Place of birth for the foreign-born population - Germany (%)
Place of birth for the foreign-born population - Netherlands (%)
Place of birth for the foreign-born population - Switzerland (%)
Place of birth for the foreign-born population - Other Western Europe (%)
Place of birth for the foreign-born population - Greece (%)
Place of birth for the foreign-born population - Italy (%)
Place of birth for the foreign-born population - Portugal (%)
Place of birth for the foreign-born population - Spain (%)
Place of birth for the foreign-born population - Other Southern Europe (%)
Place of birth for the foreign-born population - Albania (%)
Place of birth for the foreign-born population - Belarus (%)
Place of birth for the foreign-born population - Bosnia and Herzegovina (%)
Place of birth for the foreign-born population - Bulgaria (%)
Place of birth for the foreign-born population - Croatia (%)
Place of birth for the foreign-born population - Czechoslovakia (%)
Place of birth for the foreign-born population - Hungary (%)
Place of birth for the foreign-born population - Latvia (%)
Place of birth for the foreign-born population - Lithuania (%)
Place of birth for the foreign-born population - North Macedonia (Macedonia) (%)
Place of birth for the foreign-born population - Moldova (%)
Place of birth for the foreign-born population - Poland (%)
Place of birth for the foreign-born population - Romania (%)
Place of birth for the foreign-born population - Russia (%)
Place of birth for the foreign-born population - Serbia (%)
Place of birth for the foreign-born population - Ukraine (%)
Place of birth for the foreign-born population - Other Eastern Europe (%)
Place of birth for the foreign-born population - China (%)
Place of birth for the foreign-born population - Hong Kong (%)
Place of birth for the foreign-born population - Taiwan (%)
Place of birth for the foreign-born population - Japan (%)
Place of birth for the foreign-born population - Korea (%)
Place of birth for the foreign-born population - Other Eastern Asia (%)
Place of birth for the foreign-born population - Afghanistan (%)
Place of birth for the foreign-born population - Bangladesh (%)
Place of birth for the foreign-born population - India (%)
Place of birth for the foreign-born population - Iran (%)
Place of birth for the foreign-born population - Kazakhstan (%)
Place of birth for the foreign-born population - Nepal (%)
Place of birth for the foreign-born population - Pakistan (%)
Place of birth for the foreign-born population - Sri Lanka (%)
Place of birth for the foreign-born population - Uzbekistan (%)
Place of birth for the foreign-born population - Other South Central Asia (%)
Place of birth for the foreign-born population - Burma (%)
Place of birth for the foreign-born population - Cambodia (%)
Place of birth for the foreign-born population - Indonesia (%)
Place of birth for the foreign-born population - Laos (%)
Place of birth for the foreign-born population - Malaysia (%)
Place of birth for the foreign-born population - Philippines (%)
Place of birth for the foreign-born population - Singapore (%)
Place of birth for the foreign-born population - Thailand (%)
Place of birth for the foreign-born population - Vietnam (%)
Place of birth for the foreign-born population - Other South Eastern Asia (%)
Place of birth for the foreign-born population - Armenia (%)
Place of birth for the foreign-born population - Iraq (%)
Place of birth for the foreign-born population - Israel (%)
Place of birth for the foreign-born population - Jordan (%)
Place of birth for the foreign-born population - Kuwait (%)
Place of birth for the foreign-born population - Lebanon (%)
Place of birth for the foreign-born population - Saudi Arabia (%)
Place of birth for the foreign-born population - Syria (%)
Place of birth for the foreign-born population - Turkey (%)
Place of birth for the foreign-born population - Yemen (%)
Place of birth for the foreign-born population - Other Western Asia (%)
Place of birth for the foreign-born population - Eritrea (%)
Place of birth for the foreign-born population - Ethiopia (%)
Place of birth for the foreign-born population - Kenya (%)
Place of birth for the foreign-born population - Somalia (%)
Place of birth for the foreign-born population - Uganda (%)
Place of birth for the foreign-born population - Zimbabwe (%)
Place of birth for the foreign-born population - Other Eastern Africa (%)
Place of birth for the foreign-born population - Cameroon (%)
Place of birth for the foreign-born population - Congo (%)
Place of birth for the foreign-born population - Democratic Republic of Congo (Zaire) (%)
Place of birth for the foreign-born population - Other Middle Africa (%)
Place of birth for the foreign-born population - Egypt (%)
Place of birth for the foreign-born population - Morocco (%)
Place of birth for the foreign-born population - Sudan (%)
Place of birth for the foreign-born population - Other Northern Africa (%)
Place of birth for the foreign-born population - South Africa (%)
Place of birth for the foreign-born population - Other Southern Africa (%)
Place of birth for the foreign-born population - Cabo Verde (%)
Place of birth for the foreign-born population - Ghana (%)
Place of birth for the foreign-born population - Liberia (%)
Place of birth for the foreign-born population - Nigeria (%)
Place of birth for the foreign-born population - Senegal (%)
Place of birth for the foreign-born population - Sierra Leone (%)
Place of birth for the foreign-born population - Other Western Africa (%)
Place of birth for the foreign-born population - Australia (%)
Place of birth for the foreign-born population - New Zealand (%)
Place of birth for the foreign-born population - Fiji (%)
Place of birth for the foreign-born population - Micronesia (%)
Place of birth for the foreign-born population - Bahamas (%)
Place of birth for the foreign-born population - Barbados (%)
Place of birth for the foreign-born population - Cuba (%)
Place of birth for the foreign-born population - Dominica (%)
Place of birth for the foreign-born population - Dominican Republic (%)
Place of birth for the foreign-born population - Grenada (%)
Place of birth for the foreign-born population - Haiti (%)
Place of birth for the foreign-born population - Jamaica (%)
Place of birth for the foreign-born population - St. Vincent and the Grenadines (%)
Place of birth for the foreign-born population - Trinidad and Tobago (%)
Place of birth for the foreign-born population - West Indies (%)
Place of birth for the foreign-born population - Other Caribbean (%)
Place of birth for the foreign-born population - Belize (%)
Place of birth for the foreign-born population - Costa Rica (%)
Place of birth for the foreign-born population - El Salvador (%)
Place of birth for the foreign-born population - Guatemala (%)
Place of birth for the foreign-born population - Honduras (%)
Place of birth for the foreign-born population - Mexico (%)
Place of birth for the foreign-born population - Nicaragua (%)
Place of birth for the foreign-born population - Panama (%)
Place of birth for the foreign-born population - Other Central America (%)
Place of birth for the foreign-born population - Argentina (%)
Place of birth for the foreign-born population - Bolivia (%)
Place of birth for the foreign-born population - Brazil (%)
Place of birth for the foreign-born population - Chile (%)
Place of birth for the foreign-born population - Colombia (%)
Place of birth for the foreign-born population - Ecuador (%)
Place of birth for the foreign-born population - Guyana (%)
Place of birth for the foreign-born population - Peru (%)
Place of birth for the foreign-born population - Uruguay (%)
Place of birth for the foreign-born population - Venezuela (%)
Place of birth for the foreign-born population - Other South America (%)
Place of birth for the foreign-born population - Canada (%)
Place of birth for the foreign-born population - Other Northern America (%)
Place of birth for the foreign-born population - Other (%)
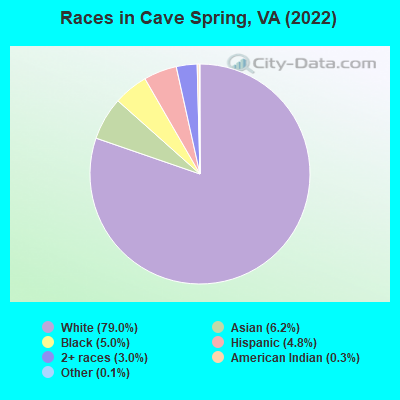
According to 2022 data, the most numerous races in Cave Spring, VA are White alone (20,614 residents), Black alone (1,297 residents), and Hispanic (1,248 residents). 86.3% of Cave Spring residents speak English at home. 11.0% of Cave Spring, VA residents are foreign-born (5.6% born in Asia, 2.3% born in Latin America, 2.0% born in Europe), which is 9.2% less than the foreign-born rate of 12.0% across the entire state of Virginia.
Race distribution in Cave Spring
2000 2022
4,965,637 70.2% White alone 1,376,378 19.4% Black alone 329,540 4.7% Hispanic 259,277 3.7% Asian alone 114,022 1.6% Two or more races 18,596 0.3% American Indian alone 11,685 0.2% Other race alone 3,380 0.05% Native Hawaiian and Other
5,095,130 58.7% White alone 1,594,785 18.4% Black alone 905,750 10.4% Hispanic 602,881 6.9% Asian alone 406,047 4.7% Two or more races 60,419 0.7% Other race alone 11,738 0.1% American Indian alone 6,869 0.08% Native Hawaiian and Other
Income and house value in Cave Spring Median household income in 2022 $82,095 White non-Hispanic householders$68,160 Black householders$91,701 American Indian and Alaska Native householders$113,978 Asian householders$67,885 Some other race householders$68,877 Hispanic or Latino race householdersMedian 2022 house value $304,548 White Non-Hispanic householders$273,201 Black or African American householders$171,608 American Indian or Alaska Native householders $371,819 Asian householders$217,371 Native Hawaiian and other Pacific Islander householders$226,523 Two or more races householders$314,616 Hispanic or Latino householders
Median age by race in Cave Spring
45.0 Median age for White residents41.4 46.4 31.7 Median age for Black or African American residents50.8 16.4 36.8 Median age for American Indian / Alaska Native residents37.3 22.3 43.6 Median age for Asian residents51.3 38.6 -611,955,419.9 Median age for Native Hawaiian / Pacific Islander residents-666,666,666.0 -714,150,046.8 19.1 Median age for Other race residents54.7 12.6 28.4 Median age for Two or more races residents49.5 18.9 45.7 Median age for White alone residents41.6 46.4 31.8 Median age for Hispanic or Latino residents40.1 19.9
Owner/renter occupied households by race in Cave Spring
House owners and renters - White residents 7,073 75.8% Owner occupied2,264 24.2% Renter occupiedHouse owners and renters - Black or African American residents 156 39.3% Owner occupied241 60.7% Renter occupiedHouse owners and renters - American Indian / Alaska Native residents 50 93.6% Owner occupied3 6.4% Renter occupiedHouse owners and renters - Asian residents 284 59.9% Owner occupied190 40.1% Renter occupiedHouse owners and renters - Other race residents 47 100.0% Renter occupiedHouse owners and renters - Two or more races residents 389 74.0% Owner occupied137 26.0% Renter occupiedHouse owners and renters - White alone residents 7,047 76.7% Owner occupied2,144 23.3% Renter occupiedHouse owners and renters - Hispanic or Latino residents 97 23.3% Owner occupied319 76.7% Renter occupied
Language usage in Cave Spring
English speakers - Total 86.3% of residents of Cave Spring speak English at home.
3.6% of residents speak Spanish at home 580 67.4% Speak English very well281 32.6% Speak English less than very well10.5% of residents speak other language at home 1,866 73.3% Speak English very well680 26.7% Speak English less than very well
English speakers - Born in the United States 96.8% of residents of Cave Spring speak English at home.
0.8% of residents speak Spanish at home 62 83.8% Speak English very well12 16.2% Speak English less than very well2.8% of residents speak other language at home 252 100.0% Speak English very well
English speakers - Native, born elsewhere 49.9% of residents of Cave Spring speak English at home.
32.1% of residents speak Spanish at home 104 73.8% Speak English very well37 26.2% Speak English less than very well11.8% of residents speak other language at home 52 100.0% Speak English very well
English speakers - Foreign-born 16.1% of residents of Cave Spring speak English at home.
17.7% of residents speak Spanish at home 281 51.7% Speak English very well263 48.3% Speak English less than very well65.9% of residents speak other language at home 1,347 66.4% Speak English very well683 33.6% Speak English less than very well
White (Caucasian) - Speak only English Native:
97.9% (18,668)Foreign-born:
31.3% (268)
White (Caucasian) - Speak another language Native:
1.8% (341)Foreign-born:
67.7% (581)
Black or African American - Speak only English Native:
98.4% (991)Foreign-born:
89.0% (40)
American Indian / Alaska Native - Speak another language Native:
44.8% (38)Foreign-born:
100.0% (245)
Asian - Speak only English Native:
46.0% (108)Foreign-born:
9.0% (138)
Asian - Speak another language Native:
55.0% (129)Foreign-born:
90.6% (1,380)
Other race - Speak another language Native:
93.1% (69)Foreign-born:
98.4% (28)
Two or more races - Speak only English Native:
72.2% (518)Foreign-born:
14.6% (26)
Two or more races - Speak another language Native:
28.0% (201)Foreign-born:
100.0% (179)
White alone - Speak only English Native:
98.7% (18,516)Foreign-born:
30.5% (260)
White alone - Speak another language Native:
1.2% (233)Foreign-born:
69.4% (593)
Hispanic or Latino - Speak only English Native:
30.5% (177)Foreign-born:
1.0% (5)
Hispanic or Latino - Speak another language Native:
57.0% (331)Foreign-born:
100.0% (486)
Foreign-born residents in Cave Spring 2,866 residents are foreign born (5.6% Asia , 2.3% Latin America , 2.0% Europe ).
This city:
11.0%Virginia:
12.6%
Marital status for residents in Cave Spring Marital status - White (Caucasian) population 15 years and over
Males 28.4% Never married58.5% Now married1.7% Separated3.0% Widowed8.4% DivorcedFemales 24.5% Never married49.9% Now married0.5% Separated10.3% Widowed14.8% DivorcedWomen who gave birth in the past 12 months Now married:
83.2% (115)Unmarried:
16.8% (23)
Women who did not give birth in the past 12 months Now married:
48.7% (2,213)Unmarried:
51.3% (2,327)
Marital status - Black or African American population 15 years and over
Males 40.2% Never married43.4% Now married8.3% Separated0.0% Widowed8.1% DivorcedFemales 52.7% Never married33.3% Now married0.0% Separated0.0% Widowed14.0% DivorcedWomen who did not give birth in the past 12 months Now married:
33.0% (95)Unmarried:
67.0% (193)
Marital status - American Indian / Alaska Native population 15 years and over
Males 61.5% Never married38.5% Now married0.0% Separated0.0% Widowed0.0% DivorcedFemales 56.5% Never married43.5% Now married0.0% Separated0.0% Widowed0.0% DivorcedWomen who gave birth in the past 12 months Now married:
100.0% (6)Unmarried:
0.0% (0)
Women who did not give birth in the past 12 months Now married:
0.0% (0)Unmarried:
100.0% (65)
Marital status - Asian population 15 years and over
Males 32.4% Never married61.2% Now married0.0% Separated1.1% Widowed5.2% DivorcedFemales 26.5% Never married64.4% Now married0.0% Separated6.5% Widowed2.6% DivorcedWomen who gave birth in the past 12 months Now married:
100.0% (37)Unmarried:
0.0% (0)
Women who did not give birth in the past 12 months Now married:
50.4% (205)Unmarried:
49.6% (202)
Marital status - Other race population 15 years and over
Males 85.0% Never married15.0% Now married0.0% Separated0.0% Widowed0.0% DivorcedFemales 70.6% Never married29.4% Now married0.0% Separated0.0% Widowed0.0% DivorcedWomen who did not give birth in the past 12 months Now married:
29.4% (7)Unmarried:
70.6% (16)
Marital status - Two or more races population 15 years and over
Males 39.9% Never married30.9% Now married0.0% Separated0.0% Widowed29.2% DivorcedFemales 50.7% Never married39.1% Now married0.0% Separated5.3% Widowed5.0% DivorcedWomen who did not give birth in the past 12 months Now married:
41.7% (114)Unmarried:
58.3% (159)
Marital status - White alone, not Hispanic / Latino population 15 years and over
Males 28.8% Never married57.9% Now married1.7% Separated3.1% Widowed8.5% DivorcedFemales 24.8% Never married49.0% Now married0.6% Separated10.5% Widowed15.1% DivorcedWomen who gave birth in the past 12 months Now married:
87.3% (117)Unmarried:
12.7% (17)
Women who did not give birth in the past 12 months Now married:
46.9% (2,064)Unmarried:
53.1% (2,335)
Marital status - Hispanic or Latino population 15 years and over
Males 44.1% Never married55.9% Now married0.0% Separated0.0% Widowed0.0% DivorcedFemales 30.9% Never married69.1% Now married0.0% Separated0.0% Widowed0.0% DivorcedWomen who gave birth in the past 12 months Now married:
0.0% (0)Unmarried:
100.0% (7)
Women who did not give birth in the past 12 months Now married:
71.9% (256)Unmarried:
28.1% (100)
Ancestries in Cave Spring
1,703 13.0% English1,464 11.2% American1,081 8.3% German866 6.6% Irish832 6.4% European451 3.4% Italian370 2.8% Polish309 2.4% Scotch-Irish295 2.3% Scottish154 1.2% French118 0.9% British103 0.8% Canadian85 0.6% Brazilian84 0.6% Iraqi84 0.6% Dutch69 0.5% Welsh68 0.5% Yugoslavian61 0.5% Norwegian46 0.4% Northern European36 0.3% Czech35 0.3% Nigerian34 0.3% Belgian27 0.2% Russian25 0.2% Greek18 0.1% Barbadian16 0.1% Austrian16 0.1% Serbian14 0.1% Iranian13 0.10% Danish12 0.09% Lebanese12 0.09% French Canadian10 0.08% Eastern European7 0.05% Pennsylvania German
Children Nativity (place of birth) in Cave Spring
Children under 6 years - Living with two parents Both parents native 919 100.0% NativeBoth parents foreign-born 224 100.0% NativeOne native, one foreign-born parent 234 100.0% NativeChildren under 6 years - Living with one parent Native parent 506 100.0% NativeForeign-born parent 27 100.0% NativeChildren 6 to 17 years - Living with two parents Both parents native 1,650 100.0% NativeBoth parents foreign-born 233 58.4% Native166 41.6% Foreign-bornOne native, one foreign-born parent 103 100.0% NativeChildren 6 to 17 years - Living with one parent Native parent 1,246 100.0% NativeForeign-born parent 18 49.9% Native18 50.1% Foreign-born
Grandparents responsible for own grandchildren in Cave Spring
Grandparents (30 to 59 years) White / Caucasian 27 19.5% Responsible for grandchildren113 80.5% Not responsible for grandchildrenAmerican Indian / Alaska Native 7 100.0% Responsible for grandchildrenWhite alone, not Hispanic / Latino 28 18.2% Responsible for grandchildren126 81.8% Not responsible for grandchildren
Grandparents (60 years and over) White / Caucasian 171 100.0% Not responsible for grandchildrenWhite alone, not Hispanic / Latino 181 100.0% Not responsible for grandchildren