Races in Carthage, Missouri (MO) Detailed Stats
Data:
Races - White alone (%)
Races - White alone (% change since 2000)
Races - Black alone (%)
Races - Black alone (% change since 2000)
Races - American Indian alone (%)
Races - American Indian alone (% change since 2000)
Races - Asian alone (%)
Races - Asian alone (% change since 2000)
Races - Hispanic (%)
Races - Hispanic (% change since 2000)
Races - Native Hawaiian and Other Pacific Islander alone (%)
Races - Native Hawaiian and Other Pacific Islander alone (% change since 2000)
Races - Two or more races(%)
Races - Two or more races(% change since 2000)
Races - Other race alone (%)
Races - Other race alone (% change since 2000)
Racial diversity
Place of birth - Born in state of residence (%)
Place of birth - Born in state of residence (%) - White
Place of birth - Born in state of residence (%) - Black or African American
Place of birth - Born in state of residence (%) - Asian
Place of birth - Born in state of residence (%) - Hispanic or Latino
Place of birth - Born in state of residence (%) - American Indian and Alaska Native
Place of birth - Born in state of residence (%) - Multirace
Place of birth - Born in state of residence (%) - Other Race
Place of birth - Born in other state (%)
Place of birth - Born in other state (%) - White
Place of birth - Born in other state (%) - Black or African American
Place of birth - Born in other state (%) - Asian
Place of birth - Born in other state (%) - Hispanic or Latino
Place of birth - Born in other state (%) - American Indian and Alaska Native
Place of birth - Born in other state (%) - Multirace
Place of birth - Born in other state (%) - Other Race
Place of birth - Native, outside of US (%)
Place of birth - Native, outside of US (%) - White
Place of birth - Native, outside of US (%) - Black or African American
Place of birth - Native, outside of US (%) - Asian
Place of birth - Native, outside of US (%) - Hispanic or Latino
Place of birth - Native, outside of US (%) - American Indian and Alaska Native
Place of birth - Native, outside of US (%) - Multirace
Place of birth - Native, outside of US (%) - Other Race
Place of birth - Foreign born (%)
Place of birth - Foreign born (%) - White
Place of birth - Foreign born (%) - Black or African American
Place of birth - Foreign born (%) - Asian
Place of birth - Foreign born (%) - Hispanic or Latino
Place of birth - Foreign born (%) - American Indian and Alaska Native
Place of birth - Foreign born (%) - Multirace
Place of birth - Foreign born (%) - Other Race
Residents speaking English at home (%)
Residents speaking English at home - Born in the United States (%)
Residents speaking English at home - Native, born elsewhere (%)
Residents speaking English at home - Foreign born (%)
Residents speaking Spanish at home (%)
Residents speaking Spanish at home - Born in the United States (%)
Residents speaking Spanish at home - Native, born elsewhere (%)
Residents speaking Spanish at home - Foreign born (%)
Residents speaking other language at home (%)
Residents speaking other language at home - Born in the United States (%)
Residents speaking other language at home - Native, born elsewhere (%)
Residents speaking other language at home - Foreign born (%)
Marital status - Never married (%)
Marital status - Now married (%)
Marital status - Separated (%)
Marital status - Widowed (%)
Marital status - Divorced (%)
Ancestries Reported - Arab (%)
Ancestries Reported - Czech (%)
Ancestries Reported - Danish (%)
Ancestries Reported - Dutch (%)
Ancestries Reported - English (%)
Ancestries Reported - French (%)
Ancestries Reported - French Canadian (%)
Ancestries Reported - German (%)
Ancestries Reported - Greek (%)
Ancestries Reported - Hungarian (%)
Ancestries Reported - Irish (%)
Ancestries Reported - Italian (%)
Ancestries Reported - Lithuanian (%)
Ancestries Reported - Norwegian (%)
Ancestries Reported - Polish (%)
Ancestries Reported - Portuguese (%)
Ancestries Reported - Russian (%)
Ancestries Reported - Scotch-Irish (%)
Ancestries Reported - Scottish (%)
Ancestries Reported - Slovak (%)
Ancestries Reported - Subsaharan African (%)
Ancestries Reported - Swedish (%)
Ancestries Reported - Swiss (%)
Ancestries Reported - Ukrainian (%)
Ancestries Reported - United States (%)
Ancestries Reported - Welsh (%)
Ancestries Reported - West Indian (%)
Ancestries Reported - Other (%)
Geographical mobility - Same house 1 year ago (%)
Geographical mobility - Same house 1 year ago (%) - White
Geographical mobility - Same house 1 year ago (%) - Black or African American
Geographical mobility - Same house 1 year ago (%) - Asian
Geographical mobility - Same house 1 year ago (%) - Hispanic or Latino
Geographical mobility - Same house 1 year ago (%) - American Indian and Alaska Native
Geographical mobility - Same house 1 year ago (%) - Multirace
Geographical mobility - Same house 1 year ago (%) - Other Race
Geographical mobility - Moved within same county (%)
Geographical mobility - Moved within same county (%) - White
Geographical mobility - Moved within same county (%) - Black or African American
Geographical mobility - Moved within same county (%) - Asian
Geographical mobility - Moved within same county (%) - Hispanic or Latino
Geographical mobility - Moved within same county (%) - American Indian and Alaska Native
Geographical mobility - Moved within same county (%) - Multirace
Geographical mobility - Moved within same county (%) - Other Race
Geographical mobility - Moved from different county within same state (%)
Geographical mobility - Moved from different county within same state (%) - White
Geographical mobility - Moved from different county within same state (%) - Black or African American
Geographical mobility - Moved from different county within same state (%) - Asian
Geographical mobility - Moved from different county within same state (%) - Hispanic or Latino
Geographical mobility - Moved from different county within same state (%) - American Indian and Alaska Native
Geographical mobility - Moved from different county within same state (%) - Multirace
Geographical mobility - Moved from different county within same state (%) - Other Race
Geographical mobility - Moved from different state (%)
Geographical mobility - Moved from different state (%) - White
Geographical mobility - Moved from different state (%) - Black or African American
Geographical mobility - Moved from different state (%) - Asian
Geographical mobility - Moved from different state (%) - Hispanic or Latino
Geographical mobility - Moved from different state (%) - American Indian and Alaska Native
Geographical mobility - Moved from different state (%) - Multirace
Geographical mobility - Moved from different state (%) - Other Race
Geographical mobility - Moved from abroad (%)
Geographical mobility - Moved from abroad (%) - White
Geographical mobility - Moved from abroad (%) - Black or African American
Geographical mobility - Moved from abroad (%) - Asian
Geographical mobility - Moved from abroad (%) - Hispanic or Latino
Geographical mobility - Moved from abroad (%) - American Indian and Alaska Native
Geographical mobility - Moved from abroad (%) - Multirace
Geographical mobility - Moved from abroad (%) - Other Race
Place of birth for the foreign-born population - Ireland (%)
Place of birth for the foreign-born population - Denmark (%)
Place of birth for the foreign-born population - Norway (%)
Place of birth for the foreign-born population - Sweden (%)
Place of birth for the foreign-born population - United Kingdom (%)
Place of birth for the foreign-born population - England (%)
Place of birth for the foreign-born population - Scotland (%)
Place of birth for the foreign-born population - Other Northern Europe (%)
Place of birth for the foreign-born population - Austria (%)
Place of birth for the foreign-born population - Belgium (%)
Place of birth for the foreign-born population - France (%)
Place of birth for the foreign-born population - Germany (%)
Place of birth for the foreign-born population - Netherlands (%)
Place of birth for the foreign-born population - Switzerland (%)
Place of birth for the foreign-born population - Other Western Europe (%)
Place of birth for the foreign-born population - Greece (%)
Place of birth for the foreign-born population - Italy (%)
Place of birth for the foreign-born population - Portugal (%)
Place of birth for the foreign-born population - Spain (%)
Place of birth for the foreign-born population - Other Southern Europe (%)
Place of birth for the foreign-born population - Albania (%)
Place of birth for the foreign-born population - Belarus (%)
Place of birth for the foreign-born population - Bosnia and Herzegovina (%)
Place of birth for the foreign-born population - Bulgaria (%)
Place of birth for the foreign-born population - Croatia (%)
Place of birth for the foreign-born population - Czechoslovakia (%)
Place of birth for the foreign-born population - Hungary (%)
Place of birth for the foreign-born population - Latvia (%)
Place of birth for the foreign-born population - Lithuania (%)
Place of birth for the foreign-born population - North Macedonia (Macedonia) (%)
Place of birth for the foreign-born population - Moldova (%)
Place of birth for the foreign-born population - Poland (%)
Place of birth for the foreign-born population - Romania (%)
Place of birth for the foreign-born population - Russia (%)
Place of birth for the foreign-born population - Serbia (%)
Place of birth for the foreign-born population - Ukraine (%)
Place of birth for the foreign-born population - Other Eastern Europe (%)
Place of birth for the foreign-born population - China (%)
Place of birth for the foreign-born population - Hong Kong (%)
Place of birth for the foreign-born population - Taiwan (%)
Place of birth for the foreign-born population - Japan (%)
Place of birth for the foreign-born population - Korea (%)
Place of birth for the foreign-born population - Other Eastern Asia (%)
Place of birth for the foreign-born population - Afghanistan (%)
Place of birth for the foreign-born population - Bangladesh (%)
Place of birth for the foreign-born population - India (%)
Place of birth for the foreign-born population - Iran (%)
Place of birth for the foreign-born population - Kazakhstan (%)
Place of birth for the foreign-born population - Nepal (%)
Place of birth for the foreign-born population - Pakistan (%)
Place of birth for the foreign-born population - Sri Lanka (%)
Place of birth for the foreign-born population - Uzbekistan (%)
Place of birth for the foreign-born population - Other South Central Asia (%)
Place of birth for the foreign-born population - Burma (%)
Place of birth for the foreign-born population - Cambodia (%)
Place of birth for the foreign-born population - Indonesia (%)
Place of birth for the foreign-born population - Laos (%)
Place of birth for the foreign-born population - Malaysia (%)
Place of birth for the foreign-born population - Philippines (%)
Place of birth for the foreign-born population - Singapore (%)
Place of birth for the foreign-born population - Thailand (%)
Place of birth for the foreign-born population - Vietnam (%)
Place of birth for the foreign-born population - Other South Eastern Asia (%)
Place of birth for the foreign-born population - Armenia (%)
Place of birth for the foreign-born population - Iraq (%)
Place of birth for the foreign-born population - Israel (%)
Place of birth for the foreign-born population - Jordan (%)
Place of birth for the foreign-born population - Kuwait (%)
Place of birth for the foreign-born population - Lebanon (%)
Place of birth for the foreign-born population - Saudi Arabia (%)
Place of birth for the foreign-born population - Syria (%)
Place of birth for the foreign-born population - Turkey (%)
Place of birth for the foreign-born population - Yemen (%)
Place of birth for the foreign-born population - Other Western Asia (%)
Place of birth for the foreign-born population - Eritrea (%)
Place of birth for the foreign-born population - Ethiopia (%)
Place of birth for the foreign-born population - Kenya (%)
Place of birth for the foreign-born population - Somalia (%)
Place of birth for the foreign-born population - Uganda (%)
Place of birth for the foreign-born population - Zimbabwe (%)
Place of birth for the foreign-born population - Other Eastern Africa (%)
Place of birth for the foreign-born population - Cameroon (%)
Place of birth for the foreign-born population - Congo (%)
Place of birth for the foreign-born population - Democratic Republic of Congo (Zaire) (%)
Place of birth for the foreign-born population - Other Middle Africa (%)
Place of birth for the foreign-born population - Egypt (%)
Place of birth for the foreign-born population - Morocco (%)
Place of birth for the foreign-born population - Sudan (%)
Place of birth for the foreign-born population - Other Northern Africa (%)
Place of birth for the foreign-born population - South Africa (%)
Place of birth for the foreign-born population - Other Southern Africa (%)
Place of birth for the foreign-born population - Cabo Verde (%)
Place of birth for the foreign-born population - Ghana (%)
Place of birth for the foreign-born population - Liberia (%)
Place of birth for the foreign-born population - Nigeria (%)
Place of birth for the foreign-born population - Senegal (%)
Place of birth for the foreign-born population - Sierra Leone (%)
Place of birth for the foreign-born population - Other Western Africa (%)
Place of birth for the foreign-born population - Australia (%)
Place of birth for the foreign-born population - New Zealand (%)
Place of birth for the foreign-born population - Fiji (%)
Place of birth for the foreign-born population - Micronesia (%)
Place of birth for the foreign-born population - Bahamas (%)
Place of birth for the foreign-born population - Barbados (%)
Place of birth for the foreign-born population - Cuba (%)
Place of birth for the foreign-born population - Dominica (%)
Place of birth for the foreign-born population - Dominican Republic (%)
Place of birth for the foreign-born population - Grenada (%)
Place of birth for the foreign-born population - Haiti (%)
Place of birth for the foreign-born population - Jamaica (%)
Place of birth for the foreign-born population - St. Vincent and the Grenadines (%)
Place of birth for the foreign-born population - Trinidad and Tobago (%)
Place of birth for the foreign-born population - West Indies (%)
Place of birth for the foreign-born population - Other Caribbean (%)
Place of birth for the foreign-born population - Belize (%)
Place of birth for the foreign-born population - Costa Rica (%)
Place of birth for the foreign-born population - El Salvador (%)
Place of birth for the foreign-born population - Guatemala (%)
Place of birth for the foreign-born population - Honduras (%)
Place of birth for the foreign-born population - Mexico (%)
Place of birth for the foreign-born population - Nicaragua (%)
Place of birth for the foreign-born population - Panama (%)
Place of birth for the foreign-born population - Other Central America (%)
Place of birth for the foreign-born population - Argentina (%)
Place of birth for the foreign-born population - Bolivia (%)
Place of birth for the foreign-born population - Brazil (%)
Place of birth for the foreign-born population - Chile (%)
Place of birth for the foreign-born population - Colombia (%)
Place of birth for the foreign-born population - Ecuador (%)
Place of birth for the foreign-born population - Guyana (%)
Place of birth for the foreign-born population - Peru (%)
Place of birth for the foreign-born population - Uruguay (%)
Place of birth for the foreign-born population - Venezuela (%)
Place of birth for the foreign-born population - Other South America (%)
Place of birth for the foreign-born population - Canada (%)
Place of birth for the foreign-born population - Other Northern America (%)
Place of birth for the foreign-born population - Other (%)
Latest news about races in Carthage, MO collected exclusively by city-data.com from local newspapers, TV, and radio stations
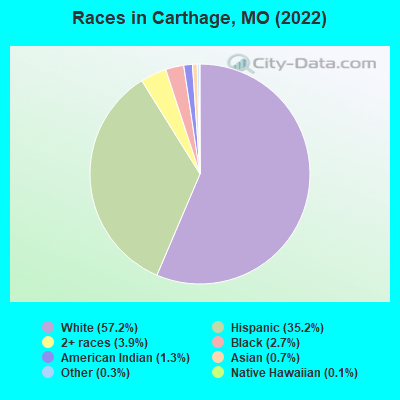
According to 2022 data, the most numerous races in Carthage, MO are White alone (8,946 residents), Black alone (417 residents), and Two or more races (609 residents). 71.4% of Carthage residents speak English at home. 13.8% of Carthage, MO residents are foreign-born (13.2% born in Latin America), which is 71.0% greater than the foreign-born rate of 4.0% across the entire state of Missouri.
Race distribution in Carthage
2000 2022
4,686,474 83.8% White alone 625,667 11.2% Black alone 118,592 2.1% Hispanic 71,905 1.3% Two or more races 61,041 1.1% Asian alone 23,302 0.4% American Indian alone 5,291 0.09% Other race alone 2,939 0.05% Native Hawaiian and Other
4,733,411 76.6% White alone 656,739 10.6% Black alone 316,300 5.1% Two or more races 291,763 4.7% Hispanic 132,436 2.1% Asian alone 27,467 0.4% Other race alone 12,313 0.2% American Indian alone 7,528 0.1% Native Hawaiian and Other
Income and house value in Carthage Median household income in 2022 $45,255 White non-Hispanic householders$121,842 Black householders$33,981 Some other race householders$29,999 Hispanic or Latino race householdersMedian 2022 house value $141,586 White Non-Hispanic householders$91,700 Black or African American householders$218,615 American Indian or Alaska Native householders$85,098 Some other race householders$148,677 Two or more races householders$109,307 Hispanic or Latino householders
Median age by race in Carthage
32.9 Median age for White residents30.3 37.8 34.8 Median age for Black or African American residents60.4 23.2 31.0 Median age for American Indian / Alaska Native residents16.4 32.6 47.9 Median age for Asian residents40.1 32.8 -570,349,385.6 Median age for Native Hawaiian / Pacific Islander residents-552,434,456.4 -1,304,452,465.6 23.5 Median age for Other race residents43.5 25.9 28.7 Median age for Two or more races residents38.9 19.7 35.8 Median age for White alone residents30.1 40.3 24.1 Median age for Hispanic or Latino residents32.2 18.8
Owner/renter occupied households by race in Carthage
House owners and renters - White residents 2,243 50.3% Owner occupied2,212 49.7% Renter occupiedHouse owners and renters - Black or African American residents 49 44.3% Owner occupied62 55.7% Renter occupiedHouse owners and renters - American Indian / Alaska Native residents 100 100.0% Renter occupiedHouse owners and renters - Asian residents 6 100.0% Renter occupiedHouse owners and renters - Native Hawaiian / Pacific Islander residents 7 100.0% Renter occupiedHouse owners and renters - Other race residents 101 24.1% Owner occupied317 75.9% Renter occupiedHouse owners and renters - Two or more races residents 438 61.7% Owner occupied272 38.3% Renter occupiedHouse owners and renters - White alone residents 2,029 56.7% Owner occupied1,553 43.3% Renter occupiedHouse owners and renters - Hispanic or Latino residents 601 38.6% Owner occupied956 61.4% Renter occupied
Language usage in Carthage
English speakers - Total 71.4% of residents of Carthage speak English at home.
26.3% of residents speak Spanish at home 2,656 70.4% Speak English very well1,119 29.6% Speak English less than very well0.7% of residents speak other language at home 81 81.8% Speak English very well18 18.2% Speak English less than very well
English speakers - Born in the United States 89.0% of residents of Carthage speak English at home.
13.8% of residents speak Spanish at home 547 97.2% Speak English very well16 2.8% Speak English less than very well1.0% of residents speak other language at home 42 100.0% Speak English very well
English speakers - Native, born elsewhere 11.3% of residents of Carthage speak English at home.
66.0% of residents speak Spanish at home 93 100.0% Speak English very well
English speakers - Foreign-born 12.7% of residents of Carthage speak English at home.
70.4% of residents speak Spanish at home 266 27.0% Speak English very well721 73.0% Speak English less than very well3.6% of residents speak other language at home 31 60.8% Speak English very well20 39.2% Speak English less than very well
White (Caucasian) - Speak only English Native:
87.3% (8,247)Foreign-born:
4.2% (47)
White (Caucasian) - Speak another language Native:
11.4% (1,075)Foreign-born:
94.9% (1,048)
Asian - Speak another language Native:
84.9% (45)Foreign-born:
69.3% (45)
Other race - Speak only English Native:
19.9% (156)Foreign-born:
8.3% (33)
Other race - Speak another language Native:
70.6% (554)Foreign-born:
89.5% (360)
Two or more races - Speak only English Native:
66.7% (988)Foreign-born:
7.3% (40)
Two or more races - Speak another language Native:
49.1% (727)Foreign-born:
86.8% (473)
White alone - Speak only English Native:
99.7% (8,017)Foreign-born:
70.9% (47)
White alone - Speak another language Native:
0.2% (20)Foreign-born:
20.2% (13)
Hispanic or Latino - Speak only English Native:
21.1% (737)Foreign-born:
7.1% (80)
Hispanic or Latino - Speak another language Native:
86.7% (3,024)Foreign-born:
92.6% (1,041)
Foreign-born residents in Carthage 2,158 residents are foreign born (13.2% Latin America ).
This city:
13.8%Missouri:
4.2%
Marital status for residents in Carthage Marital status - White (Caucasian) population 15 years and over
Males 38.4% Never married44.7% Now married2.7% Separated3.5% Widowed10.8% DivorcedFemales 24.5% Never married34.5% Now married9.4% Separated14.2% Widowed17.4% DivorcedWomen who gave birth in the past 12 months Now married:
71.3% (133)Unmarried:
28.7% (53)
Women who did not give birth in the past 12 months Now married:
50.1% (1,461)Unmarried:
49.9% (1,458)
Marital status - Black or African American population 15 years and over
Males 33.8% Never married34.7% Now married26.9% Separated0.0% Widowed4.6% DivorcedFemales 49.2% Never married38.9% Now married0.0% Separated4.0% Widowed7.9% DivorcedWomen who did not give birth in the past 12 months Now married:
40.5% (46)Unmarried:
59.5% (68)
Marital status - American Indian / Alaska Native population 15 years and over
Males 40.6% Never married39.1% Now married0.0% Separated5.8% Widowed14.5% DivorcedFemales 0.0% Never married40.3% Now married0.0% Separated28.6% Widowed31.1% DivorcedWomen who did not give birth in the past 12 months Now married:
56.5% (47)Unmarried:
43.5% (36)
Marital status - Asian population 15 years and over
Males 100.0% Never married0.0% Now married0.0% Separated0.0% Widowed0.0% DivorcedFemales 76.9% Never married0.0% Now married0.0% Separated0.0% Widowed23.1% DivorcedWomen who did not give birth in the past 12 months Now married:
0.0% (0)Unmarried:
100.0% (17)
Marital status - Native Hawaiian / Pacific Islander population 15 years and over
Males 0.0% Never married100.0% Now married0.0% Separated0.0% Widowed0.0% DivorcedFemales 0.0% Never married100.0% Now married0.0% Separated0.0% Widowed0.0% DivorcedWomen who did not give birth in the past 12 months Now married:
100.0% (6)Unmarried:
0.0% (0)
Marital status - Other race population 15 years and over
Males 0.0% Never married87.3% Now married3.0% Separated0.0% Widowed9.7% DivorcedFemales 38.7% Never married44.4% Now married0.0% Separated5.5% Widowed11.5% DivorcedWomen who gave birth in the past 12 months Now married:
100.0% (28)Unmarried:
0.0% (0)
Women who did not give birth in the past 12 months Now married:
39.0% (146)Unmarried:
61.0% (229)
Marital status - Two or more races population 15 years and over
Males 47.4% Never married37.9% Now married0.0% Separated1.8% Widowed13.0% DivorcedFemales 55.8% Never married26.5% Now married3.2% Separated4.8% Widowed9.7% DivorcedWomen who gave birth in the past 12 months Now married:
0.0% (0)Unmarried:
100.0% (16)
Women who did not give birth in the past 12 months Now married:
31.4% (168)Unmarried:
68.6% (367)
Marital status - White alone, not Hispanic / Latino population 15 years and over
Males 29.6% Never married51.8% Now married0.2% Separated4.4% Widowed13.9% DivorcedFemales 19.9% Never married43.0% Now married3.2% Separated13.3% Widowed20.7% DivorcedWomen who gave birth in the past 12 months Now married:
61.4% (87)Unmarried:
38.6% (55)
Women who did not give birth in the past 12 months Now married:
51.9% (1,054)Unmarried:
48.1% (977)
Marital status - Hispanic or Latino population 15 years and over
Males 53.3% Never married36.2% Now married6.4% Separated0.0% Widowed4.1% DivorcedFemales 42.0% Never married20.5% Now married19.2% Separated12.7% Widowed5.5% DivorcedWomen who gave birth in the past 12 months Now married:
100.0% (73)Unmarried:
0.0% (0)
Women who did not give birth in the past 12 months Now married:
44.0% (667)Unmarried:
56.0% (848)
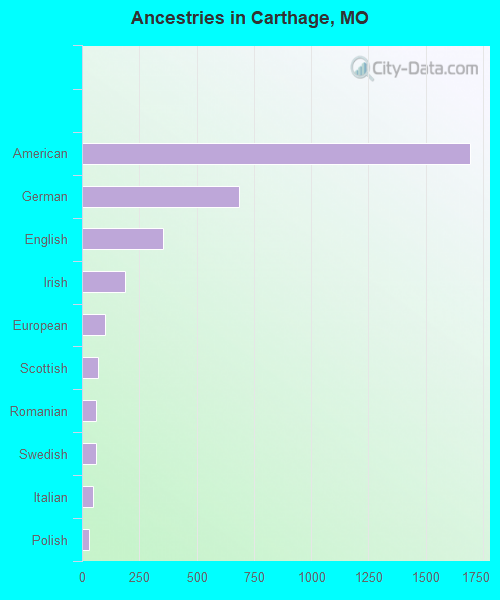
Ancestries in Carthage
1,692 19.8% American684 8.0% German352 4.1% English189 2.2% Irish102 1.2% European70 0.8% Scottish63 0.7% Romanian62 0.7% Swedish47 0.6% Italian29 0.3% Polish14 0.2% British9 0.1% Hungarian7 0.08% Northern European6 0.07% Iranian5 0.06% Scotch-Irish
Geographical mobility in Carthage Same house 1 year ago 9,621 83.2% White (Caucasian)295 84.1% Black or African American163 70.5% American Indian / Alaska Native108 93.9% Asian1,109 80.9% Other race2,086 96.7% Two or more races7,039 79.9% White alone, not Hispanic / Latino4,967 92.5% Hispanic or LatinoMoved within same county 1,156 10.0% White / Caucasian13 3.8% Black or African American2 0.9% American Indian / Alaska Native28 2.1% Other race20 0.9% Two or more races1,043 11.8% White alone, not Hispanic / Latino130 2.4% Hispanic or LatinoMoved within same state 272 2.4% White / Caucasian5 1.4% Black or African American9 3.9% American Indian / Alaska Native15 1.1% Other race26 1.2% Two or more races269 3.0% White alone, not Hispanic / Latino22 0.4% Hispanic or LatinoMoved from different state 412 3.6% White / Caucasian39 11.0% Black or African American65 28.1% American Indian / Alaska Native9 7.6% Asian7 46.3% Native Hawaiian / Pacific Islander205 15.0% Other race58 2.7% Two or more races413 4.7% White alone, not Hispanic / Latino125 2.3% Hispanic or LatinoMoved from abroad 78 0.7% White6 37.7% Native Hawaiian / Pacific Islander18 1.3% Other race111 2.1% Hispanic or Latino
Children Nativity (place of birth) in Carthage
Children under 6 years - Living with two parents Both parents native 639 100.0% NativeBoth parents foreign-born 155 100.0% NativeOne native, one foreign-born parent 98 100.0% NativeChildren under 6 years - Living with one parent Native parent 364 100.0% NativeForeign-born parent 110 61.8% Native68 38.2% Foreign-bornChildren 6 to 17 years - Living with two parents Both parents native 1,302 100.0% NativeBoth parents foreign-born 353 96.1% Native14 3.9% Foreign-bornOne native, one foreign-born parent 122 100.0% NativeChildren 6 to 17 years - Living with one parent Native parent 832 100.0% NativeForeign-born parent 482 55.3% Native389 44.7% Foreign-born
Grandparents responsible for own grandchildren in Carthage
Grandparents (30 to 59 years) White / Caucasian 63 36.4% Responsible for grandchildren110 63.6% Not responsible for grandchildrenWhite alone, not Hispanic / Latino 64 34.3% Responsible for grandchildren122 65.7% Not responsible for grandchildrenGrandparents (60 years and over) White / Caucasian 83 45.5% Responsible for grandchildren99 54.5% Not responsible for grandchildrenWhite alone, not Hispanic / Latino 57 41.9% Responsible for grandchildren80 58.1% Not responsible for grandchildren